
記住我


African green monkey kidney (Vero), human embryonic kidney cells 293T (293T) and porcine kidney-15 (PK-15) cells were preserved by our laboratory and cultured in Dulbecco’s modified Eagle’s medium (DMEM, Hyclone) supplemented with 10% heat-inactivated fetal bovine serum (FBS, Gibco), streptomycin (100 µg/mL), and penicillin (100 IU/mL) at 37 °C in 5% CO2. PRV QYY2012 strain was isolated from a piglet with neurological symptom in Henan province of China in 2012, and PRV ΔgE/TK strain was obtained by deletion of gE and TK genes based on PRV QYY2012 strain through homologous recombination and Cre/LoxP system. All viruses were propagated in Vero cells.
Experimental animal6-week-old female Kunming mice were purchased from Henan Experimental Animal Center, Zhengzhou, China.
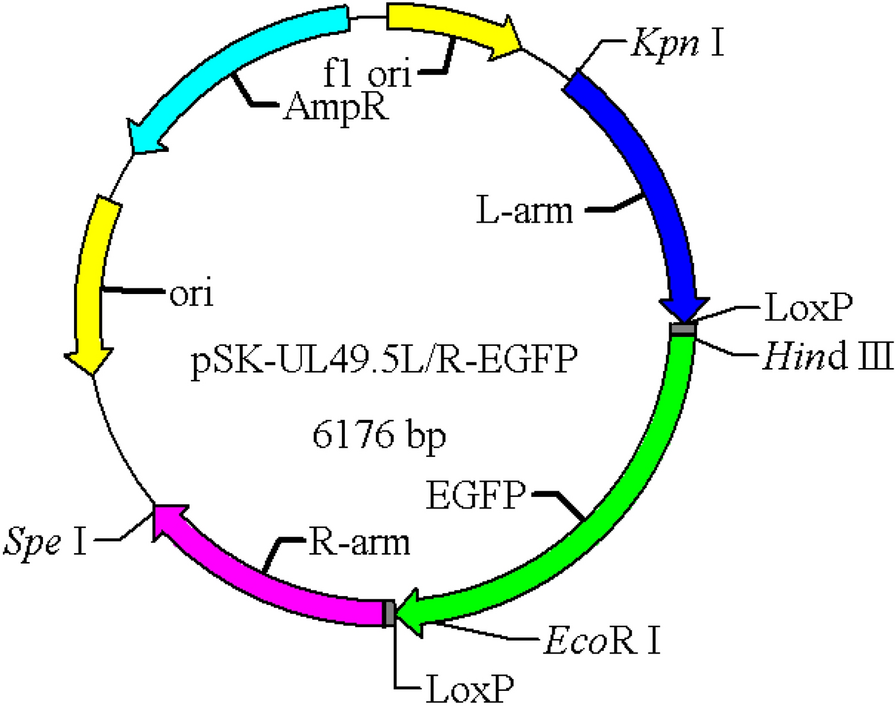
Construction of recombinant plasmid and virusThe PRV QYY2012 strain genome was used as the template for PCR amplification. The left and right homologous arms (L-arm (960 bp) and R-arm (896 bp)) of PRV UL49.5 gene were amplified by primers UL49.5L-F/R and UL49.5R-F/R, respectively, in which there was a LoxP site downstream of the L-arm and upstream of the R-arm. The L-arm contained Kpn I and Hind III restriction sites, and the R-arm contained EcoR I and Spe I restriction sites. The digested products were purified by gel extraction and ligated with pBluescriptSK(-) vector (Hunan Keai Medical Equipment Co., Ltd.) to construct the recombinant plasmid pSK-UL49.5L/R. Using pEGFP vector as template, the CMV-EGFP-SV40 fragment was amplified by EGFP-F/R with primers containing Hind III and EcoR I restriction sites. The digested products were ligated into the same digested pSK-UL49.5L/R vector to construct the recombinant plasmid pSK-UL49.5L/R-EGFP (Fig. 1).The recombinant plasmid was confirmed by DNA sequencing. All primers used to amplify the sequence are listed in Table 1.
Fig. 1
pSK-UL49.5L/R-EGFP recombinant plasmid
Table 1 Primers that were used in this studyThe genomic DNA of PRV ΔgE/TK strain and pSK-UL49.5L/R-EGFP plasmid were co-transfected into a 6-well plate with monolayer 293 T cells by Lipofectamine® 2000 transfection reagent (Invitrogen). In a 6-well plate, 1 μg of PRV ΔgE/TK genome was added to each well, and the mass ratios of PRV ΔgE/TK genome and recombinant plasmid pSK-UL49.5L/R-EGFP were 1∶2, 1∶3 and 2∶3, respectively, and the ratio of gene mass to the volume of transfection reagent Lipofectamine2000 was 1∶2.5. When there was obvious cytopathic effect (CPE), the transfection mixture was collected, diluted to 10–3 at a tenfold ratio and inoculated into a 6-well plate with Vero cells. After adsorption for 2 h, it was replaced with DMEM culture medium containing 2% serum and 1% low-melting point agarose. After 48 h, the fluorescent lesions were observed under a fluorescence microscope. The fluorescent lesions were selected and placed into a centrifuge tube containing 1ml of DMEM medium, and plaque purification was carried out according to the above operations. The completely purified recombinant virus PRV ΔgE/TK/UL49.5/EGFP+ strain was obtained through this plaque purification method. The genomic DNA of PRV ΔgE/TK/UL49.5/EGFP+ strain and pcGlobin2-Cre plasmid were co-transfected into 293 T cells, and the recombinant virus PRV ΔgE/TK/UL49.5 strain without green fluorescent protein was obtained by plaque purification. PRV ΔgE/TK/UL49.5 strain was PCR identified with primers UL49.5-F/R and sequenced.
Growth characteristics of PRV ΔgE/TK/UL49.5 strainTo analyze the growth characteristics of different PRV strains in vitro, PRV QYY2012, PRV ∆gE/TK or PRV ∆gE/TK/UL49.5 were used to infect Vero cells in six-well cell plates at multiplicity of infection (MOI) of 1 respectively, and normal Vero cells were used as negative control. The cell supernatants were collected at 6, 12, 24, 36, 48, 60, and 72 h after infection, and the virus titers were determined by Reed-Muench method, and the one-step growth curves was drawn. Three replicates were set for each experiment. The virus solution collected at each time was diluted 10 times, and the dilutions of 10–1–10–10 were respectively added to a 96-well plates covered with Vero cells, and used as a blank control. Place it in a 5% CO2 incubator at 37 °C for 72 h to observe the diseased wells.
Effect of PRV UL49.5 on SLA-I transcription levelIn order to detect the level of SLA-I transcription in PK-15 cells infected with different PRV strains, PRV ∆gE/TK/UL49.5, PRV ∆gE/TK and PRV QYY2012 were inoculated into PK-15 cells at MOI = 0.1, while the overexpression of pUL49.5 plasmid in PK-15 cells was used as control. The cells were collected at 6, 12, 18, and 24 h after infection or transfection, RNA was extracted according to the instructions of the RNA extraction kit, 3 μg of samples were reverse transcribed into cDNA according to the instructions of the reverse transcription kit. SLA-I was amplified by primer SLA-I-qF/R, porcine β-actin gene was used as internal reference, and the relative expression of SLA-I was calculated by 2−ΔΔCt method. Three replicates were set for each experiment.
Vaccination and challengeEighty 6-week-old healthy female Kunming mice were randomly divided into 4 groups with 20 mice in each group. The mice in groups 1–2 were hindlimb intramuscularly (i.m.) inoculated with 1 × 10⁶ TCID50 PRV ΔgE/TK/UL49.5 and PRV ΔgE/TK, respectively. The mice in groups 3–4 were hindlimb intramuscularly (i.m.) inoculated with 100 μL DMEM in the non-immunized group (positive control group) and negative control group, respectively. The booster immunization with the same dose and inoculation route was performed 21 days post-immunization (dpi). The immunized mice were weighed at the first immunization, 21 days after the first immunization and 21 days after the booster immunization. The serum of mice were collected through the tail vein on 7, 14, 21, 28, 35, 42, and 49 days after the first immunization, and the serum neutralizing antibody test was used to detect the level of PRV-specific neutralizing antibody in mice. The serum of mice was collected 21 days after booster immunization, and the expression levels of cytokines IFN-γ and IL-4 in immunized mice were detected by ELISA. On day 21 after booster immunization, mice in groups 1–3 were hindlimb intramuscularly (i.m.) injected with 4 × 10⁴ TCID50 PRV QYY2012 strain through the hindlimb muscle, and mice in the negative control group 4 were injected with DMEM. The clinical response and survival rate of mice were observed and recorded daily for 14 consecutive days after challenge. On the 14th day after challenge, the mice were euthanized with CO2 asphyxiation. The lung, brain and trigeminal ganglion of mice in each group were collected. The viral load was determined by qPCR, and histopathological analysis was performed.
Neutralizing antibody detectionBlood samples were collected from the tail of immunized mice at 7, 14, 21, 28, 35, 42, 49 days after the first immunization, and serum samples were tested for PRV specific neutralizing antibodies (NAbs) by virus serum neutralization test (NT) as previously described [28]. Briefly, the collected serum samples were inactivated at 56 °C for 30 min in a water bath, diluted with DMEM by two-fold serially, mixed with an equal volume of 200 TCID50 PRV QYY2012 strain, incubated at 37 °C for 1 h, and 100 μL was inoculated into a 96-well plate covered with Vero cells, and incubated at 37 °C for 72 h. The neutralizing antibody titer was calculated by Reed-Muench method. Three replicates were set for each experiment.
Cytokine detectionOn the 21st day after booster immunization, the peripheral blood of immunized mice was collected, centrifuged at 3500 r/min for 10 min, and the supernatant was taken. The expression levels of cytokines IFN-γ and IL-4 were detected by ELISA (mouse IFN-γ ELISA kit and mouse IL-4 ELISA kit, Jiangsu Enzyme Immunization Industrial Co., Ltd). Three replicates were set for each experiment.
Histopathological examinations and tissue viral load analysisOn the 14th day after challenge, the lung, brain and trigeminal ganglion of mice in each group were collected, and the viral load was determined by qPCR, and histopathological analysis was performed. Briefly, the collected lung, brain and trigeminal ganglion were fixed with 4% paraformaldehyde, and the histopathological sections were prepared by paraffin embedding. The pathological changes of each tissue were observed by optical microscope after HE staining. Tissue virus load was determined by designing specific primers gE-qF/R based on PRVgE gene and detecting the copy number of tissue virus genome by real-time quantitative PCR (qPCR). The upstream primer gE-qF: 5′-CTTCCACTCGCAGCTCTTCT-3′, and the downstream primer gE-qR: 5′-TAGATGCAGGGCTCGTACAC-3′.
Statistical analysisThe data were plotted by GraphPad Prism 9.0 software (San Diego, California USA, www.graphpad.com), and the data were expressed as mean ± standard deviation (SD). SPSS27 software was used to analyze the variance of the experimental data. For all experiments, p < 0.05 was considered significant difference (*), and p < 0.01 was considered extremely significant difference (**).
留言 (0)