
記住我


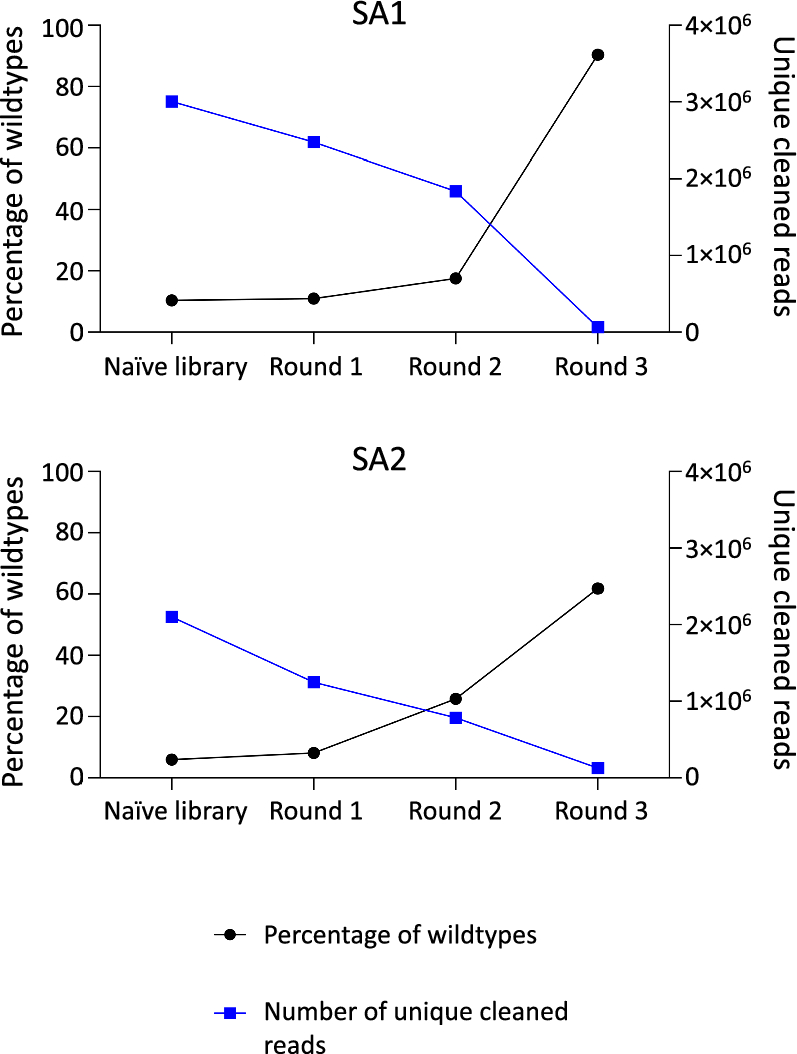


The FASTQ files from NGS were processed using Python scripts. The files were cleaned based on their Phred score and whether they contained a peptide insert or not (See Materials and Methods; Sect. Analysis of NGS data). For each sample, the total number of reads, the number of cleaned reads, and the number of removed reads are found in Supplementary Tables A1 and A2. Additionally, the percentage of reads that did not contain a peptide insert was determined. These were denoted as the percentage of wildtype reads (Supplementary Tables A1 and A2). It was found that the frequency of wildtypes increases during rounds of amplification in both lots. The naïve library used in SA1 contains 10.36% wildtypes and during the experiment, this increases to an average of 90.37% in round 3. In the naïve library used in SA2, the percentage of wildtypes is lower (5.99%), and the amplified phage pool also represents a lower percentage of wildtypes in round 3 (an average of 61.81%). The number of unique reads shows variation in the naïve library of two lots and is decreased during amplification rounds with the largest reduction in round 3. These findings are illustrated in Fig. 1. Although the increased frequency of wildtype clones and reduced number of unique clones are observed in both SA1 and SA2, the two different lots of the library display a remarkable discrepancy in quantitative changes of these compositional features both in the naïve library and during serial amplification-driven evolution of the library.
Fig. 1
Overview of the percentage of wildtypes (black) and the number of unique reads (blue) in the two lots in the naive library and through the different rounds of amplification. SA1: Serial amplification experiment 1 and SA2: Serial amplification experiment 2
For subsequent analyses, the replicates in each round were merged. The merged files also contained the calculation of EF. The merged files containing all sequences were used to prepare the stacked bar plots (Sect. Diversity changes follow lot-specific patterns during amplification). All sequences with an EF value were used for the analysis of overlapping sequences between amplification rounds (Sect. The library lots are completely heterogeneous in sequence composition and become more homogeneous during amplification) and the EF distribution (Sect. The distribution of enrichment factors of peptides becomes more divergent during amplification with substantial discrepancies between lots). For the analysis of global and positional frequencies of amino acids (Sect. Global and positional frequencies of amino acids indicate distinct compositional changes between lots and during amplification), the top 1000 sequences with EF > 1 were used. For motif analysis (Sect. Motif analysis led to the identification of some motifs with probable association with a higher amplification rate of phage clones), the top 18,622 sequences with EF > 1 were included for motif discovery in the primary structure of peptides and all sequences with EF > 1 were used for motif discovery in the secondary structure of peptides. This is illustrated in Fig. 2.
Fig. 2
Overview of how the merged files representing sequences from different replicates were generated and how the generated files were used for different analyses. The figure was created with BioRender.com
Diversity changes follow lot-specific patterns during amplificationTo assess the diversity of peptide pools, the percentage of distinct sequences was calculated in the naive library and during amplification for each lot. The results can be found in Supplementary Tables A1 and A2 for SA1 and SA2, respectively. In the naïve library, considerable differences in the percentage of distinct sequences can be observed between lots. In the naïve library used in SA1 experiment, there are 61.89% distinct sequences, whereas the percentage of distinct sequences in the naïve library for SA2 experiment is 96.66%. The biggest alterations in the percentage of distinct sequences during amplification are observed in SA2 (ranging from 96.7% in the naïve library to an average of 24.6% after the third round of amplification). In SA1, the percentage of distinct sequences exhibited less variation during serial amplification (61.9% in the naïve library and an average of 57.7% after the third round of amplification). We also investigated the composition of different lots, both the naïve and amplified libraries, by cataloging peptides into frequency-based populations and illustrating the distribution of different populations within each sample through stacked bar plots. Here, each sample was grouped into bins of different frequencies (Fig. 3). Through rounds of amplification, it is expected that the population of singletons (sequences with a single copy) decreases, and peptide sequences with high abundances increase in copy number.
Fig. 3
Stacked bar plots visualizing the frequency distribution of sequences observed in NGS data from the SA1 and SA2 experiments. Peptide sequences were grouped into bins (shown by different colors) according to their copy number. c.p.: copy number
There was a remarkable difference in the proportion of singletons between the naïve libraries of the two lots (45.58% for SA1 and 93.62% for SA2). Furthermore, both lots indicate the trend of a decreasing singleton population as well as an increase in the population of repeated sequences (i.e., non-singletons) during amplification, which was reflected by enlargement of the previously existing bins representing non-singletons (with lower frequencies) and appearance of new bins representing highly frequent peptides. Of note, round 3 of SA1 was an exception, which exhibited an increased percentage of the singleton population. This observation might be ascribed to the higher diversity of the singleton population in SA1 compared to SA2 (Supplementary Table A3), leading to less elimination of the members of this population from the SA1 phage pool. However, the enhanced percentage of singletons in round 3 of SA1 was accompanied by a decrease in the number of unique sequences in the singletons, highlighting a decline in the size of this population similar to other rounds of amplification. The data used to generate Fig. 3 can be found in Supplementary Table A3. In general, the reduced percentage of distinct sequences as well as the decreased number of singletons provides evidence for the diminished diversity of phage display libraries during serial amplification of the pool and that there is a substantial heterogeneity between lots in the observed pattern of diversity changes.
The library lots are completely heterogeneous in sequence composition and become more homogeneous during amplificationTo investigate the heterogeneity of the two libraries in sequence composition, the number of common sequences in the naive library and different rounds of amplification was calculated for both experiments. Initially, it was found that no sequences were common between both lots, highlighting the large extent of heterogeneity of the two lots. In Fig. 4, the number of overlapping sequences for the different datasets of the two experiments is shown. As indicated in the Venn diagrams, for both lots there is a remarkable reduction in the number of common sequences between the naive library and consecutive amplification rounds shown by comparison at two levels as follows: NL-R1 (498,111) > NL-R2 (208,302) > NL-R3 (4,637) for SA1 and NL-R1 (110,274) > NL-R2 (68,624) > NL-R3 (9740) as well as NL-R1\(\_\)NL-R2 (800,088) > NL-R2\(\_\)NL-R3 (3986) for SA1 and NL-R1\(\_\)NL-R2 (16,546) > NL-R2\(\_\)NL-R3 (2141) for SA2, which highlights homogenization of the phage pools during amplification. The numbers in parentheses represent the number of common sequences between the datasets that are compared together. The two lots display substantial differences in decreasing number of common sequenecs during amplification at both levels of the above-mentioned comparisons as well as the number of common sequences among NL-R1\(\_\)NL-R2\(\_\)NL-R3 which is 51,137 for SA1 and 4513 for SA2. The increased homogeneity of phage populations can be attributed to the elimination of clones from the pool that is driven by amplification.
Fig. 4
Illustration of the number of common sequences between the naïve library and different rounds of amplification for SA1 and SA2. In addition to the number of common sequences between the different datasets, the related percentages of sequences are also stated in parentheses
The distribution of enrichment factors of peptides becomes more divergent during amplification with substantial discrepancies between lotsTo monitor the enrichment profile of sequences during serial amplification of the phage library, EF was calculated for the peptides. Using EF, peptides with actual enrichment during rounds of amplification can be identified. Relying on the absolute copy number (frequency) of peptides during amplification rounds can be misleading, as these peptides might also have a high frequency in the naïve library. Peptide sequences with EFs > 1 have been enriched during amplification, whereas peptide sequences with EFs = 1 have not been enriched during amplification and peptide sequences with EFs < 1 have been de-enriched during amplification. Hence, in the quest of identifying Pr-TUPs, which are peptides displayed on clones with increased propagation capacity, a criterion of EF > 1 should be fulfilled. To evaluate the distribution of EFs in each amplified pool, plots were made showing EFs and the number of peptides having each EF (Fig. 5). Generally, we observe an increase in the EF values for both lots during rounds of amplification. For instance, the highest EFs in rounds 1 and 3 are 142.86 and 18,861.05 for SA1, whereas the highest EFs in rounds 1 and 3 are 101.77 and 126,105.90 for SA2. This enhancement in the EF values is accompanied by a decrease in the number of peptides with lower EFs and an increase in the number of peptides with higher EFs. The phage pool consists of a subgroup of peptide sequences with very high EF values in round 2 and more pronounced in round 3 for both lots. These can be considered as potential Pr-TUPs. The list of the top 1000 peptide sequences from round 3 of amplification of both lots is available in Supplementary Table A4. For both lots, the number of peptides with EFs > 102 notably increased in round 3 (from 1 sequence in round 1 of both lots to 199 sequences in round 3 of SA1 and 62 sequences in round 3 of SA2). Also, it is evident that with increasing rounds of amplification, the distribution of EFs becomes more diverse. This is clear from the broadening of the EF values in rounds 2 and 3 compared to the more compact pattern in round 1. This increasingly diverse distribution of EF values highlights a more heterogeneous distribution of peptide frequencies, which is caused by the remarkable enrichment of fast-propagating phage clones in the later rounds of amplification. During rounds of amplification, the phage pool diversity collapses resulting in a lower number of distinct phage clones but with notably higher propagation rates compared to the other clones of the library.
When comparing the two lots, the distribution of EFs is substantially different. The most prominent difference is observed in round 3, which indicates with increasing rounds of amplification a higher divergence can be observed between the two lots. Consistent with the findings shown in Fig. 4, the most enriched sub-population in each of the two lots has no sequences in common (Supplementary Table A4).
Fig. 5
Distribution of enrichment factors (EFs) during the different rounds of amplification (Round 1, 2, and 3) for different lots of the peptide phage display library (SA1 and SA2). The horizontal axis represents the EF of peptides and the vertical axis represents the number of peptides having the given EF
Global and positional frequencies of amino acids indicate distinct compositional changes between lots and during amplificationThe amino acid composition of the most enriched fraction (top 1000 peptide sequences with the highest EF values) of phage pools was investigated by calculating the observed global and positional frequencies of amino acids. The expected amino acid frequencies were calculated based on the number of available codons (according to the NNK randomization strategy used for library construction) for each amino acid.
The global amino acid frequencies were determined for the naïve library and the amplification rounds of both lots. The observed global frequencies for each amino acid were calculated for every sample and compared to the expected frequencies (Fig. 6). It was found that the most common amino acid is serine, and the least common amino acid is cysteine in both lots. Substantial differences can be observed when comparing the expected frequencies for arginine, asparagine, aspartic acid, cysteine, glutamine, histidine, lysine, proline, serine, threonine, and tyrosine to the observed frequencies in naïve library and rounds of amplification. Once comparing the amino acid frequencies in amplification rounds to the naïve library, some similarities can be observed between lots, such as overrepresentation of arginine, asparagine, and lysine as well as underrepresentation of cysteine and glutamic acid. However, the two lots also indicate some discrepancies in the amino acid frequencies during amplification, such as overrepresentation of phenylalanine, as well as underrepresentation of aspartic acid, glutamine, proline, and tryptophan in SA1, but overrepresentation of tryptophan and tyrosine as well as underrepresentation of alanine and serine in SA2.
Fig. 6
Global frequency for the top 1000 peptide sequences ranked according to EF for both SA1 (upper graph) and SA2 (lower graph). The global frequencies are shown for the expected (theoretical) frequencies of amino acids as well as for the observed frequencies of amino acids in the naïve library and the three rounds of amplification (Round 1, Round 2, and Round 3)
Subsequently, the positional frequencies of amino acids (on each of the 12 positions throughout the displayed peptide sequence) were investigated for the naïve library and rounds of amplification (Fig. 7). For the naïve libraries from both lots, we observe a non-random pattern of amino acids, before being subjected to any selective pressure for amplification. We observe an overall underrepresentation of arginine, cysteine, and glutamine, and an overall overrepresentation of alanine, asparagine, aspartic acid, histidine, proline (except position one), serine, and threonine in the naïve libraries of both lots. However, there are some dissimilarities between the naïve libraries from the two lots, e.g., alanine and histidine show a higher representation in SA2 compared to SA1, whereas isoleucine, phenylalnine and tyrosine show a lower representation in SA2 compared to SA1. This discrepancy in the naïve library will lead to differences in the amino acid composition in the amplified pools of the two lots. During rounds of amplification, several amino acids converge to a similar pattern in both lots, for instance, the presence of arginine increases in the last positions compared to the beginning of the peptide, where it is most underrepresented. Furthermore, leucine at position one becomes more underrepresented, whereas glycine and serine at position one become more overrepresented with rounds of amplification.
Furthermore, comparison of the plots of amplified libraries from the two lots indicates lot-specific patterns of amino acid representation at many positions; e.g. position 5 of alanine, position 4 of asparagine, position 10 of aspartic acid, position 12 of glutamic acid, position 2 of glycine, position 6 of leucine, position 1 of phenylalanine, position 5 of proline, position 10 of tryptophan, position 5 of tyrosine, etc. As a whole, our findings reveal major differences in the amino acid composition of the most enriched peptides of the two lots and highlight different sequence-dependent evolution of these lots during rounds of amplification.
Fig. 7
Positional frequency for the top 1000 sequences ranked according to EF for both SA1 (upper row) and SA2 (lower row). For each amino acid in the 12 different positions, the difference from the expected value was calculated and determined as a fraction. Red: overrepresented compared to the expected value, blue: underrepresented compared to the expected value
Motif analysis led to the identification of some motifs with probable association with a higher amplification rate of phage clonesMotif analysis was performed to discover motifs, in the primary and secondary structure of peptides, which might be associated with higher amplification rate of phage clones. Motif discovery in the primary structure of peptides was conducted through the STREME tool in the MEME database to identify ungapped tripeptide and hexapeptide motifs in the naive library and in the samples from amplification rounds. Only sequences with EF > 1 were included in the analysis to restrict motif identification to the most enriched sub-population of peptides in the pools. These highly enriched peptides are more likely to represent Pr-TUPs. The amino acid lengths were selected because a three-amino acid sequence is known as the minimal length for a functional motif [34] and a six-amino acid sequence is the average length of SLiMs [35], which are short linear functional motifs found in nature. A search for motifs in the naïve library was performed as a measure to identify background motifs (i.e., motifs with no association with amplification). The motifs identified by STREME are shown in Fig. 8 (hexapeptide motifs) and in Supplementary Fig. A1 (tripeptide motifs). To obtain a deeper understanding of the probable contribution of these motifs to increased amplification, the number of reads containing the identified motifs was determined and an enrichment score (ES) for each motif during amplification rounds was calculated. ES was calculated as the ratio between the number of reads containing the motif in the given round of amplification and the number of reads containing the motif in the naïve library (Table 1 and Supplementary Tables A5 and A6). A higher ES increases the probability of a motif being correlated with an increased amplification rate.
The results of the motif analysis indicate that except for a few identical motifs (like DLR, WPL, VPV, GLR), most of the motifs differ between the lots (Fig. 8 and Supplementary Fig. A1). There are many dipeptide motifs that are likely false-positive hits stochastically found in the peptide pools. Furthermore, many of the identified motifs are present in a low number of unique reads. This is obvious for hexapeptide motifs that are found in a lower number of unique reads compared to tripeptide motifs (Supplementary Tables A5 and A6). There are some tripeptide motifs that are found in a remarkably high number of unique sequences (like LPL, SLP, LPS, DLR, among others). However, they all possess low ES. The only exception is the motif MAY which has the highest ES among all tripeptide motifs.
Most of the hexapeptide motifs also possess low ES, but a few motifs including SVSRY, GRAMAY, RAMAYS, MAYSTI exhibit high ES (Table 1 and Supplementary Table A6). Interestingly, three of these sequences harbor the penta-amino acid motif RAMAY that is conserved in rounds 1 and 2, and the tetra-amino acid motif MAYS that is conserved in rounds 2 and 3 of SA1. The tri-amino acid motif MAY has been conserved through all rounds of amplification. The conservation of these amino acid sequences during rounds of amplification as well as their absence in the naïve library strengthens the hypothesis that these motifs might genuinely contribute to the increased amplification rates of the respective phage clones.
Fig. 8
The discovered hexapeptide motifs from the STREME analysis on the top 18,622 sequences (ranked based on EF) of the naïve library (NL), round 1 (R1), round 2 (R2), and round 3 (R3) of both SA experiments. The discovered tripeptide motifs can be seen in Supplementary Fig. A1
Table 1 Enrichment score (ES) of the discovered hexapeptide motifs from the STREME analysis during amplification roundsWe tried to add a new dimension to motif analysis through motif search in the amino acid sequences associated with the secondary structure of the peptides. This analysis was based on finding motifs previously known to be associated with \(\beta\)-turn formation [36, 37]. The presence of a \(\beta\)-turn in the displayed peptide, in particular at its N-terminus, has already been reported to result in an increased amplification rate of the respective phage clones [26, 38]. Similarly to the previous analyses, we determined the number of peptides containing each of the motifs associated with \(\beta\)-turn formation and calculated ES for each motif during amplification (Table 2 and Supplementary Table A7). We found that these motifs are present in a low number of reads and they all show low ES. Investigation of the location of these motifs in the peptides also indicated that a very low number of peptides contain these motifs at their N-termini. Overall, our observations highlight the lack of correlation between these \(\beta\)-turn-associated motifs and the increased amplification rate of phage clones.
Table 2 Enrichment score (ES) of the eight \(\beta\)-turn related tetrapeptide motifs during amplification rounds of both SA experiments
留言 (0)