Drugs
Poly (I:C) (Polyinosinic-polycytidylic acid sodium salt, lots #059M4167V and #0000110446) were purchased from Sigma-Merck.
Animals
C57BL/6 J mice were purchased from Charles River (Spain). All the experimental work carried out in this study followed the ethical guidelines from Directive 2020/569/EU of the European Parliament on the protection of animals used for scientific purposes. Animals were housed in a controlled-temperature/humidity environment (22 ± 1 °C, 60–70% relative humidity) in individual cages with a 12 h light/dark cycle and food and water available at libitum. According to the protocol established by the experimental animal unit of the IPBLN-CSIC, mice were allowed to acclimatize to housing room for a minimum of 5 days after their reception in the animal facility.
Maternal immune activation (MIA) experiments
After mouse mating, female pregnancies were determined by visualizing seminal plug (E0.5) and by body weight increase. Poly(I:C) treatment was administered intraperitoneally on day E9.5. Various doses of Poly(I:C) were tested, starting at 20 mg/kg and gradually decreasing to 5 mg/kg due to the elevated animal mortality observed at the highest doses. The experimental control group was treated in parallel by injecting mice with an equivalent volume of saline. Blood samples from treated animals were taken 2.5 h after treatment by mandibular sinus venipuncture in order to test later IL-6 levels in serum. Pregnant females were submitted to cesarean surgery on day E12.5 to facilitate fetal dissection, collecting the pooled fetal tissue as the initial biological material for obtaining neural stem cells (NSC). Three different NSC lines were obtained from each experimental condition, i.e., Poly (I:C) and Saline treatments, coming from independent pregnant mice. Blood samples from females were also taken by cardiac puncture to verify IL-6 levels in serum at this time point. The temperature, weight, and any signs of sickness in pregnant females were monitored throughout the entire process. Additionally, recommendations on experimental practices in MIA experiments, published elsewhere, were followed [11, 12]. IL-6 serum levels were measured using an ELISA kit (88–7064, Invitrogen). The assay was performed following the manufacturer´s instructions and guidelines. Briefly, Nunc MaxiSorpTM flat-bottom 96-well-plates (Thermo Scientific) were coated with anti-mouse IL-6 capture antibody overnight at 4 °C. Plates were washed with PBS + 0.05% Tween20 and incubated with ELISA/ELISPOT Diluent for 1 h to block non-specific binding sites. Plasma samples diluted in ELISA/ELISPOT Diluent were incubated overnight at 4 °C. A standard curve was generated using the IL-6 standard provided. After washing, plates were incubated with biotin-conjugated anti-mouse IL-6 antibody for 1 h, then washed and incubated with Avidin-HRP for 30 min. Plates were washed and finally incubated with Tetramethylbenzidine (TMB) Substrate Solution for 15 min. The reaction was stopped with 2 N H2SO4 and the signal was measured on a plate reader at 450 nm.
Cell culture
Adherent neural stem cell (NSC) lines from the mouse forebrain were obtained following the methodology previously described [13]. Briefly, the fetus dorsal forebrain at E12.5 was dissected, and the obtained tissue was disaggregated in order to get a cell suspension. These cells were then transferred to cell-culture plastic plates that had been previously treated with poly-L-lysine 10 μg/mL (Sigma-Merck) to enhance cellular adhesion and promote monolayer cultures. NSCs were maintained and expanded in NS expansion medium composed as follows: DMEM/Ham’s F-12 media with l-glutamine (Gibco), Glucose solution 29 mm (Signa-Merck), MEM nonessential amino acids 1x (Gibco), Penicillin/Streptomycin 1× (Gibco), HEPES buffer solution 4.5 mm (Cytiva), BSA solution 0.012% (Gibco), 2-mercaptoethanol 0.05 mm (Gibco), N2 supplement 1× (Gibco), B27 supplement 1× (Gibco), murine epidermal growth factor (EGF) 10 ng/mL (PeproTech) and human fibroblast growth factor (FGF-2) 10 ng/mL (PeproTech). To induce differentiation of NSCs into various neural cell lineages, the expansion medium was replaced with the following differentiation medium: Neurobasal plus DMEM/Ham’s F-12 media with l-glutamine (1:1) (Gibco), N2 supplement 1× (Gibco), B27 supplement 1× (Gibco), Glutamax 1× (Gibco) and 2-mercaptoethanol 0.05 mm (Gibco). Cells were grown and maintained at 37 °C-5% CO2 under a humidified atmosphere.
Immunocytochemistry
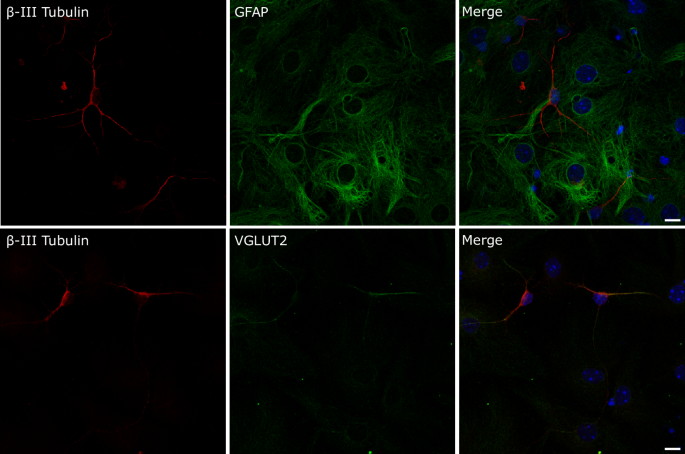
Cells were seeded on glass-coverslips pretreated with poly-L-lysine 50 μg/mL plus laminin 3.3 μg/mL (Sigma-Merck) and fixed with 4% paraformaldehyde before immunolabeling. Primary antibodies used were anti-Nestin (1:100) (Abcam, ab254048), anti-Sox2 (1:100) (Abcam, ab97959), anti-MAP2 (1:200) (SIGMA, M3696), anti-β-III tubulin (1:100) (R&D Systems, MAB1195-SP), anti-GFAP (1:100) (Cell Signaling, #3670) and anti-VGLUT2 (1:200) (Abcam, ab79157). Secondary antibodies were anti-mouse IgGAlexaFluor 488 (1:1000) (Abcam, ab150105) and anti-rabbit IgGAlexaFluor 594 (1:1000) (Abcam, ab150076). Fluorescent cell nuclei staining was performed with Hoechst 33342 (Invitrogen) according to the manufacturer instructions. Fluorescent images of cells were acquired using an Olympus I × 81 epifluorescence inverted microscope or a Leica TCS SP5 confocal microscope. Image processing was conducted with Image J software.
Dendritogenesis and neuritogenesis analysis
NSCs were seeded into 6-well plates pre-treated with poly-L-lysine 10 μg/mL plus laminin 3.3 μg/mL. After 7 days of differentiation, the complexity of dendritic arborization was assessed in images acquired through phase-contrast microscopy using a 40× objective, considering a population of 10–15 neurons. The Sholl analysis tool, included in ImageJ software, was utilized to estimate dendritic complexity. This analysis involves establishing concentric circles from the center of the neuronal body and counting the number of intersections these circles make with the various dendritic processes emerging from the neuron soma. The resulting data can be graphed, depicting the number of intersections in relation to the distance from the center of the neuron. The maximum number of intersections per neuron obtained from this graph was considered to compare and average the results from different experiments. Neuritogenesis were evaluated quantifying the emerging filopodia/neurite density in images acquired through phase-contrast microscopy using a 63× objective and Leica DMi8 microscope. The number of dendritic filopodia/neurites were quantified in 20 μm segments of dendrites using ImageJ software.
Synaptogenesis
The quantitative evaluation of established synapses among in vitro cultured neurons was conducted using a rabies virus monosynaptic tracing methodology, which involved the utilization of genetically modified rabies viruses pseudotyped to infect a specific set of neurons expressing the appropriate virus receptor [14]. The engineered version of the rabies virus harbors in its genome a gene encoding a fluorescent protein, which replaces the original gene corresponding to the capsid glycoprotein. This modification enables rabies virus particles to be transmitted to presynaptic neurons through neurite terminals in a retrograde manner. The absence of the native capsid glycoprotein gene prevents the further transmission of the virus to subsequent neurons, limiting the infection to a unique presynaptic level. The generation of genetically engineered rabies virus was performed following the protocol previously described [15]. Plasmids pSADdeltaG-F3 (32634), pcDNA-SADB19N (32630), pcDNA-SADB19P (32631), pcDNA-SADB19L (32632), pcDNA-SADB19G (32633) and pBOB-synP-HTB (30195) were acquired from Addgene. The original pSADdeltaG-F3 plasmid was modified by subcloning the encoding sequence of mCherry protein between NheI and SacII restriction sites. HEK 293T-TVA 800, B7GG and BHK-EnvA cell lines were generously provided by Edward Callaway from The Salk Institute for Biological Studies (California, USA). Recombinant lentivirus production was conducted according to standard protocols from Addgene using pBOB-synP-HTB in combination with psPAX2 and pCAG-VSVG as packaging and enveloping helper plasmids respectively. To visualize monosynaptic tracing with rabies virus in cultured neurons, NSCs were seeded in 6-well tissue culture plates pre-treated with poly-L-lysine (10 µg/mL) plus laminin (3.3 µg/mL) at a density of 200,000 cells per well. Once the differentiation process began (day 0), on day 3 cells were infected with the lentivirus to induce neurons to express the TVA receptor along with GFP and rabies capsid glycoprotein. Subsequently, on day 5, cells were infected with the recombinant rabies virus, and finally, on day 7, image acquisition from living cells was performed using a Leica DMI8 epifluorescence microscope with a 10x objective after staining cell nuclei with Hoechst 33342. Cells were illuminated to visualize fluorescent signals corresponding to GFP, mCherry, and Hoechst 33342 emission wavelengths, namely green, red, and blue, respectively. Thus, the blue channel showed the total population of cells within the microscopy field, whereas the green channel corresponded to those cells expressing the TVA receptor and therefore susceptible to infection by the recombinant rabies virus. Finally, the red channel showed those cells infected by the rabies virus. Within this population of cells expressing the mCherry protein, there were cells displaying both GFP and mCherry fluorescent signals, as well as cells emitting only the mCherry signal. These latter cells represent neurons infected by the rabies virus through monosynaptic connections (Supplementary Fig. 4 showing the 3 microscopy fields and pointing out neurons not co-expressing green and red signals). Image analysis to quantify the different cell populations was performed using FIJI software, employing a macro specifically created for this purpose. This macro consisted of Gaussian blur sigma filtering applied prior to image segmentation, which was based on autothresholding of cell nuclei stained with Hoechst 33324 reagent. Several morphological parameters could be adjusted to optimize the segmentation process, such as minimum and maximum cell size, minimum circularity, and thresholds of GFP and mCherry minimum and maximum fluorescence signals. To evaluate the extent of synapses formed among neurons present in the analyzed microscopy field, we considered the ratio between the total number of cells displaying only the mCherry signal and the total number of cells displaying both GFP and mCherry signals simultaneously.
Immunoblotting
Samples were heated at 65 °C for 15 min and subjected to SDS-polyacrylamide gel electrophoresis analysis using 4–12% bis-Tris gels (NuPAGE, Invitrogen) and MOPS buffer. After electrophoresis, proteins were transferred onto nitrocellulose membranes that were incubated in a solution of 5% non-fat milk and 0.1% Tween-20 in Tris-buffered saline at room temperature on a rotating shaker for 2 h to block nonspecific binding sites. Afterwards, membranes were incubated overnight with a rabbit anti-MAP2 polyclonal antibody (1:1000) (SIGMA M3696). Protein antibody interactions were detected using horseradish peroxidise-linked anti-rabbit IgG (1:10,000) (Abcam ab6721). Immunoblots were developed by application of enhanced chemiluminescence solution (ECL, Cytiva). Immunoblots were stripped subsequently and re-blotted with anti-actin antibody (1:5000) (Hypermol, clone262) to assess the amount of loaded protein.
Sample preparation for proteomics and phosphoproteomics analysis
Mass spectrometry experiments were performed as described previously [16] with some modifications. Cultured cells on 100 mm dishes were washed with ice-cold PBS supplemented with phosphatase inhibitors (1 mm Na3VO4 and 1 mm NaF). Cells were scrapped and lysed with a Urea buffer (8 M urea in 20 mm in HEPES, pH 8.0 supplemented with 1 mm Na3VO4, 1 mm NaF, 1 mm Na2H2P2O7 and 1 mm sodium β-glycerophosphate) and lysates were then sonicated using a sonicator Vibra-Cells (Sonics Materials) at 20% of intensity, 3 cycles of 10 s. Samples were then centrifuged at 13,000 rpm for 10 min at 5 °C. Supernatant was transferred in 1.5 mL Protein Lo-bind tube (Eppendorf). Protein concentration was determined using BCA Protein Assay Kit. For phosphoproteomics analysis, 110 µg of extracted proteins in a volume of 200 ul were reduced with dithiothreitol (DTT, 10 mm) for 1 h at 25 °C, and alkylated with Iodoacetamide (IAM, 16.6 mm) for 30 min at 25 °C. Trypsin beads were equilibrated by three washes with 20 mm HEPES; pH 8.0. Then, samples were diluted with 20 mm HEPES (pH 8.0) to a final concentration of 2 M urea and digested with equilibrated trypsin beads (50% slurry of TLCK-trypsin) overnight at 37 °C. After that, trypsin beads were removed by centrifugation (2000 × g for 5 min at 5 °C) and samples were transferred to 96 well plates and acidified by adding TFA to a final concentration of 0.1%. Peptide solutions were desalted and subjected to phosphoenrichment using the AssayMAP Bravo (Agilent Technologies) platform. For desalting, protocol peptide clean-up v3.0 was used. Reverse phase S cartridges (Agilent, 5 μL bed volume) were primed with 250 μL 99.9% acetonitrile (ACN) with 0.1%TFA and equilibrated with 250 μL of 0.1% TFA at a flow rate of 10 μL/min. The samples were loaded (770 μL) at 20 μL/min, followed by an internal cartridge wash with 250 μL of 0.1% TFA at a flow rate of 10 μL/min. Peptides were then eluted with 105 μL of 1 M glycolic acid with 50% ACN, 5% TFA and this is the same buffer for subsequent phosphopeptide enrichment. Following the Phospho Enrichment v 2.1 protocol, phosphopeptides were enriched using 5 µL Assay MAP TiO2 cartridges on the Assay MAP Bravo platform. The cartridges were primed with 100 µL of 5% ammonia solution with 15% ACN at a flow rate of 300 μL/min and equilibrated with 50 μL loading buffer (1 M glycolic acid with 80% ACN, 5% TFA) at 10 μL/min. Samples eluted from the desalting were loaded onto the cartridge at 3 μL/min. The cartridges were washed with 50 μL loading buffer and the phosphorylated peptides were eluted with 25 μL 5% ammonia solution with 15% ACN directly into 25 μL 10% formic acid. Phosphopeptides were lyophilized in a vacuum concentrator and stored at −80 °C. For proteomics analysis, 30 μg of protein were digested and acidified as described above. Peptide solutions were desalted using the AssayMAP Bravo (Agilent Technologies) platform. Cartridges were primed, equilibrated, loaded and washed as described above and peptides were eluted with 105 μL of 70/30 ACN/ H2O + 0.1% TFA. Eluted peptide solutions were dried in a SpeedVac vacuum concentrator and peptide pellets were stored at −80 °C.
LC-MS/MS analysis
Peptides were re-suspended in 20 µL of reconstitution (97% H2O, 3% ACN, 0.1% TFA, 50 fmol/µL-1 enolase peptide digest) and sonicated for 5 min at RT. Following a brief centrifugation, 2 μL was loaded onto a LC-MS/MS system. This consisted of a nano flow ultra-high pressure liquid chromatography system UltiMate 3000 RSLC nano (Dionex) coupled to a Q Exactive Plus using an EASY-Spray system. The LC system used mobile phases A (3% ACN: 0.1% FA) and B (100% ACN; 0.1% FA). Peptides were loaded onto a μ-pre-column and separated in an analytical column. The gradient: 1% B for 5 min, 1% B to 35% B over 90 min, following elution the column was washed with 85% B for 7 min, and equilibrated with 3% B for 7 min, flow rate of 0.25 µL/min. Peptides were nebulized into the online connected Q-Exactive Plus system operating with a 2.1 s duty cycle. Acquisition of full scan survey spectra (m/z 375–1500) with a 70,000 FWHM resolution was followed by data-dependent acquisition in which the 15 most intense ions were selected for HCD (higher energy collisional dissociation) and MS/MS scanning (200–2000 m/z) with a resolution of 17,500 FWHM. A 30 s dynamic exclusion period was enabled with an exclusion list with 10ppm mass window. Overall duty cycle generated chromatographic peaks of approximately 30 s at the base, which allowed the construction of extracted ion chromatograms (XICs) with at least ten data points.
Peptide and protein identification and quantification
Peptide identification from MS data was automated using a Mascot Daemon (v2.8.0.1) workflow in which Mascot Distiller generated peak list files (MGF) from RAW data, and the Mascot search engine matched the MS/MS data stored in the MGF files to peptides using the SwissProt Database restricted to Mus musculus (SwissProt_2021_02.fasta, 17080 sequences). Searches had an FDR of ~1% and allowed 2 trypsin missed cleavages, mass tolerance of ±10 ppm for the MS scans and ±25 mmu for the MS/MS scans, carbamidomethyl Cys as a fixed modification and oxidation of Met, PyroGlu on N-terminal Gln and phosphorylation on Ser, Thr, and Tyr as variable modifications (phosphorylation was only considered for searches performed in phosphoproteomics data). Pescal was used for label free quantification of the identified peptides [17]. The software constructed XICs for all the peptides identified in at least one of the LC-MS/MS runs across all samples. XIC mass and retention time windows were ±7 ppm and ±2 min, respectively. Quantification of peptides was achieved by measuring the area under the peak of the XICs. Individual peptide intensity values in each sample were normalized to the sum of the intensity values of all the peptides quantified in that sample. Phosphoproteomics and proteomics data was processed and analysed using a bioinformatic pipeline developed in a R environment (https://github.com/CutillasLab/protools2/). The normalised data was centered, log2 scaled and 0 values were inputted using the minimum feature value in the sample minus one. Then, p-values to assess statistical differences between comparisons were calculated using LIMMA [18], and then adjusted for FDR using the Benjamini-Hochberg procedure. Differences were considered statistically significant when p-values < 0.05 and FDR < 0.25.
Sequencing and data processing of transcriptomic data
NSCs were plated in 100 mm culture dishes and washed with ice-cold PBS. Cellular pellets from either non-differentiated NSCs or cells differentiated for 7 days were collected and processed for transcriptomics approaches. Both, library preparation and Illumina sequencing were carried out at the IPBLN Genomics Facility (CSIC, Granada, Spain). Total RNA integrity was verified by Bioanalyzer RNA 6000 Nano chip electrophoresis (Agilent Technologies). Every RNA sample showed a RIN value above 8.5. RNA-seq libraries were prepared using Illumina stranded mRNA Prep Ligation kit (Illumina®) from 200 ng of input total RNA. Quality and size distribution of PCR-enriched libraries were validated through Bioanalyzer High Sensitivity DNA assay and concentration was measured on the Qubit® fluorometer (Thermo). Final libraries were pooled, in an equimolecular manner, and then diluted and denatured as recommended by Illumina NextSeq® 500 library preparation guide. The 72 × 2 nt paired-end sequencing was conducted on a NextSeq® 500 sequencer with a final output of 48 Gbp and a quality score (Q30) of 88.5%. miARma-Seq pipeline was used to analyse transcriptomic samples [19, 20]. Firstly, raw data were evaluated using FastQC software to analyze the quality of the reads (http://www.bioinformatics.babraham.ac.uk/projects/fastqc). Subsequently, after sample filtering, we obtained a mean of 49% in GC content and an average of 23,636,605 reads per sample. No adapter accumulation and bad quality reads (q < 30) were found. Afterwards, the number of reads per sample were homogenized using Seqtk software (https://github.com/lh3/seqtk). In the second step, miARma-Seq aligns all sequences using STAR [21], resulting in a 93.28% of properly aligned reads. With this aim, we use the Mus musculus Gencode version M31 genome-build: mmGRCm39 was used. After that, featureCounts software [22] was used to assign sequence reads to genes by using reference gene annotation that was obtained from Gencode from the same assembly and genome build. Expression analysis was carried out by edgeR package [23]. Low expressed genes were removed, and remaining genes were normalized by the trimmed mean of M-values (TMM) method [24]. The normalized gene expression (TMM) was log2 scaled and then, statistical differences between comparisons were calculated using LIMMA, and then adjusted for FDR using the Benjamini-Hochberg procedure. Differences were considered statistically significant when p-values <0.05 and FDR < 0.25.
Statistics
Statistical analysis was carried out in Excel or in R (v4.3.1) using base functions or the ggpubr package (https://CRAN.R-project.org/package=ggpubr). When not specified, statistical differences were evaluated using unpaired T-Student test. Gene Ontology analysis of genes/proteins differentially expressed or phosphorylated was performed using the clusterProfiler package (https://bioconductor.org/packages/release/bioc/html/clusterProfiler.html). Data was visualized using the ggplot2 package (https://cran.r-project.org/web/packages/ggplot2/index.html).

留言 (0)