
記住我


Zebrafish were kept according to the national regulations and recommendations by Westerfield [24] in our fish facility in Erlangen, Germany. Zfl of wild-type AB strains were obtained by natural spawning at 28 °C and raised in standard E3 solution at 28 °C. All national and institutional guidelines for experimenting on laboratory animals were strictly followed.
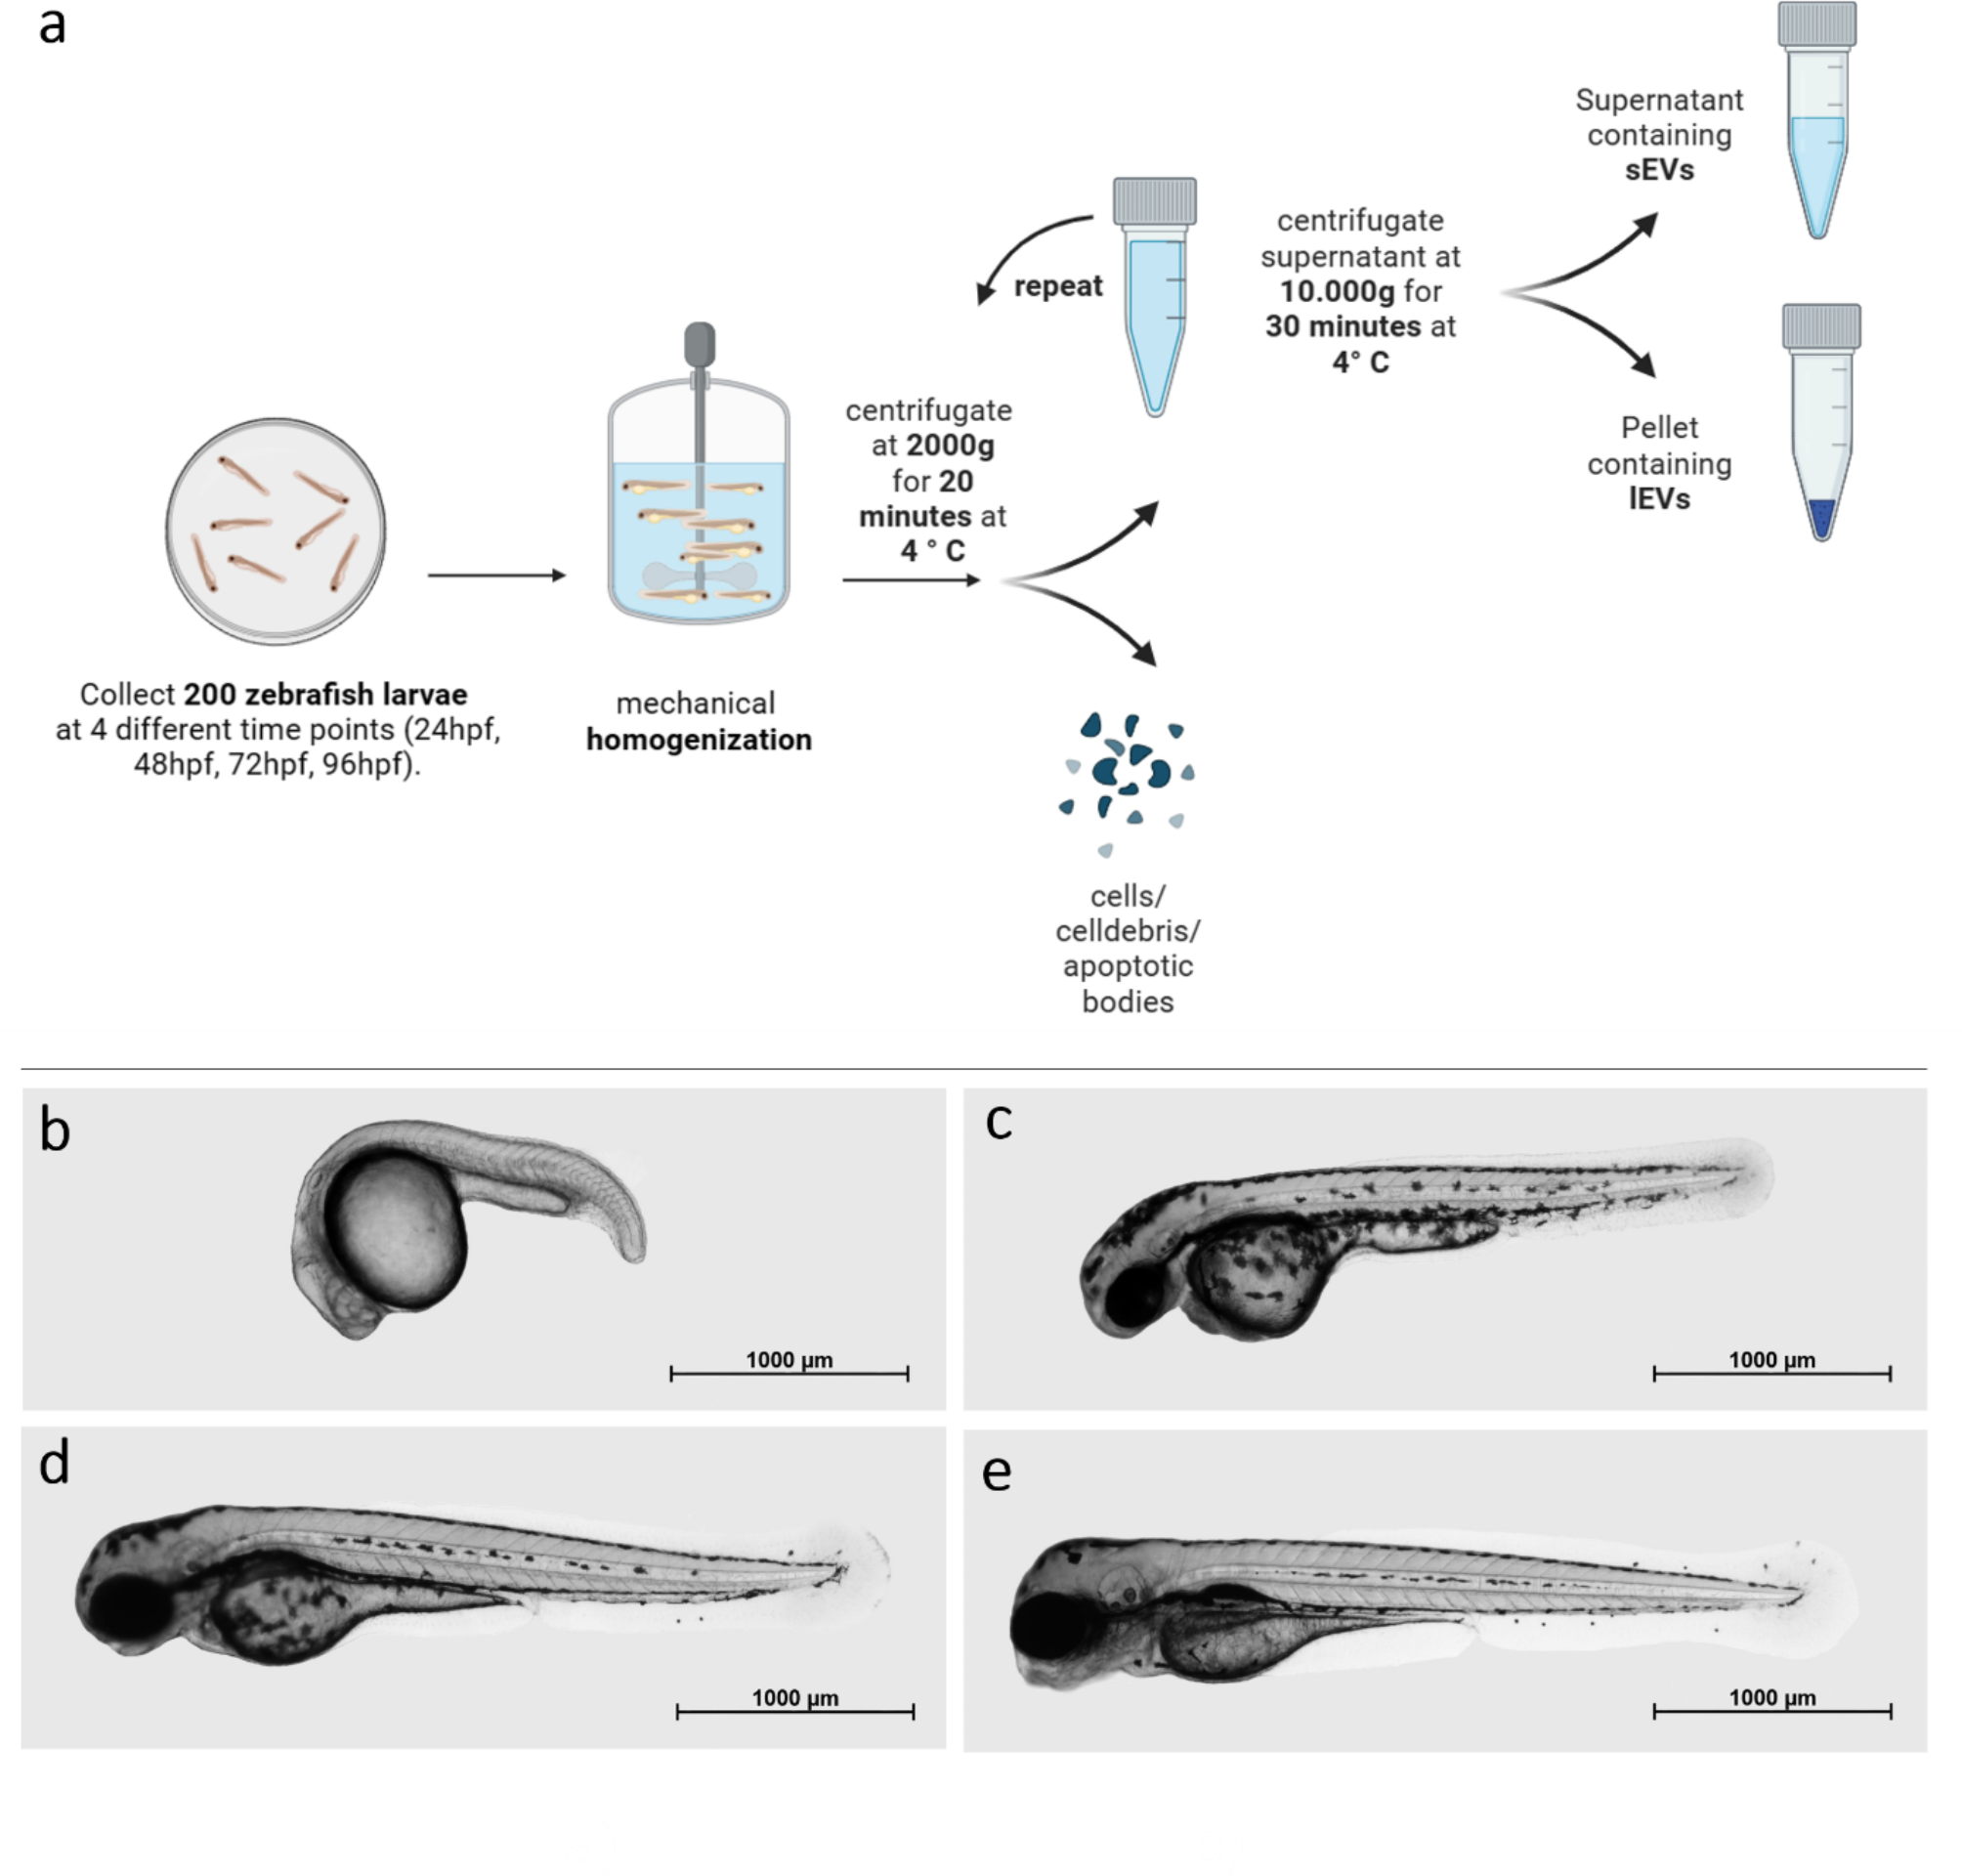
Isolation and EV storageWild-type zebrafish embryos were cultured in E3 Medium at 28° C and collected at 24, 48, 72, and 96 hpf. Thereafter, 200 zfl per sampling time point were washed with E3 Medium and homogenized using a manual mechanical homogenizer (Squisher-Single, Zymo Research, Freiburg, Germany). For each time point, four independent samples were collected (200 zfl per sample). EV enrichment protocol was performed in reference to Thery et al. [25] by applying differential centrifugation. Cells, cell debris, and apoptotic bodies were depleted from the homogenized zebrafish lysate in two centrifugation steps, each at 2.000 ×g for 20 min at 4° C. The supernatant was then diluted with Ringer’s Solution (B. Braun, Melsungen, Germany) in a ratio of 1:100 and centrifuged at 10.000 ×g for another 30 min at 4° C. Next, this homogenized zfl supernatant (contains sEVs) and the homogenized zfl pellet (contains lEVs) were stored at -80° C in polypropylene tubes in a vertical position until further use as recommended [26]. The isolation protocol is demonstrated in Fig. 1a. The additional, in the original published article not used Ringer`s Solution was examined as a negative control in the TEM, NTA and flow cytometry analyses. No particles/ artefacts were found here. We were therefore able to use it without hesitation for dilution in the further isolation steps. Wild-type zfl medium was collected at 24 hpf, 48 hpf, 72 hpf, and 96 hpf and went through two centrifugation steps, each 2.000 ×g for 20 min at 4 °C to deplete cells, cell debris, and apoptotic bodies. The supernatant was vortexed and stored in a vertical position at -80 °C in polypropylene tubes until further use [26]. During all steps, an anti-static wrist strap was used as it is known that EVs have electrostatic properties [27].
Fig. 1
Protocol of EV isolation and zebrafish larvae development: a: Isolation protocol for whole zfl sEVs and lEVs by differential centrifugation. b-e: Zfl development; Imaging was performed at the 4 observation time points in 2% low-melting agarose (peqLab, Erlangen, Germany) using an Axio Observer microscope system (Zeiss, Jena, Germany), magnification 2,5x. b: 24 hpf, c: 48 hpf, d: 72 hpf, e: 96 hpf
Flow cytometryThe homogenized zfl pellets from 24 hpf, 48 hpf, 72 hpf, and 96 hpf (n = 4 for each observation point) were analysed using flow cytometry. The homogenized zfl pellets were thawed in a water bath at 36° C for three minutes. After careful resuspension of the pellet in 1.000 µl Ringer’s Solution (B. Braun, Melsungen, Germany), AxV-FITC (FITC - conjugated recombinant Annexin V, Immunotools, Friesoythe, Germany) and FM4-64 (TermoFischer scientific, Waltham, MA, USA) were added immediately and incubated at room temperature for 30 min. Antibody concentration was determined in trials with 72 hpf homogenized zfl pellets. As recommended, unlabeled samples served to determine the background fluorescence [28]. Swarming effect was excluded through a dilution trial [29]. Dyes were centrifuged at 16.000 ×g for 15 min immediately before use to avoid agglutination and therefore, false positive events during flow cytometry.
The same protocol was also used for staining and flow cytometric analysis of EVs in wild-type zebrafish larvae medium collected at 72 hpf.
lEVs were gated by size using a forward scatter below the size of 1 micrometer polystyrene beads (Sigma-Aldrich, Steinheim, Germany) under the exclusion of background signals. Further, a polygonal gate was used to exclude events with a higher sideward scatter, which might be aggregated lEVs (Fig. 2a). Fluorescent positive events were defined by their differentiation from antigen-negative events in stained samples and gated accordingly (Fig. 2a-b). Samples incubated with AxV-FITC and EDTA as a calcium chelator served as an additional negative control for the calcium-dependent AxV-FITC. Additionally, samples containing only Ringer’s Solution (B. Braun, Melsungen, Germany) and AxV-FITC and/or FM 4–64 served as negative controls. Samples were measured undiluted with a Gallios flow cytometer (Beckman Coulter, Brea, CA, USA). Excitation for fluorescence was at 488 nm and emitted fluorescence was recorded on the FL1 sensor (525/38nm BP Filter) as the AUC of FL1 and on the FL4 sensor (695/30nm BP Filter) as the AUC of FL4. Data analysis was performed with Kaluza software version 1.5 (Beckman Coulter, Brea, CA, USA).
Fig. 2
Characterization of whole zfl lEVs using flow cytometry: Gating strategy flow cytometry. a: First we determined the lEV gate by size using a forward scatter below the size of 1 micrometer polystyrene beads (Sigma-Aldrich, Steinheim, Germany) and excluding background signals as shown in the side scatter versus forward scatter plot. b: Further, a polygonal gate was used to exclude events with a higher side scatter, which might be aggregated lEVs. This can be seen in the scatter plots selected for the respective fluorescence: side scatter versus FL1 and side scatter versus FL4. AxV-FITC and/or FM4-64 were added to resuspended 10.000 g homogenized whole zfl pellets, incubated and measured directly and undiluted with flow cytometry. The expression of AxV-FITC and FM4-64 was analysed within these defined lEV gates. Gates defining the respective dye positive fraction were drawn in respect to an obviously negative fraction within the same measurement c: Double positive lEVs were gated in the same way and then analysed in 4 quadrants according to their positivity. FM4-64+/AxV-: lEVs negative for AxV-FITC but positive for FM4-64. FM4-64+/AxV+: lEVs showing positivity for both dyes FM4-64 and AxV-FITC. FM4-64-/AxV-: lEVs neither positive for AxV-FITC nor FM4-64. FM4-64-/AxV+: lEVs negative for FM4-64, but positive for AxV-FITC. d: Percentage of AxV + whole zfl lEVs at the 4 observation time points (24 hpf, 48 hpf, 72 hpf, 96 hpf), n = 4. e: Percentage of FM4-64 + whole zfl lEVs at the 4 observation time points (24 hpf, 48 hpf, 72 hpf, 96 hpf), n = 4. f: Percentage of FM4-64 + and AxV + whole zfl lEVs at the 4 observation time points (24 hpf, 48 hpf, 72 hpf, 96 hpf), n = 4. All results are presented as box plots with median, minimum, maximum, and interquartile ranges. * p < 0.05
Nanoparticle tracking analysis (NTA)The EVs in homogenized zfl pellets and supernatant collected at 24 hpf, 48 hpf, 72 hpf, and 96 hpf (n = 4 for each time point) underwent analysis using a nanoparticle tracking analysis (NTA) method. In this method, the nanoparticles scatter a laser beam, and a high-sensitivity camera tracks the particles’ Brownian motion by recording this scattered light. Then, by analysing the speed and the pattern of this motion, the hydrodynamic diameter of the particles is calculated using the Stokes-Einstein equation. The concentration is also calculated based on the number of detected particles in the NTA’s cell with known volume, the corresponding unit is particles/millilitre. Before the NTA measurements, the samples, previously stored at − 80 °C, were thawed and diluted in Ringer’s Solution (B. Braun, Melsungen, Germany). Particle yield and size distribution profiles were determined using a ZetaView® PMX-220 (Particle Metrix, Germany), following the manufacturer’s recommended settings for EV analysis. Briefly, measurements were conducted with a 488 nm laser, in scatter mode, at 25 °C, employing a camera sensitivity of 80%, a shutter duration of 100 ms, and a frame rate of 30. The results were analysed using the ZetaVIEW software.
Transmission electron microscopy (TEM)TEM was performed on lEV and sEV samples previously stored at -80 °C. Negative staining TEM was performed according to Arnold et al. [30]. In brief, three microliters of sample were added to freshly negative glow discharged carbon-coated EM grids (Electron Microscopy Sciences, Hatfield, United States). The excess liquid was removed immediately with filter paper. Afterwards, the EM grid was washed with 2% aqueous uranyl acetate solution twice (Merck Millipore, Billerica, MA, United States), blotted with a filter paper once more, and left to air dry. The micrographs were collected on a JEOL 1400 Plus TEM (JEOL Germany, Munich, Germany) operating at 120 kV with a nominal magnification of 30.000x.
Western Blotting (WB)For SDS-PAGE and WB analysis, sEV and lEV samples of the same hpf were loaded onto pre-cast Bis-Tris 4–12% gradient gel (Invitrogen, Bolt Mini-Protein-Gel, cat. no.: NW04125BOX). The loaded protein amount ranged from 2 to 4.5 µg, and was equal in case of sEVs and lEVs. As control 4.5 µg zebrafish protein isolated from 72 hpf larvae (see supplementary material) was loaded, as molecular weight marker pre-stained protein marker was used (PageRuler Plus Prestained protein ladder, cat. no.: 26619). The gel was set up in 1x MES buffer and run at constant 120 V. The proteins separated based on their molecular size were then transferred onto a PVDF membrane (Immobilion-FL, 0.45 μm pore size, Millipore, cat. no.: IPFL00010) with constant 30 V for 1 h 10 min. Following transfer, the membrane was fixed in 0.4% PFA by constant rotation for 20 min at room temperature. The fixation was followed by 3-times 5 min washing steps with MilliQ water, after which the membrane was stained with Ponceau S (Sigma, cat. no.: P7170-1 L). The membrane was de-stained with 1x transfer buffer containing 20% MeOH, and blocked in blocking buffer (Licor, cat. no. 927-60001) for 1 h at room temperature. For antibody incubation the primary antibody (rabbit Alix monoclonal antibody, clone E6P9B, Cell Signaling Technology, cat. no.: 92880 S, lot:1) was diluted 1:500 in antibody diluent (Licor, cat. no.: 927-65001) and incubated overnight at 4 °C. Following incubation, the membrane was washed with 1xTBS containing 0.1% Tween20 (TBS-T) (3-times 10 min each), and incubated with fluorescently labelled secondary antibody (IRDye 800CW donkey anti-rabbit, Licor cat. no.: 926-32213) diluted 1:10.000 in TBS-T containing 2% fishgelatine for 1 h at room temperature. After discarding the secondary antibody, the membrane was washed 3-times with TBS-T, and scanned with Odyssey M scanner.
ZFL microscopyZebrafish embryos were raised at 28 °C in a petri dish containing E3 Medium until they reached the indicated developmental stages at 24 hpf, 48 hpf, 72 hpf, or 96 hpf. Immobilisation was reached by E3 Medium containing168 mg/L Tricaine and imaging was performed in 2% low-melting agarose (peqLab, Erlangen, Germany) using an Axio Observer microscope system (Zeiss, Jena, Germany), magnification 2,5x (Fig. 1b-e).
Statistical analysisStatistical analysis was carried out with Prism 6.0 (GraphPad Software Inc., La Jolla, CA, USA). All data passed the Shapiro-Wilk-Lognormality test (alpha = 0.05). Then, different groups were compared through ANOVA followed by Dunnett`s multiple comparison test. No outliers were defined using the ROUT method (Q = 1%). Results are presented with boxplots showing medians, minimum, maximum, and interquartile ranges. Results were defined significant with a p-value below 0.05.
留言 (0)