Human sample collection
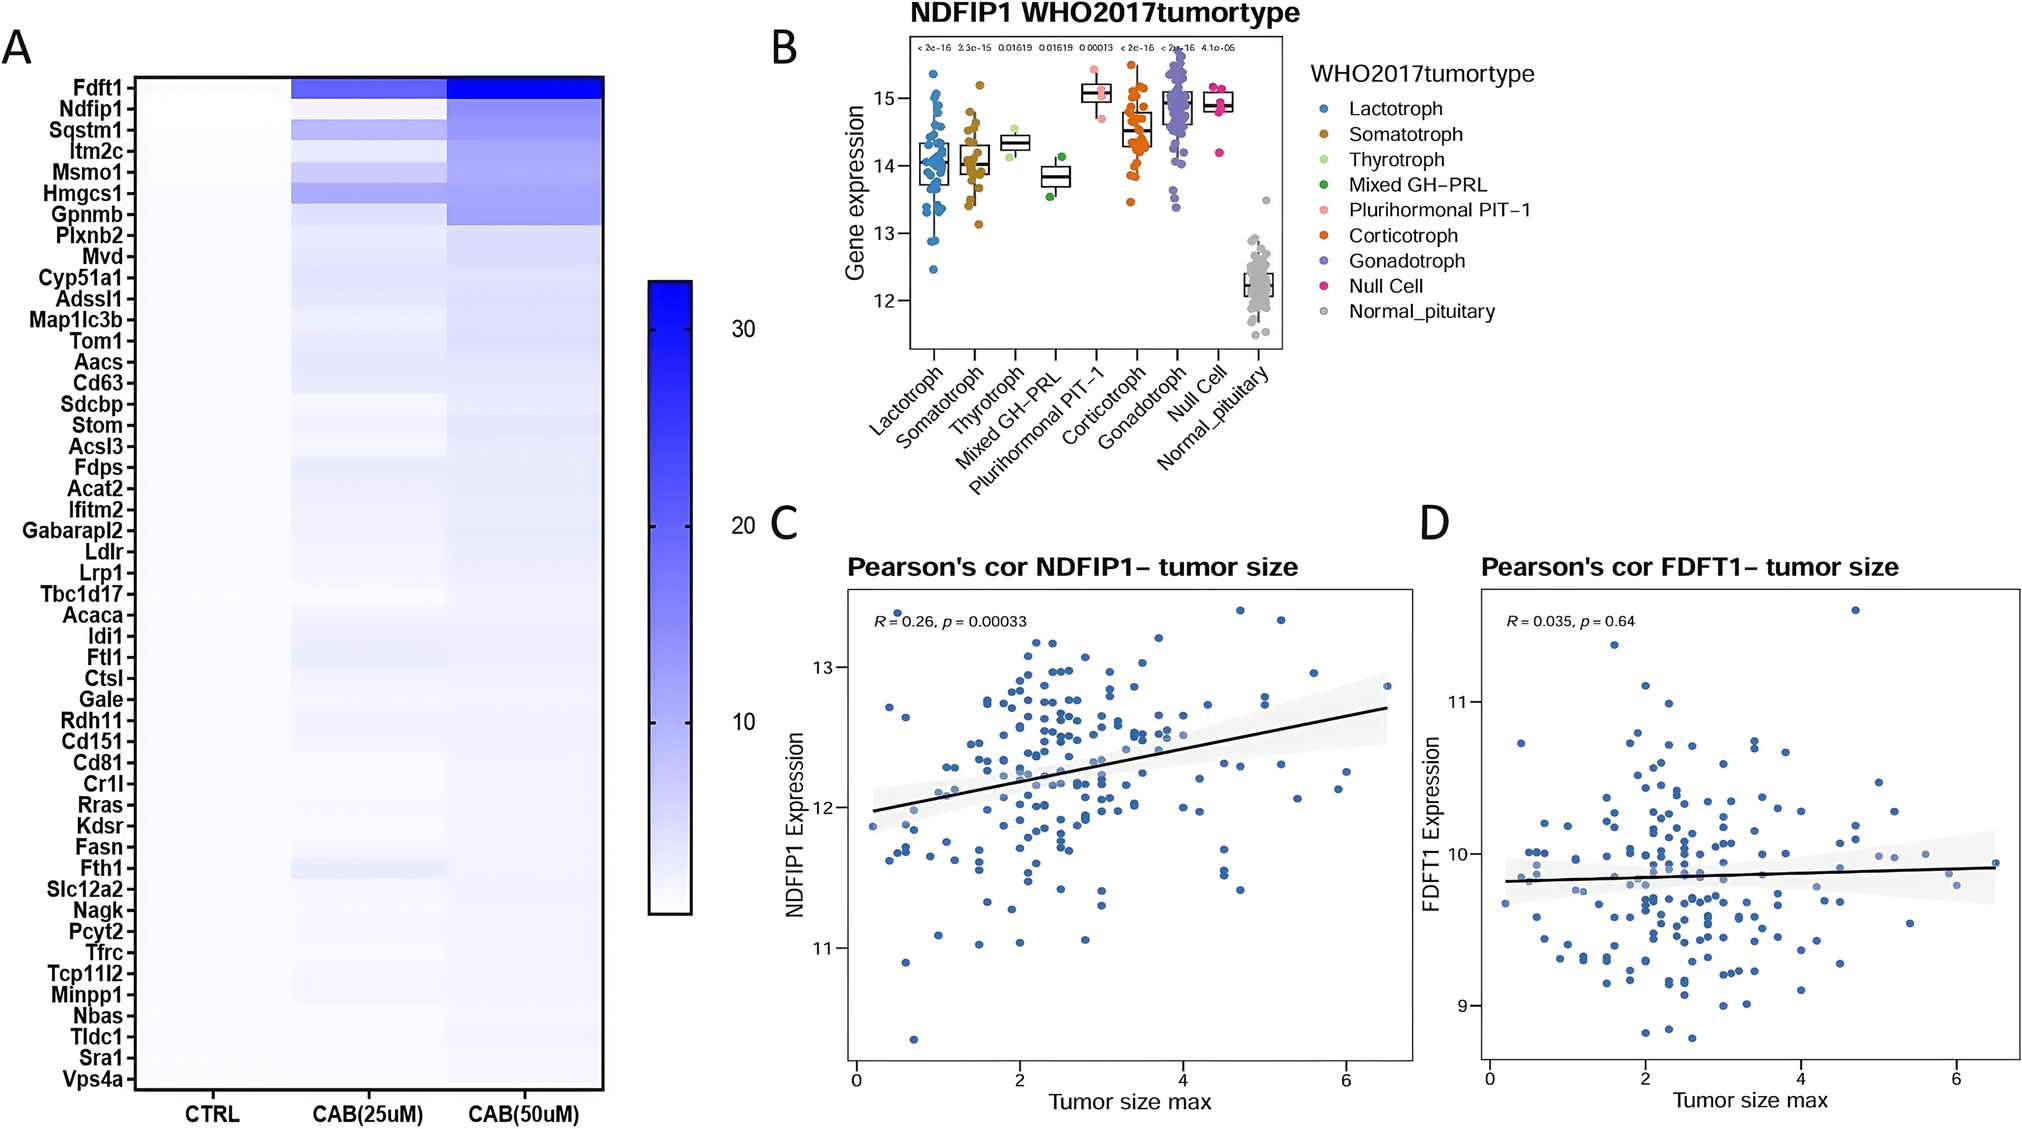
The study was conducted in accordance with ethical guidelines and received approval from the Ethical Review Board at Ruijin Hospital, Shanghai Jiao Tong University School of Medicine (Shanghai, China). Between 2016 and 2020, a total of 180 consecutive patients diagnosed with various subtypes of PitNET who were undergoing transsphenoidal surgery at Ruijin Hospital were enrolled in this study. We collected 180 tumor samples to conduct transcriptome analysis. This cohort included all the 2017 WHO-defined PitNET subtypes, comprising 65 (36%) gonadotroph, 40 (22%) lactotroph, 35 (19%) corticotroph (TPIT lineage), 26 (14%) somatotroph, 2 (1%) mixed growth hormone/prolactin (GH-PRL), 6 (3%) null cell, 2 (1%) thyrotroph, and 4 (2%) plurihormonal PIT-1 PitNET. The sample database used in this study has been reported in our previous research [14] and summarized in Table S1. Data on normal pituitary tissue samples were obtained from public database (https://ngdc.cncb.ac.cn/databasecommons/database/id/6329).
Xenograft mouse model
Four-week-old female athymic nude mice (BALB/c-nu) were purchased from Shanghai Slack Laboratory Animal Co., Ltd. (Shanghai, China) and were maintained under specific pathogen-free conditions. Subcutaneous injections of 1 × 10⁷ parental GH3 cells or NDFIP1-overexpressing GH3 cells were administered in a 100 μL volume at the flank region. Tumor dimensions were measured every 3 days post-injection using a caliper ruler. Tumor volumes were calculated using the formula: V (mm3) = (ab2)/2, where “a” represented the length, and “b” the width of the tumor [15]. When the largest tumor dimension reached approximately 2 cm, all mice were euthanized through cervical dislocation, and the tumors were photographed, weighed, and used for Western blot, immunohistochemistry and immunofluorescence analysis.
1 × 10⁷ GH3 cells were mixed with PBS and injected subcutaneously into the flanks of 10 mice. The animals were randomly assigned to 2 groups with 5 animals in each group: control group and CAB group. The animals were injected intraperitoneally with 100 mL vehicle control (0.1% dimethyl sulfoxide in 0.9% saline) or CAB (0.5 mg/kg, intragastric administration once every 2 days,) for 12 days. The tumors were used for immunofluorescence analysis.
The study was approved by the Ethical Review Board at Ruijin Hospital of Shanghai Jiao Tong University School of Medicine, with the ethics number: RJ2023009.
Cell culture
Rat PitNET cell lines MMQ (CRL-10609™) and GH3 (CCL-82.1™) were purchased from the American Type Culture Collection (Manassas, VA, USA). These cells were cultured in Dulbecco’s modified Eagle medium (Gibco, Grand Island, NY, USA) and F12 medium (Gibco), respectively, supplemented with 15% horse serum (Gibco) and 2.5% fetal bovine serum (Gibco). Both cell lines were maintained in a humidified atmosphere with 5% CO2 at 37 °C.
LC–MS/MS analysis
LC–MS/MS analysis was performed to identify differentially expressed proteins in MMQ cells in response to CAB treatment. Cells were treated with DMSO or CAB (25 μM and 50 μM) for 24 h. The cells were collected, lysed in SDS lysis buffer (4% SDS, 100 mM Tris–HCl, 100 mM dithiothreitol at pH 7.6), denatured at 95 °C for 10 min, and centrifuged at 12,000 g for 15 minuntes to obtain the supernatants. The protein concentration was determined using a tryptophan fluorescence emission assay and confirmed with Coomassie staining. Proteins were digested following the Filter Assisted Sample Preparation method. Briefly, 50 μg of proteins were loaded in 10 kDa centrifugal filter tubes, washed thrice with 200 μL urea buffer (8 M urea, 100 mM Tris–HCl, pH 8.5), alkylated with 50 mM iodoacetamide in urea buffer in the dark for 30 min, and then washed thrice with urea buffer, followed by three washes with 50 mM ammonium bicarbonate. Protein digestion was carried out overnight with trypsin at a ratio of 1:50 (protein: trypsin, w/w) at 37 °C. The concentration of digested peptides was measured using a BCA protein quantification kit (Beyotime, Shanghai, China). Peptides were desalted using C18 solid-phase extraction and resuspended in 0.1% formic acid for LC–MS/MS analysis.
The LC–MS/MS analysis was performed on an Orbitrap Q Exactive mass spectrometry platform (Thermo Fisher Scientific, USA) coupled to an online nano-flow EASY-nLC1000 HPLC system (Thermo Fisher Scientific). Peptides were loaded onto a self-packed column (75 μm × 150 mm; 3 μm ReproSil-Pur C18 beads, 120 Å, Dr. Maisch GmbH) and separated over a 180-min gradient at a flow rate of 300 nL/min. The mobile phases consisted of 0.1% formic acid in water (A) and 0.1% formic acid in acetonitrile (B). A data-dependent acquisition MS method was employed, beginning with an MS1 full scan (300 to 1600 m/z) at a resolution of 70,000 at 200 m/z, with an AGC target of 3e6 ions. Subsequently, 15 data-dependent MS/MS scans with higher-energy collisional dissociation were performed at a resolution of 17,500 at 200 m/z. The normalized collision energy was set at 27%, and the isolation window was 2.0 m/z. Raw MS spectra were analyzed using MaxQuant (version 1.6.5.0) against the UniProt Rat database (downloaded in September 2020). For both peptide and protein identification, the false discovery rate was set at 0.01. Carbamidomethyl cysteine was considered a fixed modification, while oxidized methionine and protein N-terminal acetylation were treated as variable modifications. Enzyme specificity was defined as trypsin/P. Label-free quantification intensity values were used for subsequent data analysis.
Lentiviral vector transfection
A lentiviral vector, pCDH-puro, was purchased from BioSune Biotechnologies (Shanghai, China). Recombinant plasmids (pCDH-puro-NDFIP1) were constructed and sequenced by Boshang Biotechnologies (Shanghai, China). After 48 h of transduction with lentiviral vectors, MMQ and GH3 cells stably expressing NDFIP1 or empty vectors were selected with 2 μg/mL puromycin for 1–2 weeks.
Immunohistochemistry (IHC)
IHC validation of NDFIP1 expression was conducted on 29 patients with PitNET, including various subtypes and a range of tumor sizes. The tumor subtypes were categorized according to The 2017 World Health Organization classification of tumors of the pituitary gland [16], consisting of gonadotroph (n = 10), lactotroph (n = 4), corticotroph (n = 1), somatotroph (n = 5), null (n = 6), mixed growth hormone/prolactin (GH-PRL; n = 1), and plurihormonal PIT-1 PitNET (n = 2). Tumor sizes were distributed as < 1 cm (n = 1), ≥ 1 cm and < 2 cm (n = 13), ≥ 2 cm and < 3 cm (n = 11), and ≥ 3 cm (n = 4). The clinical characteristics of these samples are summarized in Table S2. Tissue samples were fixed in 4% formalin and embedded in paraffin. Tissue slices were cut into a thickness of 4 μm. IHC was performed using the Vectastain ABC Kit (Vector Laboratories, Burlingame, CA, USA). Rabbit primary antibodies for NDFIP1 (15602-1-AP, dilution: 1:1000; Proteintech, Wuhan, China) were used. Slices were developed with DAB and counterstained with hematoxylin. Slices were scanned using the Pannoramic 1000 slide digitalization system (3DHISTECH, Budapest, Hungary). Images were captured at × 20 magnification using CaseViewer 2.3 (3DHISTECH). IHC scores were assessed by two pathologists in a blinded manner. The staining was scored as negative (0+), low positive (1+), positive (2+), and high positive (3+), as previously described [17].
Cell counting kit-8 (CCK-8) assay
Cell proliferation was measured using a CCK-8 kit (Bimake, Houston, TX, USA) following the manufacturer’s instructions. MMQ and GH3 cells were plated in 96-well plates at 1 × 10⁴ cells per well and treated with CAB ranging from 0 to 200 µM. The absorbance was measured at a wavelength of 450 nm using a microplate reader (Bio-Tek, USA).
Western blot analysis
Total proteins of tumor samples were extracted using the Total Protein Extraction Kit (Millipore Corporation, Billerica, MA, USA). Cultured cells were lysed with RIPA lysis Buffer (Beyotime). The proteins were separated in SDS-PAGE and transferred onto PVDF membranes (Millipore). The membranes were blocked with 5% skim milk in TBST buffer for 1 h and incubated overnight at 4 °C with primary antibodies against S6K1 (9202S, Cell Signaling Technology, 1:1000), p-S6K1 (Thr389,9205S, Cell Signaling Technology,1:1000), 4EBP1 (9644S, Cell Signaling Technology, 1:1000), p-4EBP1 (Thr37/46, 2855S, Cell Signaling Technology, 1:1000), Tubulin (ab7291, Abcam, 1:5000), mTOR (2983, Cell Signaling Technology, 1:1000), p-mTOR (5536, Cell Signaling Technology, 1:1000), AKT (4691, Cell Signaling Technology, 1:1000), p-AKT (4060, Cell Signaling Technology, 1:2000), PTEN (ab267787, Abcam, 1:1000), NDFIP1(15602-1-AP, Proteintech, 1:500), Peroxidase-conjugated AffiniPure Goat Anti-Mouse lgG (H+L) (115-035-003, Jackson ImmunoResearch), Peroxidase-conjugated AffiniPureGoat Anti-Rabbit lgG (H+L) (111-035-003, Jackson ImmunoResearch). Signals were detected using ECL detection reagent (Millipore) according to the manufacturer’s instructions.
Immunofluorescence
Tumor sections were deparaffinized and rehydrated, followed by antigen retrieval via high-pressure treatment in EDTA buffer to restore epitope accessibility. Subsequently, endogenous peroxidase activity was quenched using 3% hydrogen peroxide, and non-specific binding sites were blocked with 10% goat serum for 30 min at room temperature. The anti-PTEN antibody (ab267787, Abcam) and anti-NDFIP1 antibody (15602-1-AP, Proteintech) were applied and allowed to incubate overnight at 4 °C. After thorough washing, a secondary antibody (Goat Anti-Rabbit IgG HRP) was incubated, followed by labeling with CY5 for 10 min at room temperature and further washing steps. A second round of antigen retrieval was performed to enhance staining. Subsequently, donkey serum was used for blocking for 30 min at room temperature, and the sections were incubated with the secondary antibody (Alexa Fluor®488 donkey anti-rabbit IgG H+L) for 45 min at 37 °C and counterstained with DAPI to visualize cell nuclei. Finally, the sections were sealed with fluorescence mounting medium and analyzed under a fluorescence microscope.
Isolation and analysis of cytoplasm and nucleus proteins
Plasma membrane, cytoplasm, and nucleus proteins were isolated from GH3 and MMQ cells using the Minute™ Plasma Membrane Protein Isolation Kit (SM-005; Invent Biotechnologies). These proteins were separated by SDS-PAGE and immunoblotted using the specific antibodies.
Statistical analysis
Data were expressed as the mean ± standard deviation. All data were analyzed using GraphPad Prism (version 5; San Diego, CA, USA) and R (version 4.0.0) software. Differences among categorical variables were assessed using one-way ANOVA followed by the Student–Newman–Keuls (SNK) post-hoc test, independent-sample Student’s t-test, or two-sided Wilcoxon test, as appropriate. A P value less than 0.05 was considered statistically significant.


留言 (0)