
記住我


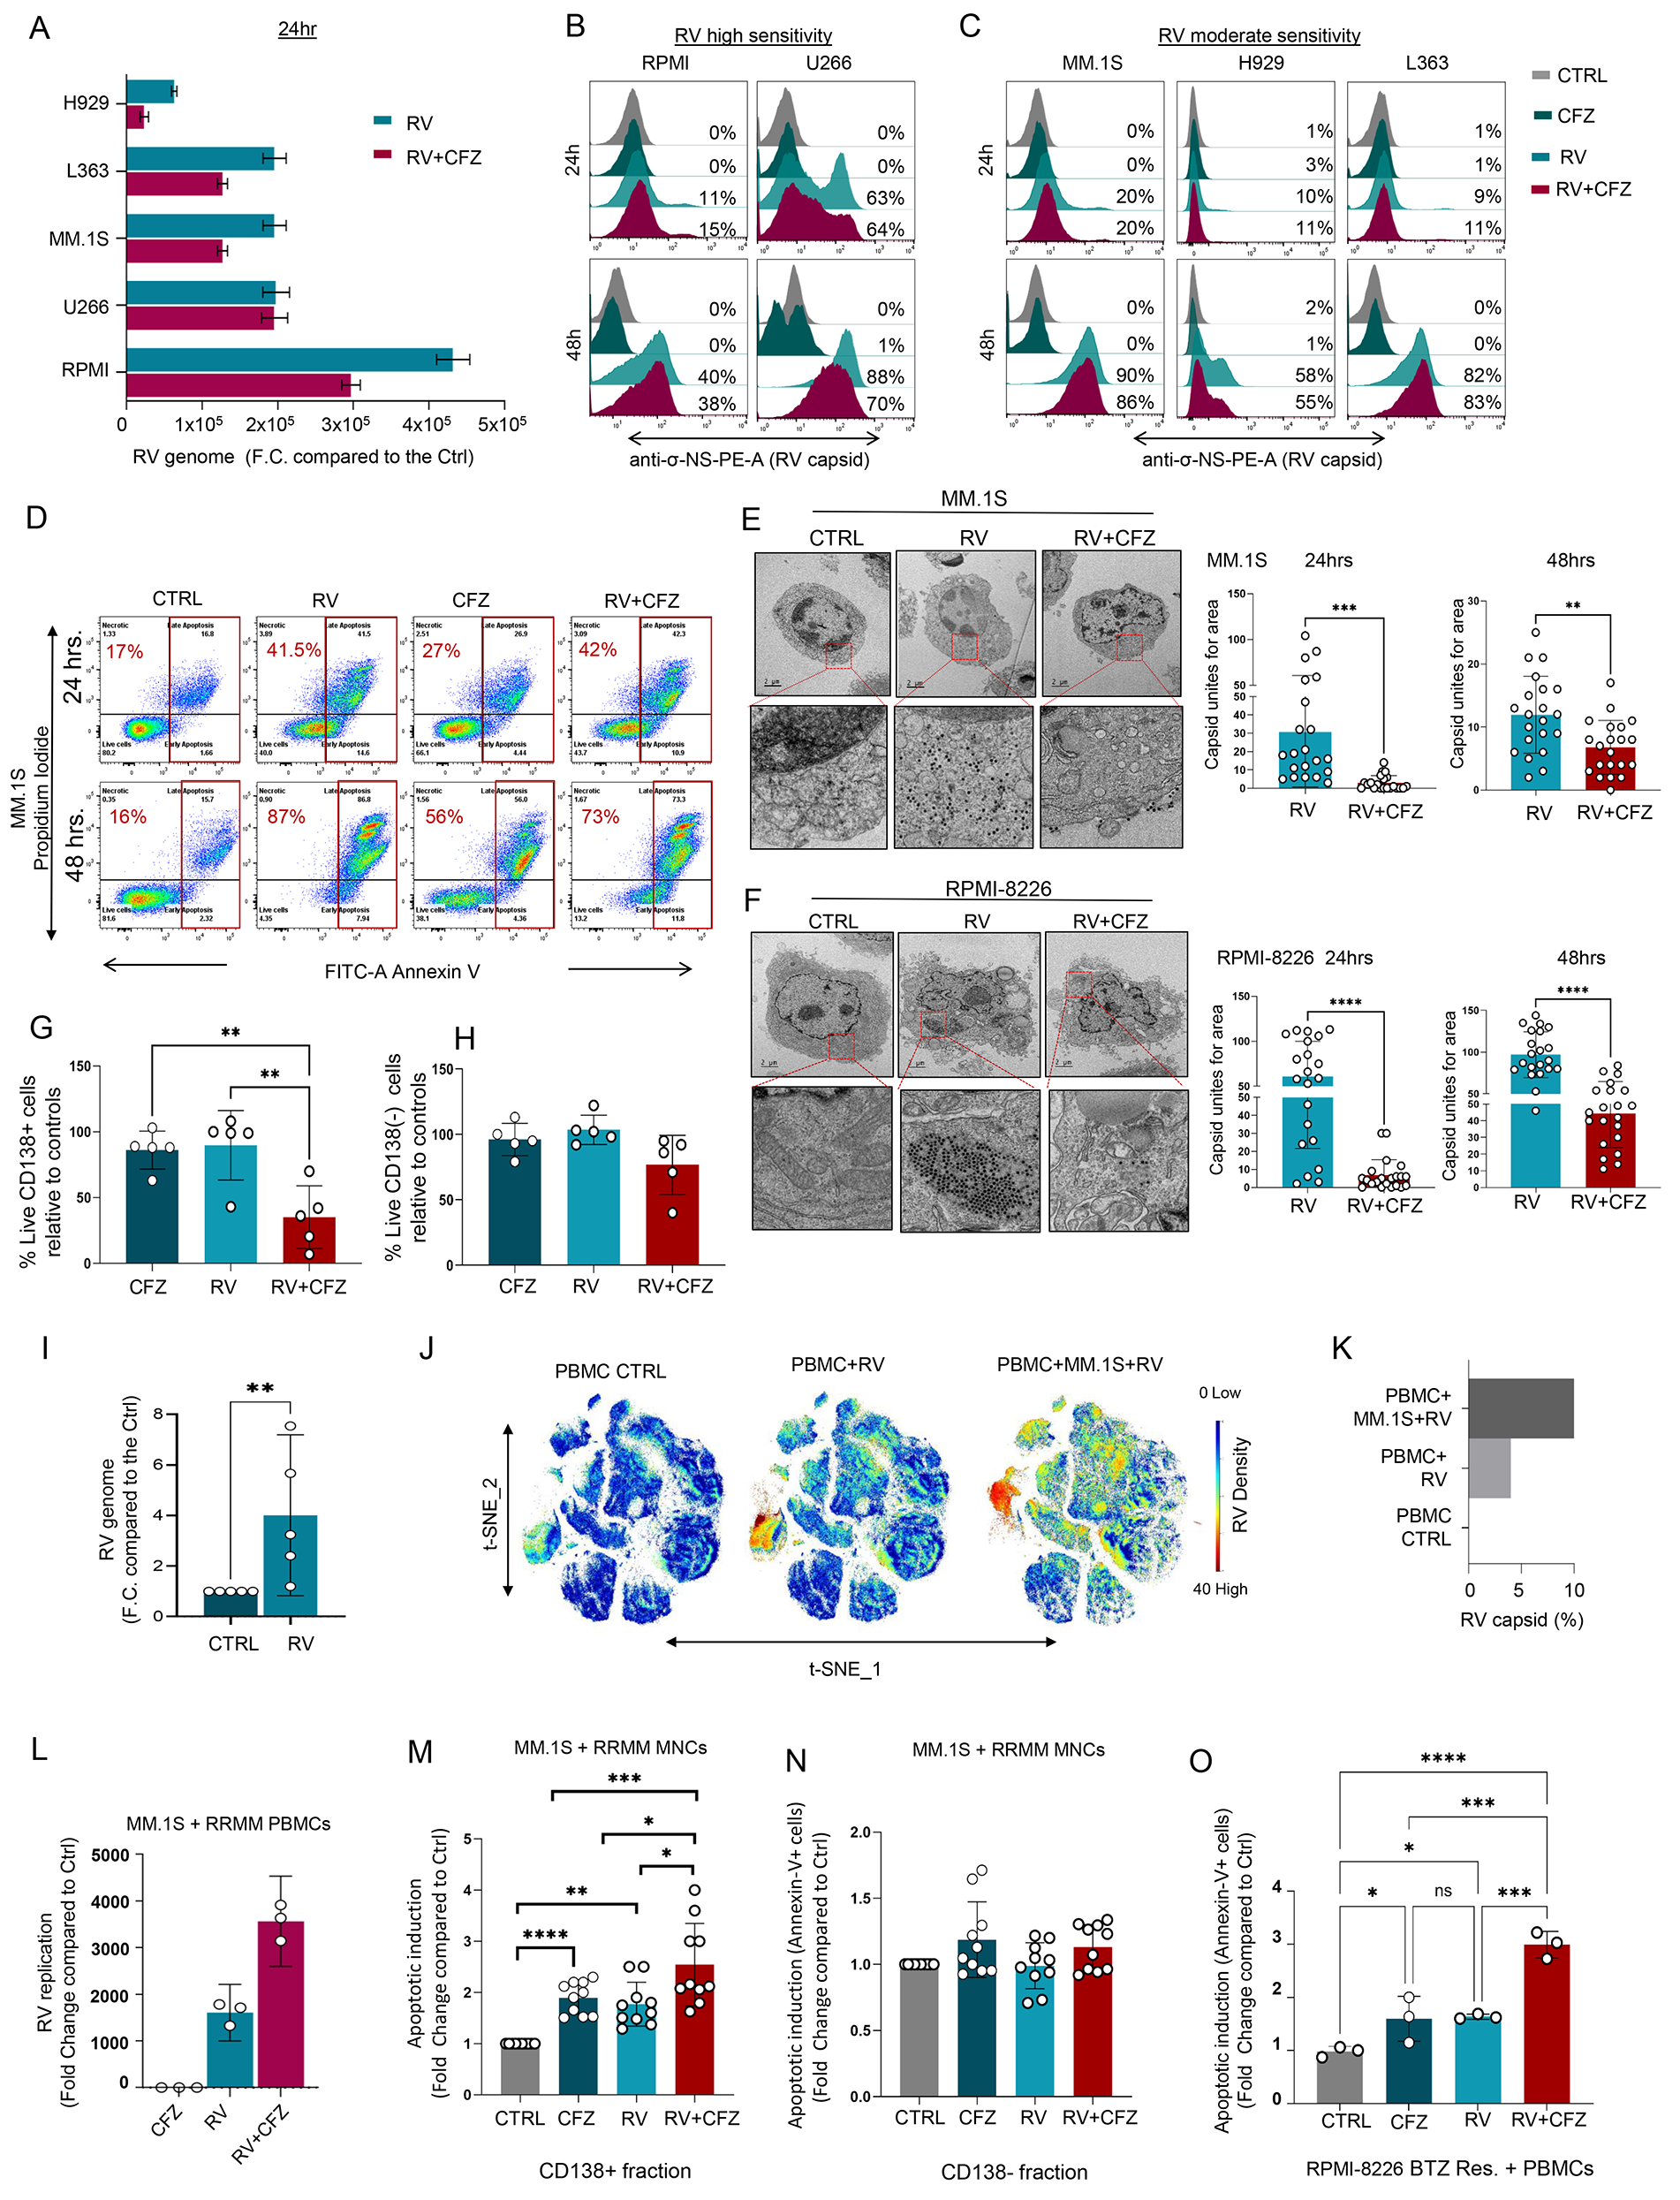
In line with previously published results from other groups [23], our data show that PIs do not enhance RV viral replication in MM cell lines. Specifically, when MM cell lines with moderate (MM.1S, L363, H929) and high (RPMI-8226, U266) viral tropism [12] were treated with Pelareorep in combination with CFZ, we observed either decreased or unchanged levels of RNA genome (Fig. 1A) and sigma non-structural capsid protein (σ-NS), compared to cells treated with Pelareorep alone (Fig. 1B, C). Similar effects were observed when the PI BTZ was used (Supp. Figure 1A, B, C). Additionally, our data show that at early time points (24 h) PI treatment did not increase Pelareorep-induced apoptosis in all the MM cell lines we tested (Fig. 1D and Supp. Figure 1D, E). Increased apoptosis in PI + Pelareorep treated cells was also not observed at a later time point of treatment (48 h) (Fig. 1D). Electron microscopy data additionally showed that, in all MM cell lines we tested (MM.1S, RPMI-8226, U266), the addition of a PI decreased capsid formation. A significant decrease in capsid unit count was observed in these cells at both 24 (MM.1S p = 0.0006; RPMI p < 0.0001; U266 p = 0.0005) and 48 h (MM.1S p = 0.003; RPMI p < 0.0001; U266 p < 0.0001) (Fig. 1E-F and Supp. Figure 1F). This PI-induced decrease in virus formation was not observed in PI-insensitive, Pelareorep-sensitive acute myeloid leukemia cells (THP-1) (Supp. Figure 1G), further supporting that viruses prefer to replicate in viable rather than dying cells [27]. We also did not observe significant differences in plaque forming units (PFU) within Pelareorep and CFZ + Pelareorep treated MM cell supernatants collected 96 h after treatment (Supp. Figure 1H, I).
Fig. 1
PIs potentiate RV-induced MM cell killing only with the involvement of the microenvironment. (A) MM cell lines (RPMI-8226, U266, MM.1S, L363, H929) were treated with CFZ (5 nM) and/or Pelareorep (5 MOI) for 24 h to assess the RV genome (mRNA) expression by q-RT-PCR; (B-C) Offset histograms showing sigma non-structural capsid protein (σ-NS) on cell lines with high (RPMI-8226, U266) and moderate (MM.1S, H929, L363) sensitivity to Pelareorep infection treated with either CFZ (5 nM) or Pelareorep (5 MOI) as single agent or in combination for 24 and 48 h; D) Representative flow cytometry plots using Annexin V-FITC/PI staining for apoptosis, showing the apoptotic rate (%) of MM.1S cells exposed to both CFZ (2.5 nM) and RV (5 MOI) alone or in combination for 24–48 h; E-F) Transmission electron microscopy (TEM) and related quantification of MM.1S (E) and RPMI-8226 (F) cells treated with CFZ (5 nM) or Pelareorep (5 MOI) alone or in combination for 24 h and 48 h. TEM images were taken at nominal 11,000 x magnification. Statistical analysis was performed using two-tailed unpaired t-test: ∗∗∗≤0.01 (MM.1S 24 h), ∗∗p ≤ 0.01 (MM.1S 48 h), ∗∗∗∗p ≤ 0.0001 (RPMI 24–48 h); (G) Bar graph showing significant decrease in cell survival (%) in the CD138+ fraction (MM cells) treated with CFZ + RV compared to the single agents for 48 h, and ordinary one-way ANOVA test was performed ∗∗p ≤ 0.01 in n = 4 MM patients; H) Bar graph showing no significant decrease in cell viability (%) in the matched CD138neg fraction in the same experimental conditions; (I) RV capsid mRNA level expression in healthy donor (HD) PBMCs infected with RV (10 MOI) as fold change (F.C.) compare to the CTRL. Data are expressed as the mean ± SEM (n = 5 HDs), normalized compared to control GAPDH; ∗∗p ≤ 0.01; J) A 34-Ab CyTOF panel was used to generate FCS files. Hierarchical clustering and statistical mapping were performed algorithmically via Cytobank© platform. vi-SNE analysis (iterations = 4000, perplexity = 50) is displayed as 2D plots using the resultant t-SNE_1 and t-SNE_2 dimensions. t-SNE heatmaps according to the density expression of RV capsid (Tb159Di) was gated for the total leukocytes from an HD PBMC infected or not with RV (10 MOI), or in Pelareorep-treated PBMCs to which we added for 1 h MM.1S cells that had been pre-infected for 24 h; K) Bar graph showing RV capsid signal intensity (%) from treatment conditions in (J); L) q-RT-PCR of the viral genome expression of PBMCs isolated from a RRMM patient, treated or not with RV (5 MOI) and CFZ (2.5nM), and co-cultured with MM.1S cells for 12 h. Data are expressed as the mean ± SEM in triplicates; M-N) Flow cytometry-based killing assay was performed using mononuclear cells (BM = 3, PB = 2) obtained from RRMM patients co-cultured (8:1) with MM.1S GFP + for 24 h and treated or not with RV (5 MOI) and CFZ (2.5 nM) alone or in combination. Bar graphs showing respectively the killing rate of the CD138+ fraction (M) and the CD138neg fraction (N). Data are expressed in fold change compared to the control in n = 5 RRMM patients each done in two independent duplicate ∗∗∗∗p ≤ 0.0001, ∗∗∗≤0.01, ∗∗p ≤ 0.01, ∗p ≤ 0.05; O) Bar graph showing the apoptotic induction of RPMI-8226-BTZ resistant cells co-cultured with HD PBMCs and exposed to RV (5 MOI) and CFZ (5 nM) alone or in combination. Data are expressed in fold change compared to the control each done in independent triplicate ∗∗∗≤0.01, ∗∗p ≤ 0.01, ∗p ≤ 0.05
We then investigated whether PIs could instead increase Pelareorep-induced killing of MM cells in the presence of the tumor microenvironment, independently of its direct anti-MM activity, in both an animal model, as recently published [23], and in the ex vivo setting. Total MM BM-MNCs, which contain CD138 + MM cells, fibroblasts, and immune cells, were obtained from patients with MM at different disease stages (n = 5, 2 smoldering, 1 newly diagnosed and 2 relapsed MM) and treated for 48 h with CFZ or Pelareorep alone or in combination. Our data show a significant decrease in the viable CD138 + fraction (MM cells) treated with PI + Pelareorep, compared to the single agents (PI + RV versus RV p = 0.01; PI + RV versus CFZ p = 0.008) (Fig. 1G), an effect that was not observed in the matched CD138(-) cells in the the same experimental conditions (Fig. 1H). MM adhesion to the BM stromal cells displayed resistance to RV infection and induced oncolysis (Supp. Figure 2A), excluding that these cells may contribute to the enhancement of RV-induced MM cell killing activity by PIs. Because it has been reported that, despite the presence of neutralizing antibodies, replication-competent RV can be recovered from PBMCs but not plasma obtained from colorectal cancer patients treated intravenously with a single dose of RV [28], we decided to investigate whether the immune environment would instead be responsible for supporting RV replication and subsequent MM cell infection. When human PBMCs isolated either from patients with MM or healthy donors (HDs) were treated with Pelareorep for 24 h, a significant increase in the viral genome (p = 0.008, n = 5 donors) was observed (Fig. 1I), supporting that a limited viral replication can be detected even in non-cancer cells. Consistent with these data, single-cell mass cytometry (CyTOF) analysis showed a localized expression of the inner viral capsid protein σ-NS, whose expression is associated with active viral replication [12, 29], in PBMCs treated ex vivo with Pelareorep for 24 h (Fig. 1J-K and Supp. Figure 2B). A greater increase in capsid expression in human PBMCs was found when MM.1S cells were added to Pelareorep-treated PBMCs (Fig. 1J-K and Supp. Figure 2B), and the capsid signal increased with increased number of virions (Supp. Figure 2C), supporting the specificity of intracellular capsid detection.
Fig. 2
Proteasome inhibitor enhanced viral replication requires monocytes. (A) Violin-plot showing (σ-NS) signal in 3 MM patients analyzed by CyTOF ∗p ≤ 0.05; (B-C) 34-Ab CyTOF panel used to generate FCS files. Hierarchical clustering and statistical mapping performed algorithmically via the Cytobank© platform. vi-SNE analysis (iterations = 3000, perplexity = 100) displayed in 2D plots using the resultant t-SNE 1 and t-SNE 2 dimensions. High-fidelity FlowSOM (“self-organizing map”) (metacluster = 10 and cluster = 100) based on vi-SNE 2D plots showing 22 different immune-compartments in total PBMCs of MM patients infected or not with RV (10 MOI). Red signal shows RV capsid (σ-NS) in monocytes (B). t-SNE heatmap highlighting density expression of selected RV capsid (σ-NS) signal (C); D-E) CyTOF high-fidelity FlowSOM in MM-PBMCs infected or not with RV (10 MOI) alone or in combination with CFZ (2.5 nM) and t-SNE heatmap, showing increased RV capsid (σ-NS) detection in Classical Monocytes after RV + CFZ co-treatment or RV + CFZ pretreatment (count: RV = 2890, RV + CFZ pretreatment = 4605, RV + CFZ cotreatment = 4702) (D), and heatmap graphical representation of RV absolute count detection in the different monocyte subsets (E); For each experimental condition the same number of events were acquired and analyzed. (F) q-RT-PCR for the viral genome expression of RV-infected HD-PBMCs or isolated HD-CD14+ population after 24 h, normalized to control GAPDH and expressed as the mean ± SEM of triplicates in fold change (FC) compared to RV alone; (G) Western blot analysis of (σ-NS) viral protein in HD CD14 + selected population after 8hrs of PIs (CFZ and BTZ, 2.5 nM) and RV treatments alone or in combination; (H) Offset histograms showing JAM-1 flow cytometry detection in different immune subsets as indicated. The experiment was repeated in n = 3 independent triplicate; (I) CD14+ cells were seeded and incubated with JAM-1 blocking Ab (10-50-100-150 ug/mL) for 1 h, then infected with RV 5 MOI for 24 h. q-RT-PCR for the viral genome expression was normalized to control GAPDH and expressed as the mean ± SEM of triplicates compared to RV alone ∗∗∗∗p ≤ 0.0001; (J) Western blot analysis on THP-1 showing RV (σ-NS) protein detection after specific JAM-1 knockdown; (K) Schematic representation of mice experiment: 12 immune competent myeloma mice (C57BL/KaLwRij) were injected intra-femoral with 1 × 10⁵ 5TGM1 murine MM cells and treated with 150 mg/kg clodronate-liposome for monocytes-macrophages depletion or control, then with or without intravenous injection of RV (5 × 10⁸ TCID50) for 48 h; (L-M) Violin plots showing bone marrow RV (σ-NS) capsid formation (∗∗p ≤ 0.01) (L) of treated mice and in MM-CD138 + cells (∗∗p ≤ 0.01 and ∗p ≤ 0.05) (M), analyzed by flow cytometry
These findings prompted us to investigate whether PIs could indeed increase viral replication in the presence of immune cells. Our data show that after 24 h of treatment, the addition of CFZ significantly increased RV replication not only in healthy PBMCs (p < 0.001) (Supp. Figure 2D) co-cultured with MM cells but also when PBMCs obtained from patients with refractory MM (n = 3, p < 0.01) were used (Fig. 1L). Pelareorep-induced MM killing was also enhanced in the presence of CFZ when MM cells (GFP + MM.1S) previously unexposed to the virus were co-cultured either with MNCs from patients with multi-relapsing MM (n = 5) or healthy donors (n = 3), at the ratio 8 MNCs:1 MM.1S GFP + cells, compared with effects from each single agent alone (Fig. 1M-N and Supp. Figure 2E).
To assess whether the enhanced CFZ + RV MM cell killing that was observed when MM cells were co-cultured with MNCs was independent of bortezomib (BTZ) mechanisms of resistance, we tested whether this effect was also reproducible in PI-resistant cells (RPMI-8226-BTZ-res). Although, as expected, BTZ-res cells remained insensitive to BTZ treatment compared to the parental cells (WT), both cell lines were equally sensitive to RV infection (Supp. Figure 2F-G-H). Interestingly, the addition of PBMCs increased BTZ sensitivity in both BTZ-res and WT cells (Supp. Figure 2I). A significant increase in MM cell killing was also observed when BTZ-res cells were co-cultured with PBMCs and treated with CFZ + Pelareorep, compared to levels from each agent alone (p < 0.01) (Fig. 1O).
Proteasome inhibitor‒enhanced viral replication requires monocytesBecause our data suggested that PIs (CFZ and BTZ) improve RV productive infection in PBMCs and subsequent infection and killing of cancer cells, we investigated which immune compartment is responsible for this effect.
Twenty-two different immune compartments including CD4 + and CD8 + T cell subsets (naïve, central memory [CM], effector memory [EM] and terminally differentiated [TEMRA]), natural killer T cells (NKT), classical phagocytic and non-classical monocytes, and NK cells (Supp. Table 1) were interrogated for the presence of viral capsid protein (σ-NS) using CyTOF. After 24 h of Pelareorep treatment, the RV capsid was mainly found in the monocyte compartment (CD45 + CD20-CD3-CD56-CD14 + HLA-DR+) (Supp. Figure 3A-C). Significant capsid accumulation in the CD14 + fraction, compared to the matched CD14(-) fraction, was observed in all PBMCs isolated from patients with MM (p = 0.034, n = 3) and healthy donors (p = 0.03, n = 4) (Fig. 2A-C and Supp. Figure 3A-E). Cell cluster visualization self-organizing map (FlowSOM) (Fig. 2B and Supp. Figure 3B) and t-distributed stochastic neighbor embedding (t-SNE) heatmaps (Fig. 2C and Supp. Figure 3C) showed that the σ-NS signal (red) was primarily observed in the Classical monocytes (phagocytic) in PBMCs from both healthy donors and patients with MM. Specifically, we found active viral replication at 24 h in 10% +/- 3.05% of the phagocytic monocytes, but almost no replication was observed in both Intermediate and Non-Classical monocytes (Fig. 2D, E).
Fig. 3
CFZ impairs the monocyte-mediated antiviral response without affecting T cell activation. (A) Representative merge of immunofluorescence fields showing p65 staining (green) as indicated and DAPI staining for nucleic acids (blue) in HD and RRMM CD14+ isolated cells treated with CFZ for 30 min, then infected or not with RV (5 MOI) for 2–4 h. TNF-α (50 ng/ml) was used as a positive internal control showing p65 nuclear translocation; (B-C) Imaging-based quantification up to 2 h of fluorescence staining intensity vs. pixel position of 50 representative cells in HD (B) and 4 h for RRMM CD14+ isolated cells (C). Comparisons among groups were performed by one-way ANOVA: ∗∗∗≤0.01, ∗∗∗∗p ≤ 0.0001; (D-E) Histograms showing IFN-α (D) and IFN-β (E) mRNA expression of RV infected (5 MOI) or uninfected HD-PBMCs and treated with different concentrations (1 or 2.5 nM) of Bay-11 for 24 h and normalized to control GAPDH. Data represent the mean ± SD expressed in F.C. compared to the control; (F) Flow cytometry-based killing assay was performed using HD PBMCs co-cultured (8:1) with MM.1S GFP+ for 24 h and treated or not with RV (5 MOI) and Bay-11 (2.5 nM) alone or in combination; the experiment was repeated in n = 3 independent replicates (G) Bar graph showing the killing rate as 7-AAD in % expressed as the mean ± SEM of triplicates ∗∗∗∗p ≤ 0.0001; (H) q-RT-PCR showing RV capsid formation in the same experimental conditions used in F. Data are normalized and expressed as mean ± SD in F.C. compared to the control GAPDH; (I) Western blot assay on THP-1 cells showing RV (σ-NS) protein detection after treatment with Bay-11, BTZ, CFZ 2.5 nM and RV 5 MOI alone or in combination; (J) Luciferase reporter assays in HEK293 cells transfected with plasmids encoding a NF-κB luciferase reporter gene, and treated with RV (5MOI) and CFZ (10 nM and 2.5 nM) up to 72 h; TNF-α (5 ng/ml) was added to all the wells. NF-κB activity was determined by luciferase assay (mean ± SD (n = 3), ∗∗∗∗p ≤ 0.0001, ∗∗∗≤0.01, ∗∗p ≤ 0.01; (K-L) q-RT-PCR showing IFNs type I (IFN-α and IFN-β) induction after RV (5 MOI) and CFZ (2.5 nM) treatments in HD PBMCs at different time points (2-4-12–24 h). Data are normalized to control GAPDH and expressed as mean ± SD in F.C. compared to the control; (M) Heatmap of multiplex cytokine profile performed on supernatant from PBMCs from an HD treated for 4 h with CFZ, RV or both, showing 14 out 22 of the analyzed cytokines, in which the signal was detected; (N-O-P) Mass cytometry t-SNE heatmaps showing CD69 and CD80 expression in RRMM isolated PBMCs with or without RV infection (10 MOI) and CFZ treatment (2.5 nM) for 24 h; Bar graphs showing CD69 and CD80 relative expression in the monocytes (O) and CD69 in the T cells (P) of n = 4 RRMM patients. Data are expressed as mean ± SD in F.C. compared to the control; (Q-R) Three representative fields for each treatment conditions of live-cell imaging of phagocytic activity of CD14+ cells isolated from one patient showing higher phagocytic ability of CFZ-treated macrophages compared to the control macrophages as shown by the significant difference in the mean fluorescence intensity (MFI) (right) (R); (S-T) Representative flow cytometry analysis showing the gating strategy for one out of n = 4 different healthy donors analyzed and dot plot (S) showing increased CD14+ co-localization with MM.1S GFP + cells after overnight incubation with RV (5 MOI) + CFZ (2.5nM) treatments. Data analyzed by one-way ANOVA
We then investigated whether PIs could increase RV in the monocytic fraction. When PBMCs were treated with Pelareorep alone or in combination with CFZ, viral replication occurred exclusively in the Classical monocyte population, with more replication evident following combination treatment (absolute count: 4605 and 4702 [CFZ pretreatment or CFZ + RV co-treatment, respectively] vs. 2890 [RV alone]) as shown by FlowSOM, t-SNE heatmap graphical representation, and heatmap of monocyte compartments from CyTOF of PBMCs from relapsed MM (Fig. 2D-E) and healthy PBMCs (Supp. Figure 3E-G). Analysis conducted in primary CD14 + selected populations by flow cytometry, Western blot, and qRT-PCR confirmed that the addition of PI to RV-infected cells enhanced capsid formation and replication (Fig. 2F, G and Supp. Figure 3H) based on detection of σ-NS. An increase in RV genome replication upon CFZ treatment was not noted in all major CD14-negative immune subsets including purified B, T, and NK cells (Supp. Figure 3I).
Because we found active viral replication in the CD14 + fraction, we tested whether the junctional adhesion molecule 1 (JAM-1) receptor [9] mediates RV entry in this cellular subset. Flow cytometry analysis of different immune cell subsets in healthy donor PBMCs revealed high JAM-1 expression on the surface of the monocyte population (Fig. 2H and Supp. Figure 3J). When primary CD14 + cells were pre-treated with an anti-JAM-1 blocking antibody, we observed that RV replication was significantly downregulated (Fig. 2I). Moreover, following knockdown of JAM-1 expression in a monocytic-like cell line (THP-1), viral replication was also strongly impaired as shown by Western blot analysis (Fig. 2J and Supp. Figure 3K, L).
To assess whether the CD14 + fraction is critical for RV delivery to the cancer cells in vivo, we induced monocyte/macrophage depletion in an immunocompetent MM animal model using clodronate liposomes (Clo). Specifically, 1 × 10⁵ murine MM 5-TGM1 cells were intrafemorally injected into syngeneic C57BL/KaLwRij mice. After 28 days, mice were randomized to receive clodronate liposomes (Clo) plus RV (1 × 10⁷ termination of the 50% tissue culture infectious dose [TCID50]) or control liposomes (CTRL) plus RV (1 × 10⁷ TCID50). Mice treated with only Clo or CTRL were also included as internal controls (Fig. 2K). After 48 h, RV capsid formation by flow cytometry in BM-MNCs and in MM-CD138 + cells was significantly lower in the Clo + RV treated group compared to that in the CTRL + RV group (p = 0.004) (Fig. 2L, M and Supp. Figure 3M).
CFZ impairs the monocyte-mediated antiviral response without affecting T cell activationOncolytic viruses induce an antiviral immune response [30] that is often accompanied by nuclear factor kappa B (NF-κB) activation [31] and dysregulated release of inflammatory cytokines from monocytes to block active viral infection [32]. For this reason, we investigated whether Pelareorep could induce NF-κB activation in monocytes. Immunofluorescence analysis at both 2 and 4 h after RV infection of a monocytic cell line (THP-1) showed a significant increase in p65 nuclear translocation compared to that in the RV-untreated cells (p < 0.0001) (Supp. Figure 4A, B), an effect that was similar to one observed in cells treated with the specific NF-κB activator TNF-α (Supp. Figure 4A-C). A significant decrease in p65 nuclear translocation was observed when CFZ was added to RV-treated cells (p < 0.0001), supporting that PI impairs NF-κB activation upon RV infection. (Supp. Figure 4C). A significant decrease (p = 0.0001) in p65 nuclear translocation was also observed when CFZ was added to RV-treated primary CD14 + monocytes isolated either from healthy or relapsed/refractory MM (RRMM) donors in the same experimental conditions (Fig. 3A-C), supporting that this phenomenon is general.
Fig. 4
RV combined with CFZ increases viral replication in the bone marrow of MM patients. (A) Schematic representation of the treatment schedule for patients with relapsed MM enrolled in Phase 1b clinical trial of the combination of Pelareorep and carfilzomib; (B) Waterfall plot illustrating best response of each patient. The overall response rate (ORR) was 53.8% (7/13) and clinical benefit rate (CBR) was 69.2% (9/13). Patients treated at dose level 1 had an overall response rate (ORR) of 83.3% (5/6) and clinical benefit rate (CBR) of 100%. Responses at this dose level included very good partial response (VGPR, n = 2), partial response (PR, n = 4), minimal response (MR, n = 1) stable disease (SD n = 3), and progressive disease (PD n = 1). Patients treated at dose level − 1 had an ORR of 28.6% (2/7) and CBR of 42.9% (3/7); (C-D) 4X magnification images of immunohistochemistry (IHC) showing the in-situ data for the detection of reoviral RNA (signal blue with pink counterstain) and reoviral capsid protein (signal brown with blue counterstain) pre and post-treatment in RV alone and RV + CFZ treated patients. Note that reoviral RNA is evident only after post-treatment and that many more cells have detectable viral RNA compared to the capsid protein in the serial sections; (E) Bar graph showing σ-NS protein detection at a low and standard dose of CFZ (p = 0.028) in the BM. Each value represents the number of positive cells per 200x field; (F) 4X magnification images of IHC of PD-L1 protein (signal brown with blue counterstain) pre and post-treatment (n = 5); (G) 4X magnification images of immunofluorescence showing the co-expression of PD-L1 (fluorescent red) and CD138 (fluorescent green), and 20X magnification at post-treatment Merged image with co-expression seen as fluorescent yellow (scale bars at 150 micrometers); (H-I) Bar graph showing significant upregulation of PD-L1 (H) and Caspase-3 on the surface of MM cells (I) (p = 0.005) in RV + CFZ treated patients relative to pre-treatment (n = 5) an effect was not observed in the RV only treated pts. Each value represents the number of positive cells per 200x field
Since our data suggested that CFZ increases RV productive infection in circulating monocytic cells, we investigated whether blocking NF-κB activation could impair the expression of the anti-viral IFN-I response. Our data show that RV infection of PBMCs increased IFN-α and IFN-β expression, an effect that was reverted by the addition of the NF-κB specific inhibitor Bay-11 (Fig. 3D, E). Aligned with this observation, our data show that, when MM.1S cells were co-cultured with PBMCs from RRMM donors, the addition of Bay-11 also potentiated the anti-MM activity of RV (Fig. 3F, G). This effect was associated with enhanced capsid formation (Fig. 3H), as also shown by Western blot analysis in a monocytic cell line (Fig. 3I). An NF-κB reporter luciferase assay also showed that the addition of CFZ decreased NF-κB transcriptional activation, which was induced upon RV infection (Fig. 3J).
As expected, IFN-α and IFN-β expression were also significantly impaired in CFZ + RV treated cells compared to RV alone at different timepoints (Fig. 3K, L and Supp. Figure 4D-G), an effect that was observed exclusively in the monocytic fraction (CD14 + population) (Supp. Figure 4H, I).
A cytokine array analysis conducted in the CD14 + fraction isolated from either healthy donors or patients with relapsed MM showed that RV-treated PBMCs for 4 h released pro-inflammatory cytokines (IL-8, IL-10, IL-12, IL-13, and TNF-α) and chemokines (MIP-1 α and β, MIG, IL-8, MCP-1) (Fig. 3M and Supp. Figure 4J), an effect that was almost completely abrogated by adding a PI (CFZ or BTZ) or Bay-11 (Fig. 3M and Supp. Figure 4J). q-RT-PCR analysis also confirmed that the addition of BTZ arrested IFN-α and IFN-β expression (Supp. Figure 4K).
In-depth clustering CyTOF analysis revealed that RV infection induced significant upregulation of the early activation marker CD69 in the monocytes and T cells and of the T cell costimulatory receptor CD80 in the monocytic fraction of freshly isolated PBMCs obtained from either patients who were treated with dexamethasone and PI-based regimens or healthy donors (Fig. 3N, O and Supp. Figure 4L, M). Addition of CFZ to RV did not significantly decrease the expression of CD69 or CD80, in the monocytic or T cell fraction isolated from patients with relapsed MM or in healthy donors (Fig. 3O, P and Supp. Figure 4M). The increase in T cell co-stimulatory molecules in the monocytic fraction is aligned with recently reported murine data in which T cell activation occurred in immune competent mice treated with RV alone or RV combined with a PI [23]. Because polarized monocytes, in addition to inducing T cell responses, can also act as scavenger cells, we tested whether, besides promoting virus delivery to MM cells, CFZ could also potentiate monocyte phagocytosis. For this purpose, we isolated CD14 + fractions from the PBMCs obtained from one patient; the phagocytic activity of the monocytes after polarization was detected by live cell-imaging microscopy. Our data show that CFZ treatment induced a significant increase in phagocytic activity of polarized monocytes (Fig. 3Q, R).
Because we were limited by the number of isolated CD14 + cells, phagocytic activity of MM cells upon CFZ treatment was instead assessed in healthy donor PBMCs using flow cytometry-based analysis. After an overnight incubation, CD14 + populations from each treatment group were purified and co-cultured with GFP + MM cells (MM.1S) for 24 h. We observed significant increase in phagocytic activity when CD14 + cells were pre-treated with both PI and RV compared to control saline treated CD14 + cells (p = 0.018), as shown by the surge of a double positive (CD14+/GFP+) cellular population (Fig. 3S, T). Significantly higher MM cell death was also observed when the CD14 + fraction was pre-treated with RV + CFZ, compared to each single agent, using the same experimental settings associated with an increase in RV productive infection (Supp. Figure 4N, O).
RV combined with CFZ increases viral replication in the bone marrow of patients with MMWe previously showed in a phase 1 trial that replicating viral genome is found in the MM cells of relapsed patients treated with single agent Pelareorep, but neither active RV replication, as defined by concomitant robust viral capsid production, nor significant clinical response [17] was observed. Because our preclinical data showed that PI increased infection of monocytes and subsequent delivery of virus to the MM cells, we tested this concept in specimens obtained as part of a phase 1b study of RV in combination with CFZ in relapsed myeloma (NCT02101944). Patients were treated on days 1, 2, 8, 9, 15 and 16 of a 28-day cycle. Pre-treatment samples (baseline) were collected just prior to cycle 1 day 1 RV + CFZ infusion for each patient. Treatment included intravenous dexamethasone followed by intravenous CFZ for over 30 min, and then RV infusion over 60 min. We aimed to identify the maximum tolerated dose of Pelareorep combined with CFZ. All safety analyses were conducted during cycle 1. Patients were infused with CFZ 20 mg/m2 on days 1 and 2 of cycle 1, and 27 mg/m2 thereafter. The starting dose of Pelareorep was 3 × 10¹⁰ TCID50/day, and all patients received dexamethasone 20 mg on each treatment day (Fig. 4A).
Thirteen patients were enrolled; baseline demographics are summarized in Supplementary Table 2. All patients were Caucasian, seven were male, six were female, and the median age was 60 (range 43–70). The median International Staging System stage at diagnosis was 2 (range 1–3), and one patient was dialysis dependent. Six patients had evidence of high-risk cytogenetics (+ 1q21, t(4;14), t(14;16) or del17p) at the time of diagnosis, and ten had high-risk cytogenetic features at the time of screening. The median number of prior therapies was 4 (range 2–12), and prior lines of treatment was 2.5 (range 1–9). All patients were lenalidomide refractory and BTZ exposed, 84.6% (11/13) were BTZ refractory, two patients were pomalidomide refractory, and one patient was CD38 antibody refractory. Five patients were CFZ exposed, and all were considered to be refractory (Supp. Table 3); 3 of these patients had evidence of disease progression during CFZ treatment, while two others were deemed carfilzomib refractory based on lack of achieving response while on treatment [33]. All patients previously CFZ exposed were treated per historical standard of care dosing including treatment on days 1, 2, 8, 9, 15, and 16 of 28-day cycles (20 mg/m2 on cycle 1 days 1 and 2, followed by 27 mg/m2 thereafter), and three patients had received two prior CFZ-containing regimens. The median duration of exposure to CFZ in these five patients was 8 months (range 1.5–20), and the best overall response to a CFZ-containing regimen in these patients was a partial response.
The ten most common treatment-emergent toxicities per CTCAE v5.0 in cycle 1 included hypertension (one grade 2 and four grade 1), thrombocytopenia (two grade 3, one grade 2, one grade 1), anemia (one grade 2 and 3 grade 1), dyspnea on exertion (one grade 2, three grade 1), myalgia (three grade 1), fever (one grade 2, one grade 1), lymphopenia (one grade 3 and one grade 1), nausea (one grade 2, one grade 1), and diarrhea (one grade 1, one grade 2) (Supp. Figure 5A). Two patients (ID 2 and ID 5) experienced dose-limiting toxicities, specifically thrombocytopenia (with bleeding) and acute congestive heart failure, attributable to CFZ and possibly related to Pelareorep, respectively. Because of these toxicities, subsequent patients were treated at dose level − 1 with CFZ 20 mg/m2 and Pelareorep 3 × 10⁹ TCID50/day on all treatment days.
Fig. 5
RV combined with a PI induces immune activation. (A) Violin plots representing multiparametric flow cytometry studies on PB from MM relapsing patients enrolled in RV + CFZ Phase 1b clinical trial, showing overall expansion of total monocytes absolute count (∗∗p ≤ 0.01) (A); (B) Line graphs representing longitudinal multiparametric flow cytometry studies on PB from MM relapsing patients enrolled in RV + CFZ Phase 1b clinical trial, showing overall expansion of total monocytes absolute count. Wilcoxon signed rank p-values: C1D9 > C1D1 p-value = 0.054; (C-D) Violin plots representing higher frequency of CD14++ CD16- Classical Monocytes (C) and increase in CD69 activation marker in the total monocytes (p = 0.047) (D) on treatment up to the C1D9 compared to baseline C1D1. Statistical analysis was performed following Wilcoxon signed rank p-values, ∗∗p ≤ 0.01, ∗p ≤ 0.05; (E) Violin plots representing a slight increase in CD69 activation marker in the PB monocyte compartment of n = 4 different patients who were not exposed to CFZ prior the treatment compared to n = 4 different patients who instead were CFZ exposed before starting the therapy; (F-G) Violin plots highlighting the increased CD8 expression (F) and the decreased CD4 expression (G) up to C1D9. Data are expressed as change from baseline %, Wilcoxon signed rank p-values: ∗p ≤ 0.05; (H) Violin plot highlighting a decrease in CD4/CD8 ratio from baseline up to C1D9. Data are expressed as change from baseline %, Wilcoxon signed rank p-values: ∗p ≤ 0.05; (I) In-depth immune profiling of a longitudinal CFZ-resistant patient (RRMM-1) enrolled in RV + CFZ Phase 1b was performed with the Maxpar Direct Immune Profiling System using a dry 30-marker antibody panel. Hierarchical clustering and statistical mapping performed algorithmically via the Cytobank© platform. vi-SNE analysis (iterations = 1000, perplexity = 30) displayed in 2D plots using the resultant t-SNE 1 and t-SNE 2 dimensions. High-fidelity FlowSOM (“self-organizing map”) (metacluster = 10 and cluster = 100) based on vi-SNE 2D plots showing 22 immune different immune-compartments; (J-K-L) t-SNE heatmap of 3 longitudinal CFZ-resistant patient enrolled in RV + CFZ Phase 1b highlighting expression of selected monocyte population after treatment C1D9 for RRMM-1 (J), C1D16 for RRMM-2 (K), C1D1 for RRMM-3 after 4 h of treatment (L); (M-N-O) heatmaps showing absolute count of the different monocyte compartments of 3 longitudinal CFZ-resistant patient enrolled in RV + CFZ Phase 1b; (P-Q-R) Heatmaps showing overall distribution of naïve and memory Tregs during the course of the therapy
Eleven patients completed at least one cycle of treatment and were evaluable for response. The response outcomes from baseline include very good partial response (VGPR, n = 2), partial response (PR, n = 4), minor response (MR, n = 1), stable disease (SD, n = 3), and progressive disease in one patient (Fig. 4B, and Supp. Figure 5B). The two patients who experienced a DLT following two doses of combination treatment had a 96% (patient ID 2) and 27% (patient ID 5) reduction in measurable disease, respectively.
In those patients with BTZ-refractory disease, responses included VGPR (n = 2), PR (n = 4), and SD (n = 3). Responses in patients previously treated with CFZ included PR (n = 1), MR (n = 1), and SD (n = 3). Including all patients evaluable for response, those treated at dose level 1 (DL1) had deeper responses than those treated at dose level − 1 and remained on treatment for a longer period of time (m
留言 (0)