Diabetic neuropathy, a frequent diabetes complication, afflicts nearly half of those with this enduring metabolic condition (1). This progressive degeneration of nerve fibers manifests in a spectrum of symptoms, from sensory disturbances like tingling and numbness in the limbs to severe outcomes such as ulcerations and limb amputations (2). Despite its significant impact on patient health, the underlying mechanisms of diabetic neuropathy are unclear, making it difficult to find effective treatments (3).
Emerging research implicated the perturbation of lipid metabolism as a pivotal factor in the onset of diabetic neuropathy, independent of glycemic status (4–7). In earlier research on diabetic neuropathy, the scope of investigation was confined to fundamental lipid profiles (7–9). However, the advent of sophisticated mass spectrometry techniques has revolutionized our capacity to detect and quantify extensive arrays of lipids, or lipidomes, in biological specimens. Lipidomic analysis holds the potential to pinpoint precise disease biomarkers and shed light on the underlying mechanisms of pathology (10, 11). This enhanced molecular resolution facilitates the creation of more tailored therapeutic strategies, promising a leap forward in the management of diabetic neuropathy.
Thus, we employed a two-sample Mendelian Randomization (MR) analysis, adhering to STROBE-MR guidelines, to investigate the causal links between 179 lipid species and the risk of diabetic neuropathy (12). MR study offers a robust method for exploring causal relationships between exposures and outcomes in epidemiology. Prior research leveraging MR methods has also emphasized some certain diseases associated with lipidomes and diabetic neuropathy (13–15). Using genetic variants as instrumental variables (IVs), MR overcomes confounding, providing more compelling evidence of causality than conventional observational studies (16).
2 Methods2.1 Data sourcesA comprehensive GWAS dataset, featuring 179 lipid species across 13 classes and 4 major categories—glycerolipids, glycerophospholipids, sphingolipids, and sterols—is depicted in Figure 1 (Supplementary Data Sheet 1) (17). These lipid species’ summary statistics are cataloged in the GWAS Catalog (https://www.ebi.ac.uk/gwas/) with accession numbers ranging from GCST90277238 to GCST90277416 (18). The dataset originates from the GeneRISK study, which includes 7,174 European participants (4,579 female and 2,595 male), recruited between 2015 and 2017, and aged 45–66. The primary goal of GeneRISK is to evaluate the effects of genetic risk information on cardiovascular disease (19). The original publication details the inclusion and exclusion criteria for participants, along with the population’s characteristics (19). Before blood sample collection for plasma, serum, and DNA extraction, participants observed a 10-hour fasting period. Collected biological and demographic data, alongside health, genetic, and lipidomic profiles, are stored at the THL Biobank (https://thl.fi/en/research-and-development/thl-biobank). Additionally, the summary-level statistics for diabetic neuropathy were retrieved from the R9 release of the FinnGen GWAS results, under the phenotypic classification “DM_NEUROPATHY”, with small overlap (<5%) with GWAS of lipid species, reducing the risk of bias (https://r9.finngen.fi) (20). The determination of diabetic neuropathy cases was anchored in the standardized International Classification of Diseases (ICD) coding system. The dataset included a total of 2,843 cases and 271,817 control individuals of European descent, with adjustments made for variables such as age, sex, genetic relatedness, genotyping batch, and the first 10 principal components. On the other hand, we also obtained the GWAS summary statistics for body mass index (BMI) and glycated hemoglobin (HbA1c) from the European cohorts, sourced respectively from the Genetic Investigation of ANthropometric Traits (GIANT) Consortium (https://portals.broadinstitute.org/collaboration/giant/index.php/GIANT_consortium) and the Meta-Analyses of Glucose and Insulin-related Traits Consortium (MAGIC) (https://magicinvestigators.org/) (21, 22).
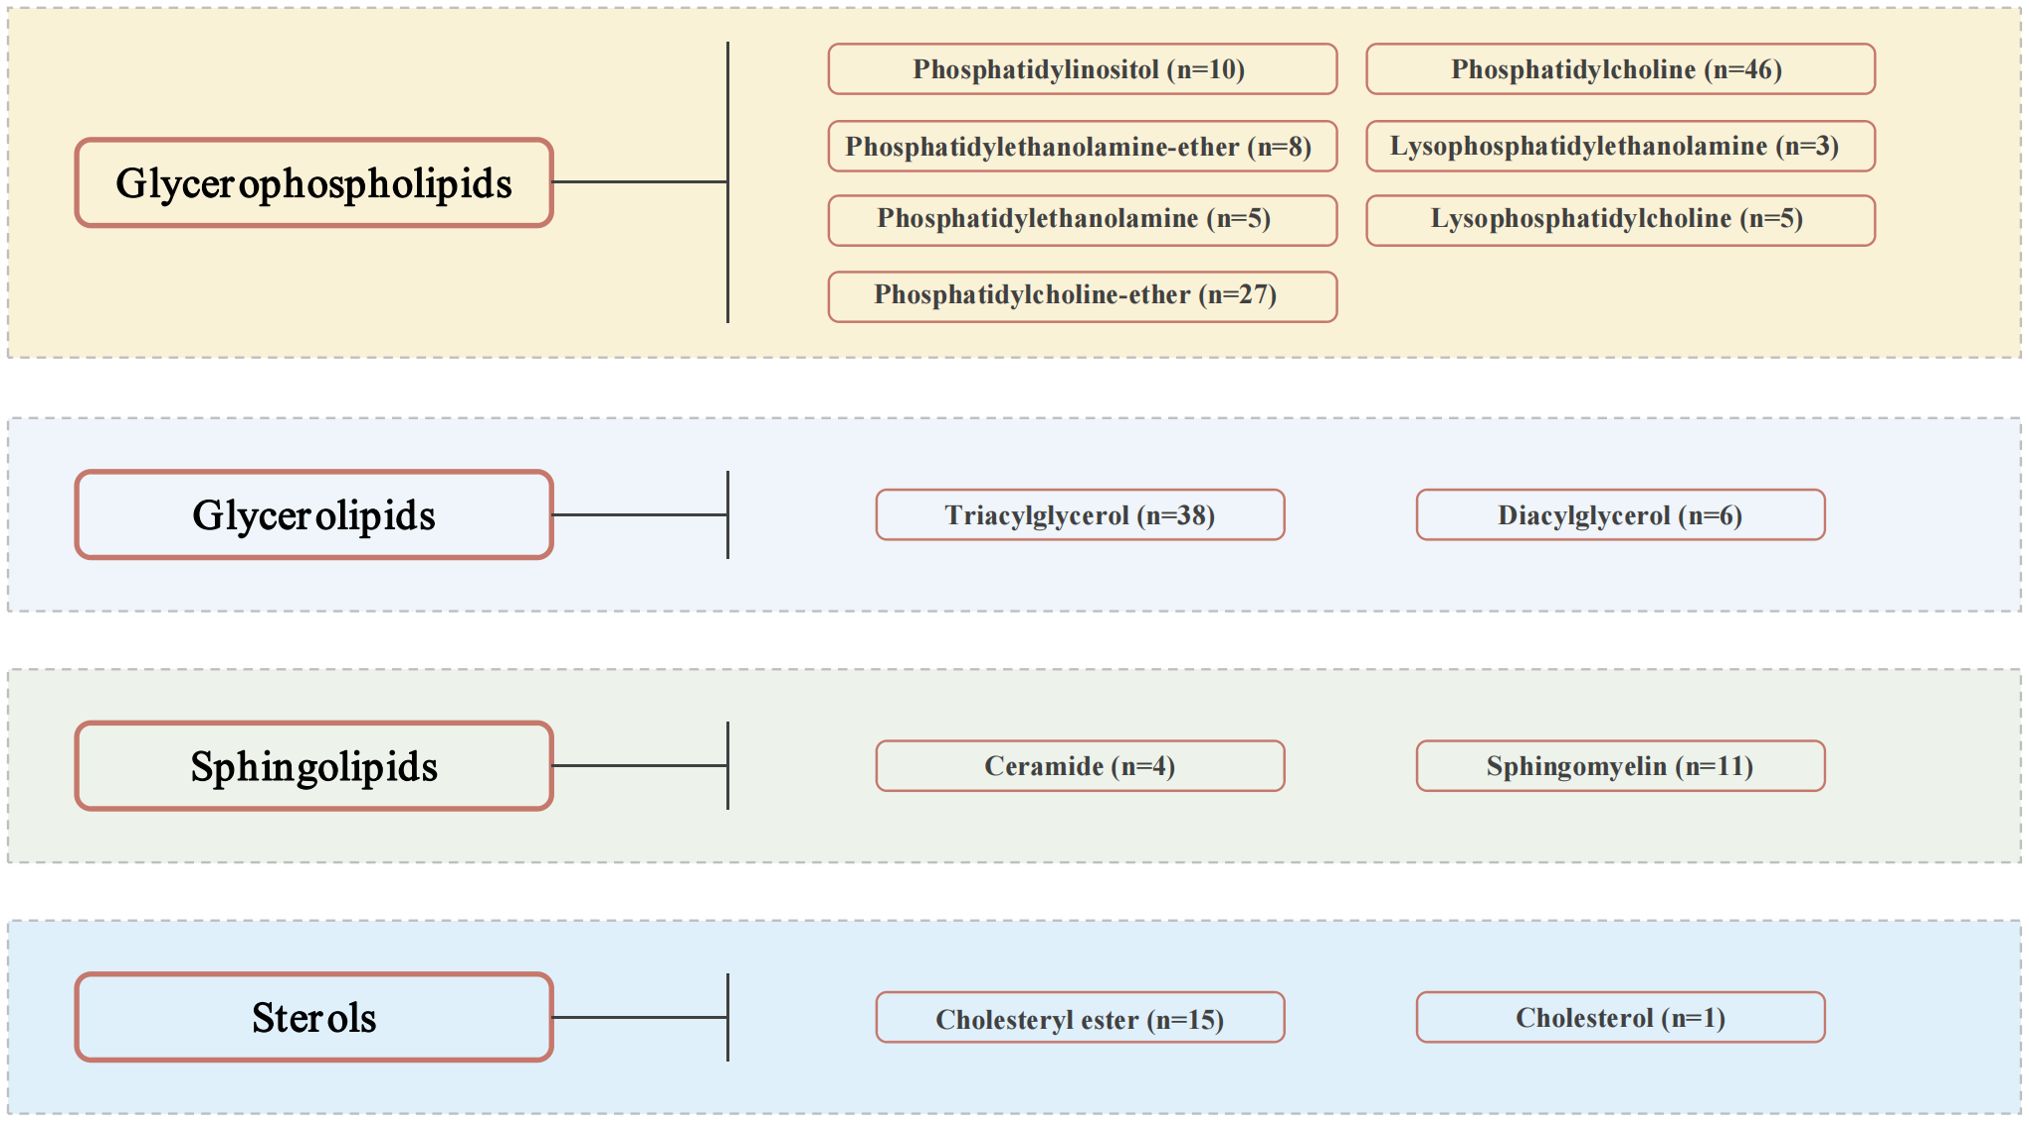
Figure 1. Lipid species.
2.2 Selection criteria for IVsThe MR analysis relied on three principal assumptions: (1) The IVs used in the study were significantly associated with lipidomes. (2) There was independence between the selected IVs and any confounding factors that could affect both lipidomes and diabetic neuropathy. (3) The IVs exerted an effect on diabetic neuropathy solely through their influence on lipidomes (23). To enable MR analysis across all lipid species, we adopted a significance threshold of P < 5e-6 for selecting genetic variants. This threshold is considered appropriate for MR studies when SNPs available for exposure are scarce (24, 25). To curtail the influence of correlated SNP associations, linkage disequilibrium (LD) scrutiny was performed using the European 1000 Genomes Project Phase 3 as a reference, with an r2 threshold of <0.001 and a clumping distance set at 10,000 kb. Palindromic SNPs were omitted to avoid inconsistencies in allelic interpretations that could skew causal inferences. SNPs with strong associations to the outcome were also discarded. The MR Steiger filter was applied to eliminate SNPs with an incorrect direction of effect. The IVs for lipid species were evaluated using the variance explained (R2) and the F-statistic, with those yielding an F-statistic below 10 being eliminated. The F-statistic is calculated using the formula R2(N-K-1)/[K(1-R2)], where R2 is the variance of the exposure explained by the IVs, N is the effective sample size, and K is the number of variants in the IV model. The PhenoScanner, an online resource, was utilized to identify and exclude SNPs linked with potential confounders (26). Finally, to evaluate the statistical power, we utilized the online tool available at https://shiny.cnsgenomics.com/mRnd/ (27).
2.3 MR analysisThe MR analysis was conducted using the R software (version 4.3.1), with specialized packages including “TwoSampleMR” (version 0.5.7), “MR-PRESSO” (version 1.0), and “MendelianRandomization” (version 0.9.0). A two-sample MR analysis was employed using five MR methods: inverse variance weighted (IVW), weighted median, simple mode, weighted mode, and MR-Egger regression. The primary method used was the fixed-effects IVW, which combined the Wald ratios from individual SNPs to provide a summary estimate. Additional methods served to validate the findings. Multiple testing was accounted for using False Discovery Rate (FDR) correction, with a significant association defined by an FDR of less than 0.05. Sensitivity analyses were performed to confirm the robustness of the MR results. Cochrane’s Q test assessed heterogeneity among IVs, with a P value below 0.05 indicating significant heterogeneity and necessitating the use of a random-effects IVW model instead of a fixed-effects model. The MR-Egger regression intercept was employed to detect potential horizontal pleiotropy, with significance set at a P value below 0.05. The MR-PRESSO global test was also used to assess horizontal pleiotropy, with outlier correction to mitigate its influence. The stability of the results was further examined using a leave-one-out strategy, where each SNP was sequentially excluded from the analysis, and the IVW method recalculated the effect. Finally, to explore the potential vertical pleiotropic pathways, we also performed multivariable MR (MVMR) analysis, including MVMR-IVW, MVMR-Egger, and MVMR-Median, to assess the direct causal impacts of these lipid species on diabetic neuropathy after adjusting for BMI and HbA1c levels. The parameter settings were consistent with univariable MR analysis.
3 Results3.1 Selection of instrumental variablesAfter thorough quality control measures, we have pinpointed 2,722 SNPs to serve as IVs in examining the causal relationship between lipid species and diabetic neuropathy. Each of these SNPs has an F-statistic value exceeding 10, which suggests that the potential for bias due to weak instruments is minimal. Detailed information for each SNP, encompassing the effect allele, other allele, β value, standard error (SE), and P value, is provided in Supplementary Data Sheet 2.
3.2 Results of MR analysis between lipid species and diabetic neuropathyA thorough MR analysis results of 179 lipid species and diabetic neuropathy was presented in Supplementary Data Sheet 3. Through the IVW analysis, we have identified 17 lipid species with potential causal relationship. Among these, 5 lipid species are identified as potential factors that may contribute to an elevated risk of diabetic neuropathy, whereas 12 lipid species seem to confer some protection against diabetic neuropathy, as illustrated in Figure 2. It is worth noting that phosphatidylcholine constitutes the majority.
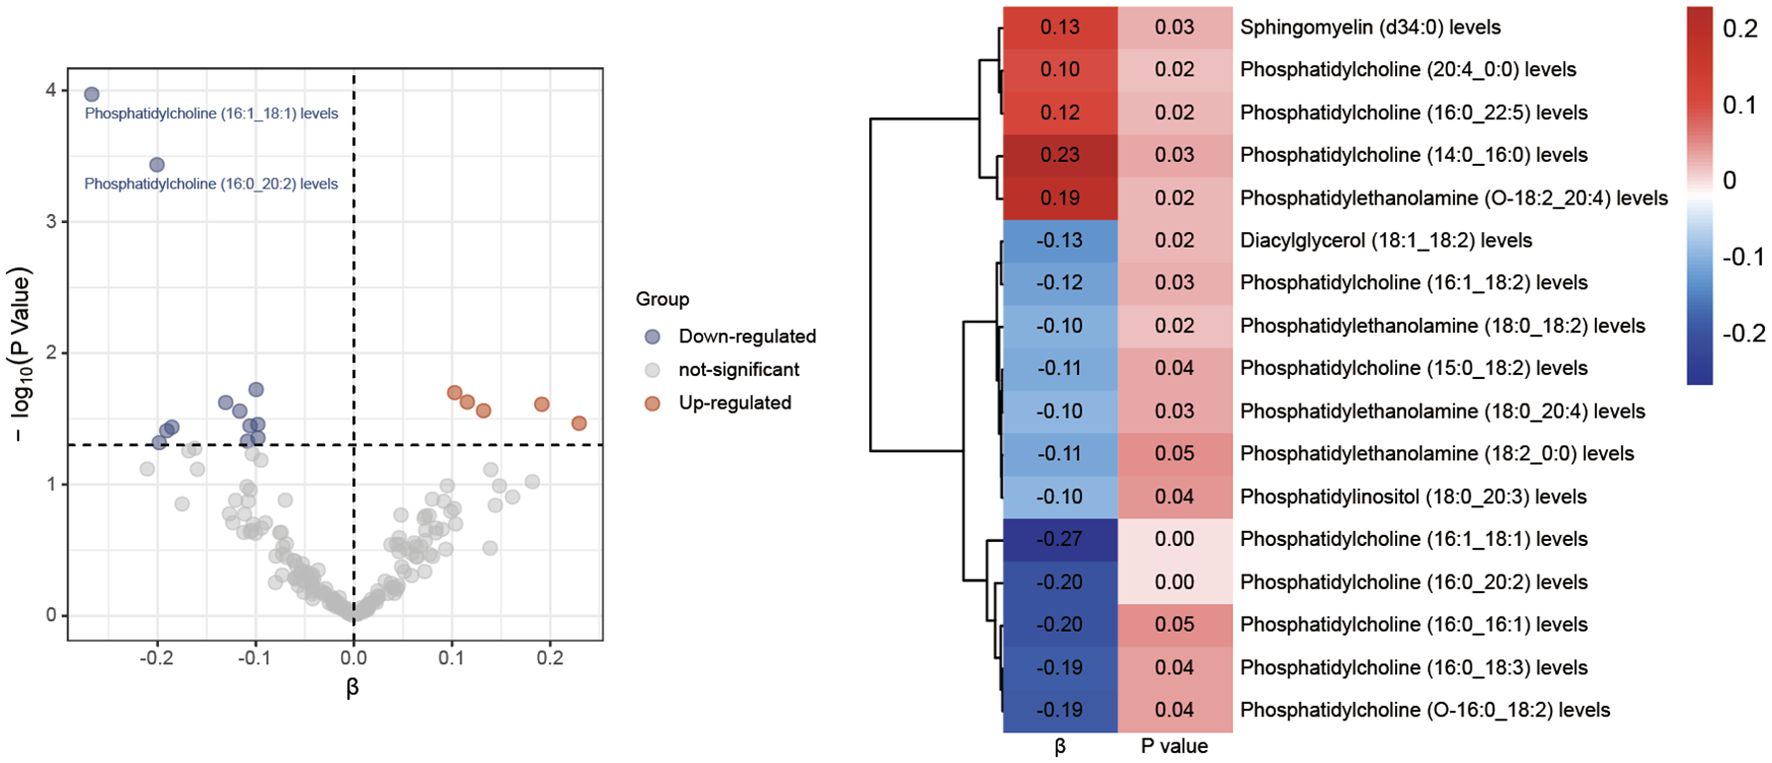
Figure 2. Volcano plots and heatmaps of differential lipid species.
Following the application of FDR correction, two lipid species have been identified that show a significant causal link with the risk of diabetic neuropathy, as illustrated in Figure 3. Individuals with genetically higher levels of phosphatidylcholine (16:0_20:2) had a 18% lower risk of developing diabetic neuropathy (OR = 0.82, 95%CI: 0.73-0.91; P < 0.001, FDR = 0.033). Similarly, higher genetically inferred levels of phosphatidylcholine (16:1_18:1) were associated with a 23% reduced risk of diabetic neuropathy (OR = 0.77, 95%CI: 0.67-0.88; P < 0.001, FDR = 0.019). Additional analyses using methods such as MR-Egger, weighted median, simple mode, and weighted mode have also consistently indicated a trend in these causal associations. Supplementary Data Sheet 4 presents scatterplots that clearly depict the causal connections between these lipid species and the risk of diabetic neuropathy.
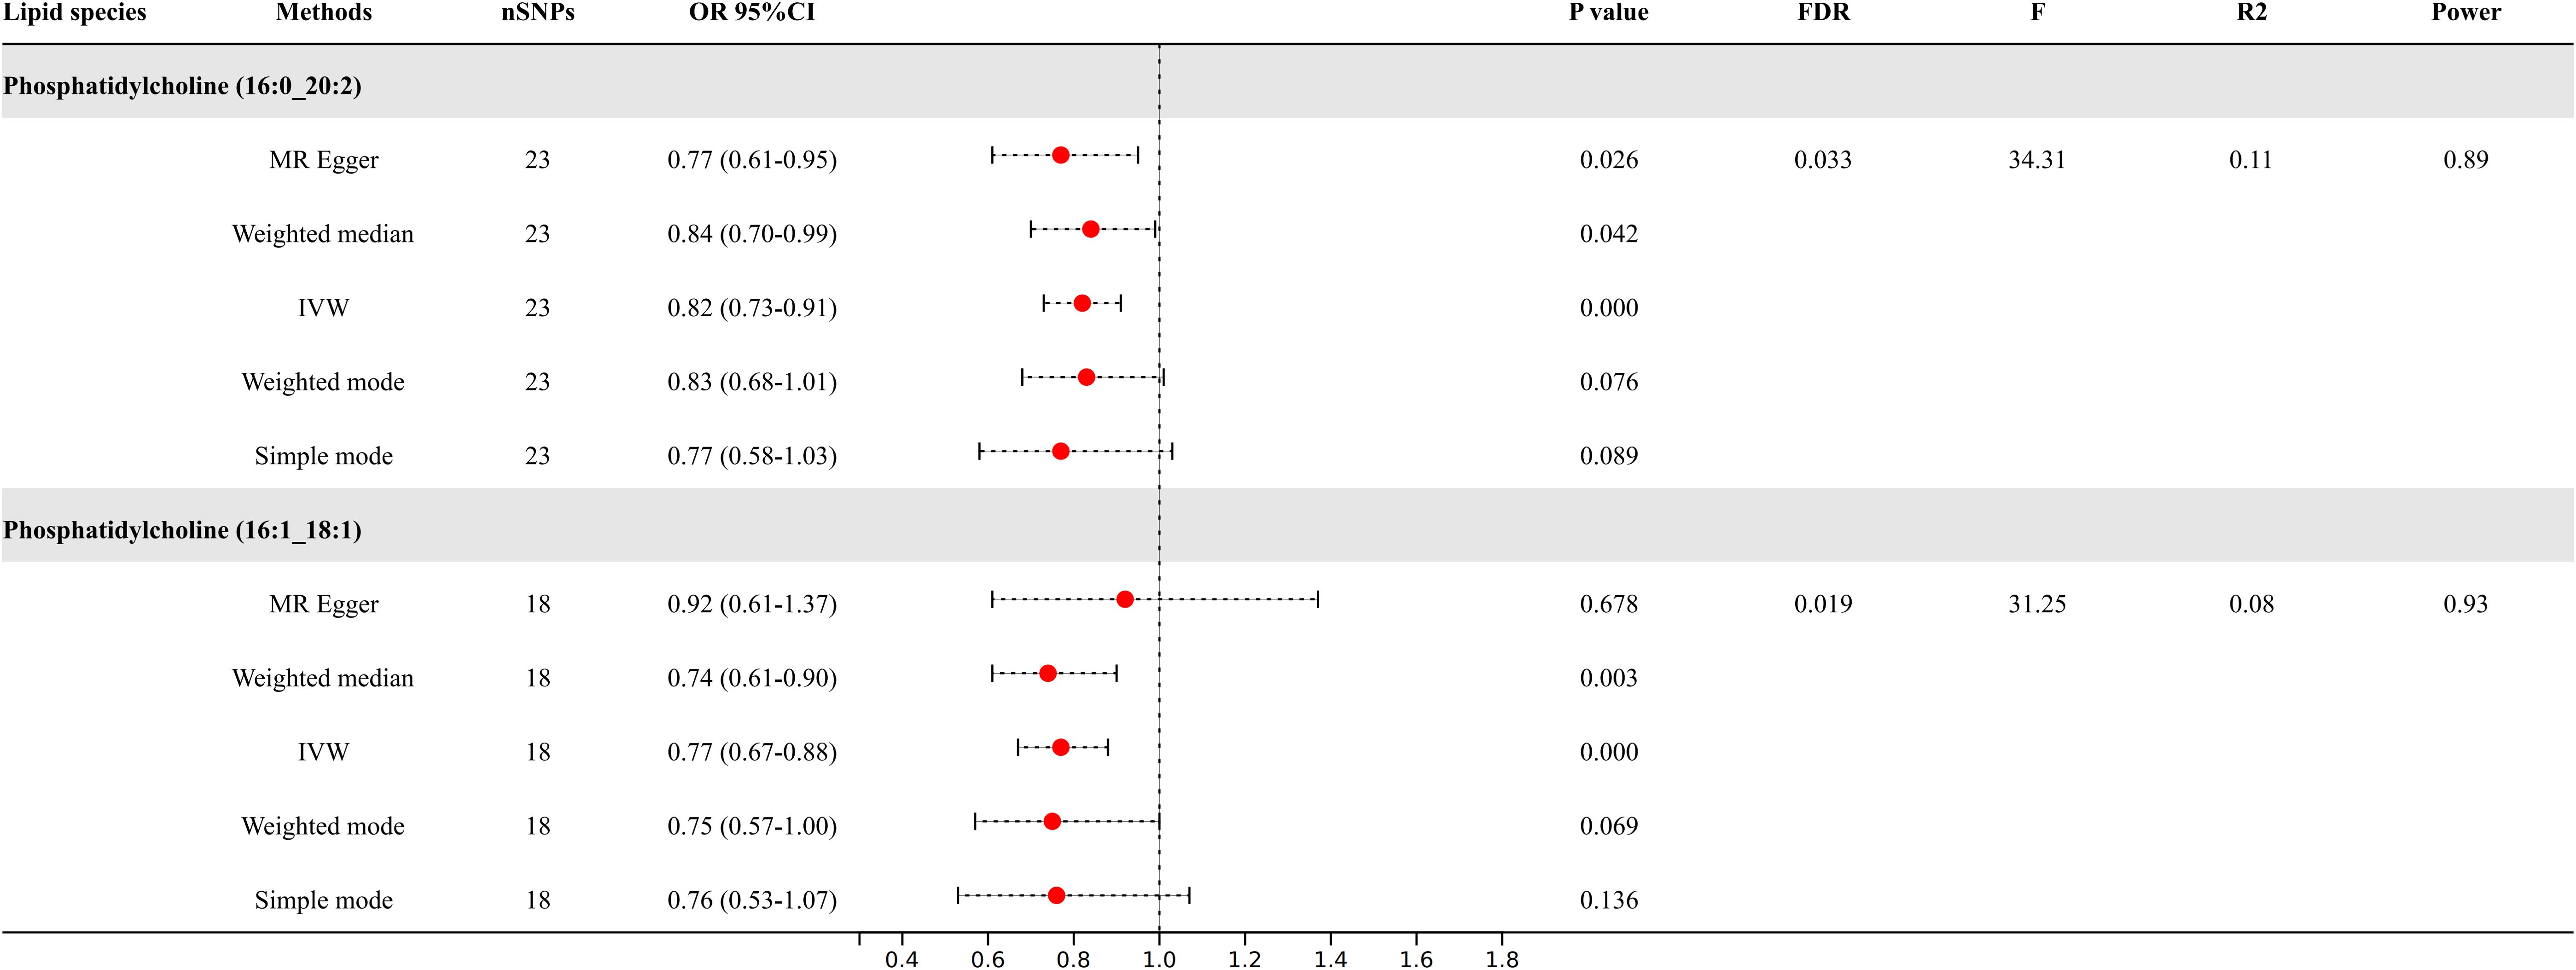
Figure 3. Causal relationships between two lipid species and diabetic neuropathy.
3.3 Sensitivity analysesSensitivity analyses presented in Table 1, including the Cochrane’s Q test, showed no heterogeneity among the genetic variants associated with two lipid species in predicting diabetic neuropathy. The MR-Egger regression intercept, used to assess the risk of bias from unbalanced horizontal pleiotropy, suggested no significant impact on our findings concerning diabetic neuropathy. The robustness of our MR results was further confirmed by the MR-PRESSO test, reinforcing the reliability of our conclusions. Supplementary Data Sheet 4 demonstrates that removing any single SNP in the leave-one-out analysis did not significantly change the MR estimates, affirming the IVW method as the preferred analytical strategy, given the lack of significant heterogeneity or unbalanced pleiotropy in explaining the variability in the risk of diabetic neuropathy (28–30).

Table 1. The results of sensitivity analyses.
3.4 MVMR analysisWe further applied a MVMR analysis to assess the direct impacts of these two lipids on diabetic neuropathy (Figure 4). According to the MVMR-IVW findings, the effect of genetically predicted phosphatidylcholine (16:1_18:1) (OR = 0.70, 95% CI: 0.51-0.98; P = 0.036) on diabetic neuropathy remained significant after adjusting for BMI and HbA1c. The consistent direction and magnitude of results from the MVMR-Egger and MVMR-Median models further support the causal inference (Supplementary Data Sheet 3).
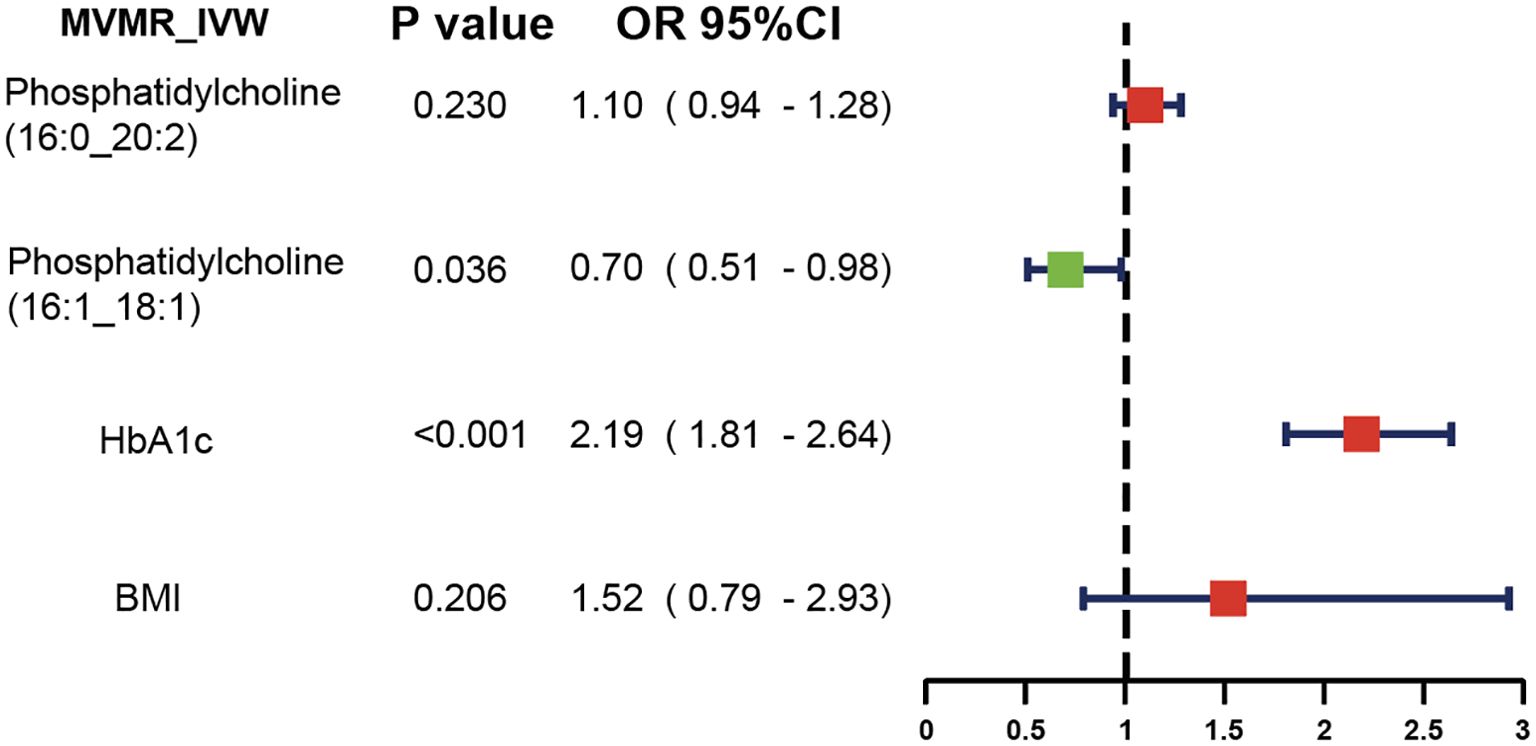
Figure 4. MVMR analysis results.
3.5 Results of MR analysis at genome-wide significance threshold (5e-8)After refining our criteria based on a genome-wide significance threshold of P <5e-8, we selected IVs for these two lipid species (Figure 5). Phosphatidylcholine (16:0_20:2) had six SNPs as IVs; phosphatidylcholine (16:1_18:1) had five SNPs as IVs. Further IVW analysis indicated that the increased levels of phosphatidylcholine (16:1_18:1) remain as the protective factors for diabetic neuropathy (OR = 0.80, 95% CI: 0.66-0.98; P = 0.032).
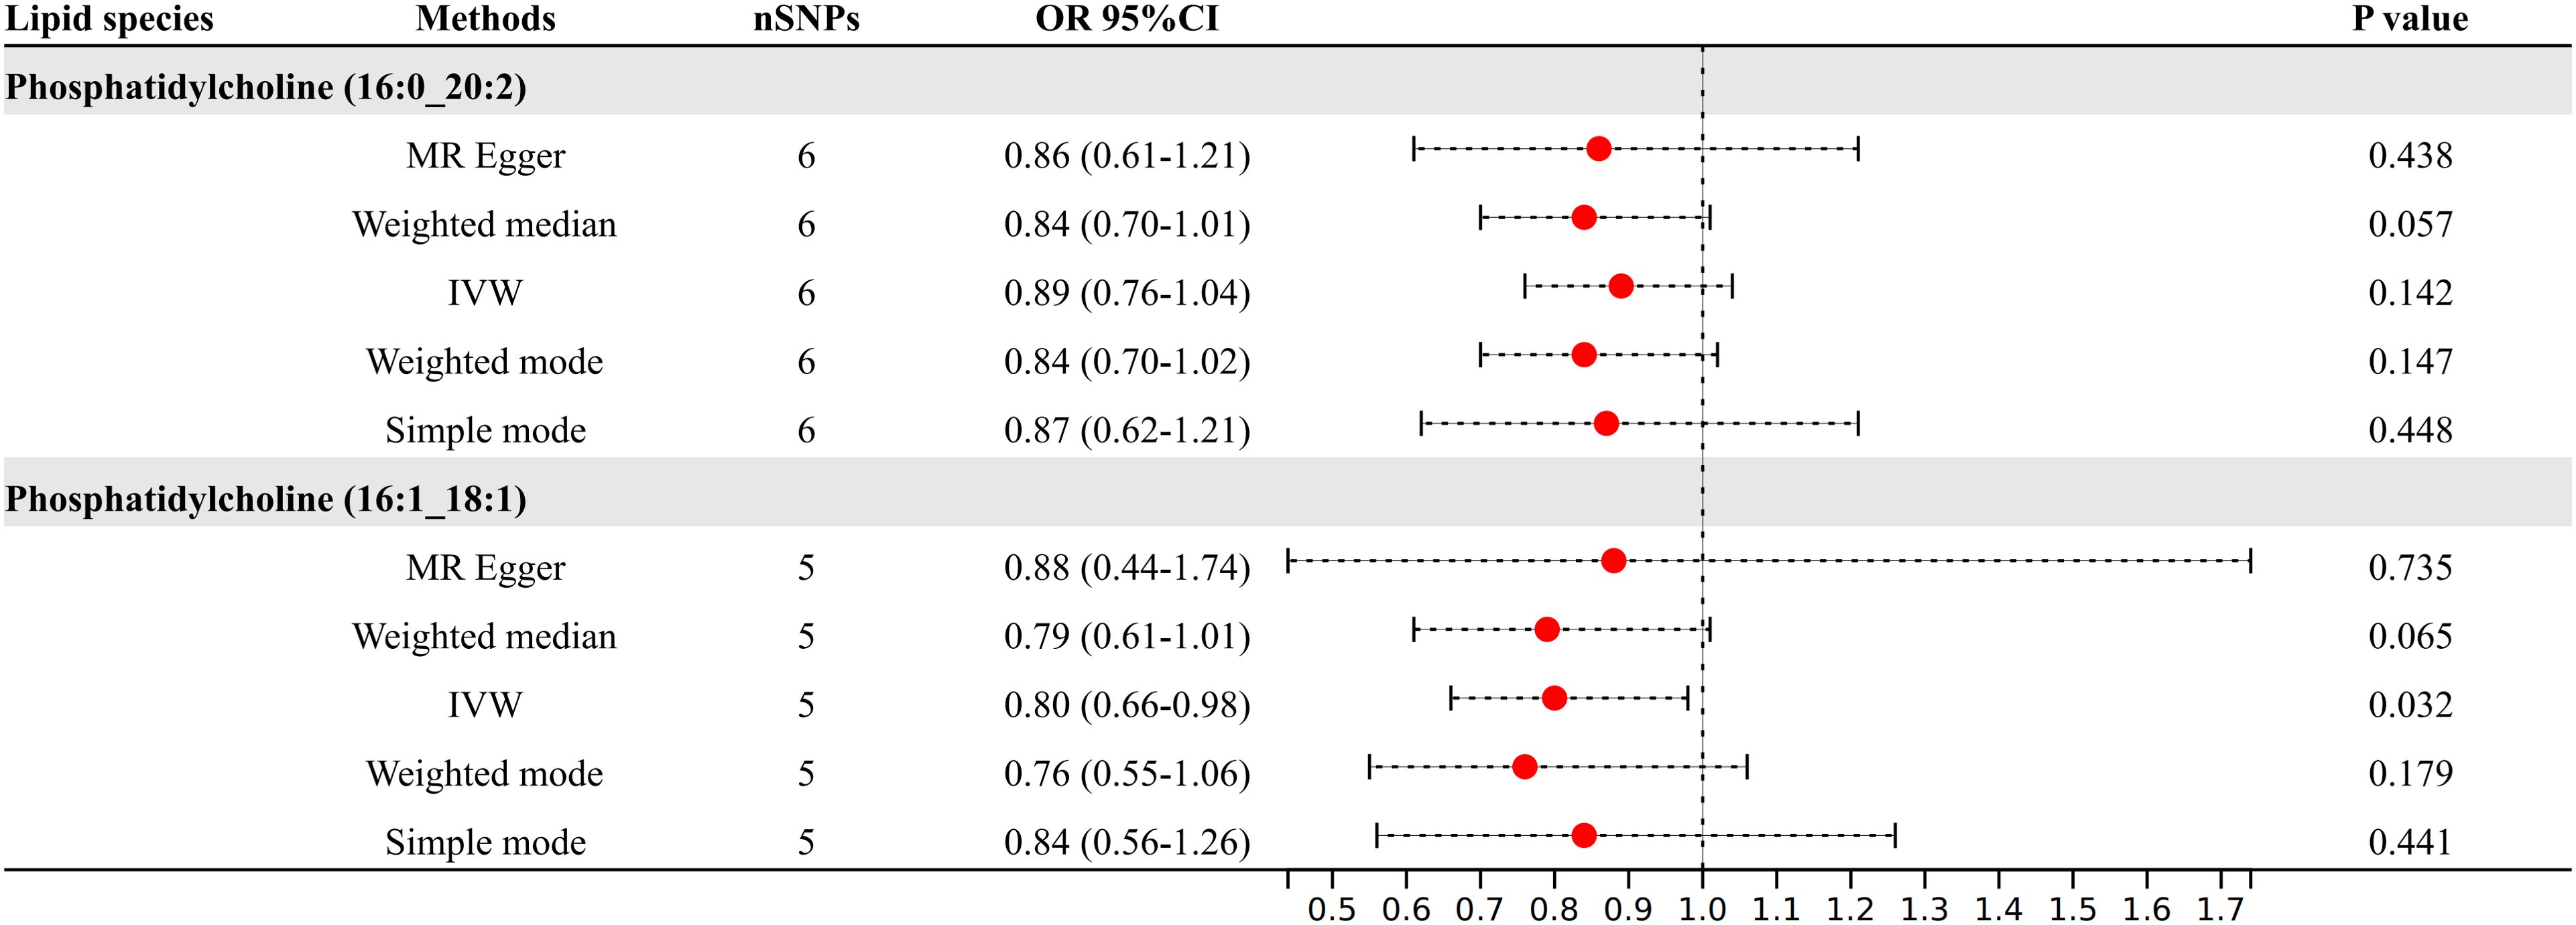
Figure 5. Results of MR analysis at genome-wide significance threshold (5e-8).
4 DiscussionIn our MR study, we explored the possible causal relationship between 179 lipid species and the risk of developing diabetic neuropathy. Our research identified 17 lipid species that appear to have potential causal links to the susceptibility to diabetic neuropathy.
Lipid metabolism plays a pivotal role in maintaining cellular membrane integrity, energy storage, signal transduction, and numerous other critical biological processes. The impact of dyslipidemia, which frequently co-occurs with diabetes, on the development of diabetic neuropathy is gaining recognition as a significant factor in its pathogenesis (4). Abnormal lipid metabolism heightens inflammation and oxidative stress which directly damage nerve fibers and contribute to neuropathy (31, 32). Lipid dysregulation can impair mitochondrial transport in sensory neurons and alter the generation of mitochondrial energy (33). Additionally, the integrity of Schwann cells, responsible for the myelination of peripheral nerves, relies on proper lipid metabolism (34). Several clinical studies have demonstrated significant alterations in the plasma lipidome of diabetic patients, which may be associated with the onset and progression of neuropathy. For instance, changes in specific lipid subclasses, such as phospholipids and sphingolipids, have been correlated with the severity of nerve damage (7, 35). Through the MR studies, we have enhanced the genetic evidence, identifying novel lipid species potentially linked to the susceptibility of diabetic neuropathy, along with their possible pathogenic and protective impacts. After adjusting for multiple testing, we have pinpointed two lipid species that demonstrate significant causal relationships. Phosphatidylcholine (16:0_20:2) and phosphatidylcholine (16:1_18:1) exhibit protective effects against diabetic neuropathy. Phosphatidylcholine is crucial for maintaining cell structure and function, regulating metabolism, facilitating signal transduction, and transporting lipids (36). Research indicates that a high intake of choline, particularly in the form of phosphatidylcholine, is associated with a reduced risk of type 2 diabetes (37). On the other hand, inhibiting the remodeling of phosphatidylcholine in adipose tissue can enhance insulin sensitivity (38). A prior investigation into the lipidomic profile associated with type 2 diabetic neuropathy also revealed that subjects with neuropathy exhibited a reduction in phosphatidylcholine levels, regardless of the fatty acid chain length and degree of saturation (7). Among participants experiencing peripheral neuropathy, alterations in phosphatidylcholine levels are also related to impaired mitochondrial β-oxidation (7). However, it is important to note that the potential physiological mechanisms by which these lipid species combat diabetic neuropathy are not yet clear and require further exploration. Additionally, the development of targeted therapeutic agents remains an area for future research.
This study’s conclusions come with certain limitations that could affect their interpretation. Firstly, the SNPs utilized fell short of the standard genome-wide significance threshold of 5e-8; instead, a more lenient criterion of 5e-6 was applied for IVs selection. Secondly, the study primarily included participants of European descent, reducing population variability, yet it underscores the need to confirm the MR findings in various ethnic populations for wider applicability. Thirdly, our data were sourced from registries, which may contain inconsistencies and errors, particularly in the classification of diabetic neuropathy. The FinnGen database does not offer a detailed classification of diabetic neuropathy, such as distinguishing painful diabetic neuropathy. Lastly, while MR analysis is valuable for inferring causal relationships, validating these findings through rigorous randomized controlled trials is essential.
5 ConclusionThis study revealed associations between specific lipid species and the risk of diabetic neuropathy, illuminating the potential of lipid-targeted therapies in clinical trials aimed at combating diabetic neuropathy.
Data availability statementThe original contributions presented in the study are included in the article/Supplementary Material, further inquiries can be directed to the corresponding author/s.
Ethics statementEthical review and approval was not required for the study on human participants in accordance with the local legislation and institutional requirements. Written informed consent from the patients/participants or patients/participants legal guardian/next of kin was not required to participate in this study in accordance with the national legislation and the institutional requirements.
Author contributionsZW: Writing – original draft, Writing – review & editing. ZL: Writing – original draft, Writing – review & editing. QY: Writing – original draft, Writing – review & editing. HQ: Writing – review & editing. YY: Writing – review & editing. ZZ: Writing – review & editing. XS: Supervision, Writing – review & editing.
FundingThe author(s) declare financial support was received for the research, authorship, and/or publication of this article. This study was supported by the Science and Technology Project of Changzhou Health Commission (WZ202226) and the 11th batch of Changzhou Science and Technology Program Project (CJ20243003).
AcknowledgmentsWe want to acknowledge the technical support provided by the Jiangsu University and the Xuzhou Medical University.
Conflict of interestThe authors declare that the research was conducted in the absence of any commercial or financial relationships that could be construed as a potential conflict of interest.
Publisher’s noteAll claims expressed in this article are solely those of the authors and do not necessarily represent those of their affiliated organizations, or those of the publisher, the editors and the reviewers. Any product that may be evaluated in this article, or claim that may be made by its manufacturer, is not guaranteed or endorsed by the publisher.
Supplementary materialThe Supplementary Material for this article can be found online at: https://www.frontiersin.org/articles/10.3389/fendo.2024.1398691/full#supplementary-material
Supplementary Data Sheet 1 | Lipid species.
Supplementary Data Sheet 2 | The detailed characteristics of IVs.
Supplementary Data Sheet 3 | MR analysis results.
Supplementary Data Sheet 4 | Scatter plots and leave-one-out method results.
References2. Hartemann A, Attal N, Bouhassira D, Dumont I, Gin H, Jeanne S, et al. Painful diabetic neuropathy: diagnosis and management. Diabetes Metab. (2011) 37:377–88. doi: 10.1016/j.diabet.2011.06.003
PubMed Abstract | Crossref Full Text | Google Scholar
3. Callaghan BC, Cheng HT, Stables CL, Smith AL, Feldman EL. Diabetic neuropathy: clinical manifestations and current treatments. Lancet Neurol. (2012) 11:521–34. doi: 10.1016/s1474-4422(12)70065-0
PubMed Abstract | Crossref Full Text | Google Scholar
4. Eid S, Sas KM, Abcouwer SF, Feldman EL, Gardner TW, Pennathur S, et al. New insights into the mechanisms of diabetic complications: role of lipids and lipid metabolism. Diabetologia. (2019) 62:1539–49. doi: 10.1007/s00125-019-4959-1
PubMed Abstract | Crossref Full Text | Google Scholar
5. Smith AG, Singleton JR. Obesity and hyperlipidemia are risk factors for early diabetic neuropathy. J Diabetes Complications. (2013) 27:436–42. doi: 10.1016/j.jdiacomp.2013.04.003
PubMed Abstract | Crossref Full Text | Google Scholar
6. Wiggin TD, Sullivan KA, Pop-Busui R, Amato A, Sima AA, Feldman EL. Elevated triglycerides correlate with progression of diabetic neuropathy. Diabetes. (2009) 58:1634–40. doi: 10.2337/db08-1771
PubMed Abstract | Crossref Full Text | Google Scholar
7. Afshinnia F, Reynolds EL, Rajendiran TM, Soni T, Byun J, Savelieff MG, et al. Serum lipidomic determinants of human diabetic neuropathy in type 2 diabetes. Ann Clin Transl Neurol. (2022) 9:1392–404. doi: 10.1002/acn3.51639
PubMed Abstract | Crossref Full Text | Google Scholar
9. Cai Z, Yang Y, Zhang J. A systematic review and meta-analysis of the serum lipid profile in prediction of diabetic neuropathy. Sci Rep. (2021) 11:499. doi: 10.1038/s41598-020-79276-0
PubMed Abstract | Crossref Full Text | Google Scholar
12. Skrivankova VW, Richmond RC, Woolf BAR, Davies NM, Swanson SA, VanderWeele TJ, et al. Strengthening the reporting of observational studies in epidemiology using mendelian randomisation (STROBE-MR): explanation and elaboration. Bmj. (2021), 375n2233. doi: 10.1136/bmj.n2233
PubMed Abstract | Crossref Full Text | Google Scholar
13. Ma R, Chen C, Wang Z, Guo H, Zhang W. Causal relationship between plasma lipidome and four types of pancreatitis: a bidirectional Mendelian randomization study. Front Endocrinol (Lausanne). (2024), 151415474. doi: 10.3389/fendo.2024.1415474
PubMed Abstract | Crossref Full Text | Google Scholar
14. Fang Y, Yuan X, Zhang Q, Liu J, Yao Q, Ye X. Causality between sarcopenia and diabetic neuropathy. Front Endocrinol (Lausanne). (2024), 151428835. doi: 10.3389/fendo.2024.1428835
PubMed Abstract | Crossref Full Text | Google Scholar
15. Li R, Peng L, Deng D, Li G, Wu S. Potential causal association between aspirin use and erectile dysfunction in European population: a Mendelian randomization study. Front Endocrinol (Lausanne). (2023), 141329847. doi: 10.3389/fendo.2023.1329847
PubMed Abstract | Crossref Full Text | Google Scholar
16. Sekula P, Del Greco MF, Pattaro C, Köttgen A. Mendelian randomization as an approach to assess causality using observational data. J Am Soc Nephrol. (2016) 27:3253–65. doi: 10.1681/asn.2016010098
PubMed Abstract | Crossref Full Text | Google Scholar
17. Ottensmann L, Tabassum R, Ruotsalainen SE, Gerl MJ, Klose C, Widén E, et al. Genome-wide association analysis of plasma lipidome identifies 495 genetic associations. Nat Commun. (2023) 14:6934. doi: 10.1038/s41467-023-42532-8
PubMed Abstract | Crossref Full Text | Google Scholar
18. Buniello A, MacArthur JAL, Cerezo M, Harris LW, Hayhurst J, Malangone C, et al. The NHGRI-EBI GWAS Catalog of published genome-wide association studies, targeted arrays and summary statistics 2019. Nucleic Acids Res. (2019) 47:D1005–d1012. doi: 10.1093/nar/gky1120
PubMed Abstract | Crossref Full Text | Google Scholar
19. Widén E, Junna N, Ruotsalainen S, Surakka I, Mars N, Ripatti P, et al. How communicating polygenic and clinical risk for atherosclerotic cardiovascular disease impacts health behavior: an observational follow-up study. Circ Genom Precis Med. (2022) 15:e003459. doi: 10.1161/circgen.121.003459
PubMed Abstract | Crossref Full Text | Google Scholar
20. Kurki MI, Karjalainen J, Palta P, Sipilä TP, Kristiansson K, Donner KM, et al. FinnGen provides genetic insights from a well-phenotyped isolated population. Nature. (2023) 613:508–18. doi: 10.1038/s41586-022-05473-8
PubMed Abstract | Crossref Full Text | Google Scholar
21. Wheeler E, Leong A, Liu CT, Hivert MF, Strawbridge RJ, Podmore C, et al. Impact of common genetic determinants of Hemoglobin A1c on type 2 diabetes risk and diagnosis in ancestrally diverse populations: A transethnic genome-wide meta-analysis. PloS Med. (2017) 14:e1002383. doi: 10.1371/journal.pmed.1002383
PubMed Abstract | Crossref Full Text | Google Scholar
22. Locke AE, Kahali B, Berndt SI, Justice AE, Pers TH, Day FR, et al. Genetic studies of body mass index yield new insights for obesity biology. Nature. (2015) 518:197–206. doi: 10.1038/nature14177
PubMed Abstract | Crossref Full Text | Google Scholar
23. Lawlor DA, Harbord RM, Sterne JA, Timpson N, Davey Smith G. Mendelian randomization: using genes as instruments for making causal inferences in epidemiology. Stat Med. (2008) 27:1133–63. doi: 10.1002/sim.3034
PubMed Abstract | Crossref Full Text | Google Scholar
24. Gu Y, Jin Q, Hu J, Wang X, Yu W, Wang Z, et al. Causality of genetically determined metabolites and metabolic pathways on osteoarthritis: a two-sample mendelian randomization study. J Transl Med. (2023) 21:357. doi: 10.1186/s12967-023-04165-9
PubMed Abstract | Crossref Full Text | Google Scholar
25. Wang Z, Zhang L, Lu B, Sun H, Zhong S. Causal relationships between circulating inflammatory cytokines and diabetic neuropathy: A Mendelian Randomization study. Cytokine. (2024), 177156548. doi: 10.1016/j.cyto.2024.156548
PubMed Abstract | Crossref Full Text | Google Scholar
26. Kamat MA, Blackshaw JA, Young R, Surendran P, Burgess S, Danesh J, et al. PhenoScanner V2: an expanded tool for searching human genotype-phenotype associations. Bioinformatics. (2019) 35:4851–3. doi: 10.1093/bioinformatics/btz469
PubMed Abstract | Crossref Full Text | Google Scholar
29. Burgess S, Bowden J, Fall T, Ingelsson E, Thompson SG. Sensitivity analyses for robust causal inference from mendelian randomization analyses with multiple genetic variants. Epidemiology. (2017) 28:30–42. doi: 10.1097/ede.0000000000000559
PubMed Abstract | Crossref Full Text | Google Scholar
30. Burgess S, Butterworth A, Thompson SG. Mendelian randomization analysis with multiple genetic variants using summarized data. Genet Epidemiol. (2013) 37:658–65. doi: 10.1002/gepi.21758
PubMed Abstract | Crossref Full Text | Google Scholar
31. McGregor BA, Eid S, Rumora AE, Murdock B, Guo K, de Anda-Jáuregui G, et al. Conserved transcriptional signatures in human and murine diabetic peripheral neuropathy. Sci Rep. (2018) 8:17678. doi: 10.1038/s41598-018-36098-5
PubMed Abstract | Crossref Full Text | Google Scholar
32. Ozay R, Uzar E, Aktas A, Uyar ME, Gürer B, Evliyaoglu O, et al. The role of oxidative stress and inflammatory response in high-fat diet induced peripheral neuropathy. J Chem Neuroanat. (2014), 5551–7. doi: 10.1016/j.jchemneu.2013.12.003
PubMed Abstract | Crossref Full Text | Google Scholar
33. Kwon B, Lee HK, Querfurth HW. Oleate prevents palmitate-induced mitochondrial dysfunction, insulin resistance and inflammatory signaling in neuronal cells. Biochim Biophys Acta. (2014) 1843:1402–13. doi: 10.1016/j.bbamcr.2014.04.004
PubMed Abstract | Crossref Full Text | Google Scholar
34. Viader A, Sasaki Y, Kim S, Strickland A, Workman CS, Yang K, et al. Aberrant Schwann cell lipid metabolism linked to mitochondrial deficits leads to axon degeneration and neuropathy. Neuron. (2013) 77:886–98. doi: 10.1016/j.neuron.2013.01.012
PubMed Abstract | Crossref Full Text | Google Scholar
35. Song L, Han R, Yin H, Li J, Zhang Y, Wang J, et al. Sphingolipid metabolism plays a key role in diabetic peripheral neuropathy. Metabolomics. (2022) 18:32. doi: 10.1007/s11306-022-01879-7
PubMed Abstract | Crossref Full Text | Google Scholar
36. van der Veen JN, Kennelly JP, Wan S, Vance JE, Vance DE, Jacobs RL. The critical role of phosphatidylcholine and phosphatidylethanolamine metabolism in health and disease. Biochim Biophys Acta Biomembr. (2017) 1859:1558–72. doi: 10.1016/j.bbamem.2017.04.006
PubMed Abstract | Crossref Full Text | Google Scholar
37. Virtanen JK, Tuomainen TP, Voutilainen S. Dietary intake of choline and phosphatidylcholine and risk of type 2 diabetes in men: The Kuopio Ischaemic Heart Disease Risk Factor Study. Eur J Nutr. (2020) 59:3857–61. doi: 10.1007/s00394-020-02223-2
PubMed Abstract | Crossref Full Text | Google Scholar
38. He M, Li Z, Tung VSK, Pan M, Han X, Evgrafov O, et al. Inhibiting phosphatidylcholine remodeling in adipose tissue increases insulin sensitivity. Diabetes. (2023) 72:1547–59. doi: 10.2337/db23-0317
留言 (0)