Neuromorphic systems reproducing neuronal circuits and functions of the brain have attracted growing attention of researchers from different fields of science and technology. Spiking neuronal networks employ memristive devices to implement neuronal and synaptic components. Engineering of spiking neuronal networks and corresponding processing functions nowadays look as one of the most intriguing directions in neuromorphic system development (Makarov et al., 2022; Dalgaty et al., 2024).
Memristors are electronic components based on the resistive switching (RS) effect (Chua, 2019), possessing at least two stable states that differ in their own resistance—a state with high (HRS) and low (LRS) electrical resistance. Devices utilizing this effect retain the acquired information in the form of resistance, the evolution of which is characterized by the restructuring of the atomic structure in thin insulating (dielectric) layers of nanometer-scale thickness under the stimulus of an electric field. Employing memristors as elements in electronic circuits have opened wide possibilities of designing non-linear oscillators with a variety of complex dynamical modes including chaos and multistability (Minati et al., 2020; Gokyildirim et al., 2022; Wang et al., 2022; Boudjerida et al., 2023; Chen et al., 2019; Spagnolo et al., 2022; Corinto and Forti, 2017). Possibility of complex non-linear dynamics and unique (biomimmetic) electro-physical properties with energetic efficiency has made memristors to be the most promising candidates for constructing biologically plausible neuron models and neuromorphic computations (John et al., 2022; Indiveri et al., 2013; Pisarev et al., 2020; Shchanikov et al., 2021). Specifically, memristors were used to simulate the dynamics of voltage-gated ion channels of neuron membrane. Implementation of rather simple potassium channels was discussed in Najem et al. (2018), Thomas (2013), Yi et al. (2018), and Gonzalez-Raya et al. (2020). More complex Hodgkin-Huxley neuron model employing both sodium and potassium channels was realized in Lv et al. (2016), Jeong et al. (2016), Sah et al. (2014), Gonzalez-Raya et al. (2019), and Hu and Liu (2019). Our recent study was reported on memristor-based implementation of FitzHugh—Nagumo (FHN) spiking neuron model that can reproduce both excitable and oscillatory neuronal dynamics (Kipelkin et al., 2023).
Synaptic plasticity is one of the fundamental properties of living neuronal systems responsible for basic cognitive functions of the brain such as learning and memory (Sun et al., 2024; Kotaleski and Blackwell, 2010). Signals are transmitted between neurons via special biological devices called synapses. The strength of the synaptic connection is defined by complex chemical molecular transformations that occurs in both presynaptic (transmitter) neuron and postsynaptic (receiver) neuron (Lynch, 2004). Specifically, long-term changes in the connection strength are localized mostly in the postsynaptic neuron. When a spike is transmitted, the postsynaptic membrane, similarly to basic neuronal excitability, opens its ion channels and ions, particularly Na+ and K+, cross the membrane generating postsynaptic potentials (Nadler, 2012). Interestingly, that is, the synapse is transmitting a series of; each consequent spike may induce voltage responses of variable amplitudes. If each next spike generates a stronger response of increasing amplitude, then the synaptic potentiation takes place (Vyazovskiy et al., 2008). So, the synaptic connection amplifies its strength. In the opposite case, there is a synaptic depression. The type of synaptic plasticity is defined by the neuron type and also by the dynamical characteristics of the transmitted signals, for example, frequency of spike and/or relative phase of the spike occurrences.
For neuron models describing ion channels, information processing and encoding can be described by the dynamics of the action potential. However, due to the stochasticity and sensitivity of memristors, which affect dynamic processes, more in-depth mathematical and experimental studies are needed to control the behavior of devices and prevent undesirable effects through operational control.
Based on the above sources and existing problems, we investigated a 3D model of neuronal excitability, implemented by two memristor-based FHN generator circuit. We employed memristive devices with different electrode compositions Au/Ta/ZrO2(Y2O3)/Pt/Ti/glass and Au/Ru/ZrO2(Y2O3)/Pt/Ti/glass to mimic ion channels. By extending the equations and modifying the scheme proposed earlier (Kipelkin et al., 2023), we presented mathematical and experimental investigation of the model. Experimental data obtained as a result of hardware measurements qualitatively confirm the computational modeling. We also analyzed how the electronic neuron responded on a spike sequence. Similarly to a postsynaptic neuron in real neuronal networks, our memristor-based device demonstrated synaptic potentiation when each next spike induced the response of growing amplitude.
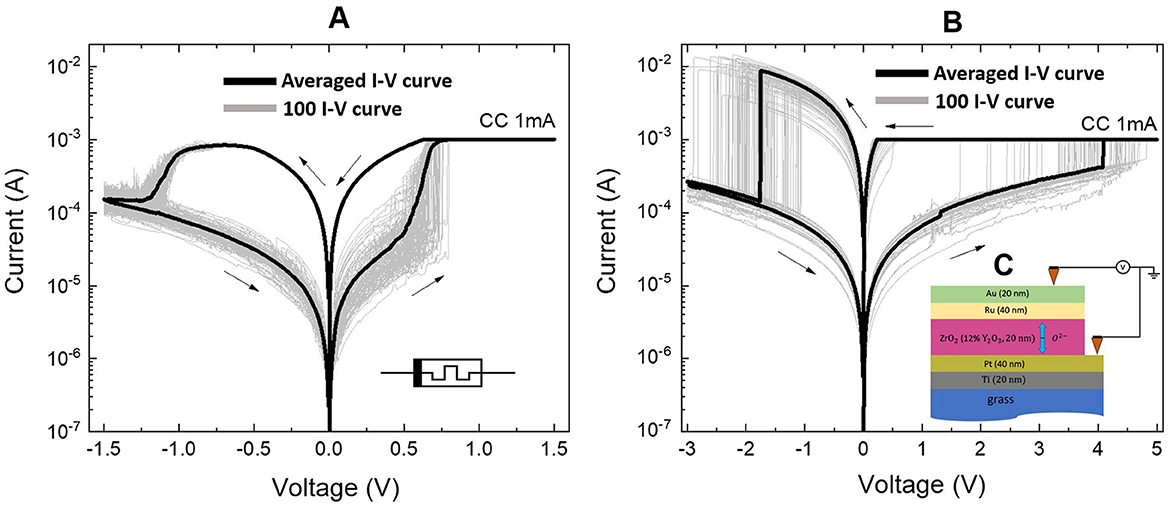
2 Materials and methods 2.1 Memristive devicesTo simulate neuron ion channels, we used two non-volatile memristive devices of the bipolar switching type having different electrodes. Figure 1 illustrates the experimental current-voltage characteristics on a logarithmic scale along the ordinate axis of the multistable devices Au/Ta/ZrO2(Y2O3)/Pt/Ti/glass and Au/Ru/ZrO2(Y2O3)/Pt/Ti/glass, respectively, with different metal contact interfaces that demonstrate reproducible bipolar switches between the LRS and HRS states.

Figure 1. Experimental current-voltage characteristics of non-volatile devices. (A) Au/Ta/ZrO2(Y2O3)/Pt/Ti/glass, (B) Au/Ru/ZrO2(Y2O3)/Pt/Ti/glass. Arrows show the voltage sweep. The number of characteristics taken was 100 pcs. (C) Schematic cross section of the Au(20nm)/Ta(40nm) or Ru(40nm)/ZrO2(Y)(20nm)/Pt(40nm)/Ti(20nm)/grass memristive device.
To create memristive devices on a glass substrate, Torr International's 2G1-1G2-EB4-TH1 vacuum film deposition system and standard photolithography equipment were used. ZrO2 films were deposited using high-frequency magnetron sputtering from a target made from a mixture of ZrO2 (0.88 shares) and Y2O3 (0.12 shares) powders at a temperature of 250 °C. The metal electrode layers were then applied using magnetron sputter at direct current and 200 °C. The ZrO2 film has a thickness of 20 nm. The top electrode was a 20 nm Au film with a 40 nm Ta or Ru sublayer. The bottom electrode was Pt film with a thickness of 40 nm and Ti sublayer, that is, 20 nm thick. Detailed information on the technological processes can be found at Khan et al. (2019), Gorshkov et al. (2016), Yildirim and Pachter (2019), Mikhaylov et al. (2015), Mikhaylov et al. (2020), and Baranova et al. (2020).
Identification of electrical parameters in continuous and pulse modes was carried out using an Agilent B1500A semiconductor analyzer with a sweeping rate of 7.25 V/s. Connections to contact pads of the device were carried out using the Everbeing EB-6 probe station. We used current compliance (CC) of 1 mA. We took all measurements at room temperature and normal atmospheric pressure. The voltage offset on the device corresponds to the potential difference between the top electrode (Au) and the grounded bottom electrode (Pt).
We used Ru and Ta top electrodes with differences in resistive switching parameters in our memristive devices. In particular, the RHRS of the memristive devices on the Ru and Ta electrode corresponds to ≈10 − 12 kΩ. The RLRS values ≈700 Ω for Ta and ≈200 Ω for Ru. The process of RS is closely linked to the diverse materials used for the top electrode, the mechanisms of switching, and the nature of electronic transport. Various metals exhibit different oxygen affinities, leading to distinct redox reaction processes and the formation of defects in metal oxides. We can estimate the approximate values of switching dynamic ranges using the values above for the electrode using Ta: RHRSRLRS = 20 and for the electrode using Ru: RHRSRLRS = 60. Our experiments indicate that memristive devices have different resistance values in different resistive states. This range of values can vary from cycle to cycle as well as from device to device. The variation in the characteristics of memristive devices was taken into account as follows. In our experiments, we observed a random value of the switching voltage (Vset) during initial measurements. This observed value was applied to the device in subsequent measurements. Each time a switching cycle occurred, we introduced a random perturbation to the Vset threshold. The distribution of this random variable can be modeled using a normal distribution. This approach is also applicable to other relevant parameters, including the switching voltages, memristor resistances in the HRS and LRS, as well as the potential barriers for ion and electron transport. At the same time, the devices had reproducible characteristics for neuromorphic computing, possessing stable and gradual resistive switching of the bipolar type (Gorshkov et al., 2014; Hu et al., 2024). The corresponding voltage changes as SET and RESET transitions were given with interval values for the electrode based on Ru: Vset = 4 V, Vreset = −2 V, and for electrode based on Ta: Vset = 1 V, Vreset = −1.4 V. Statistical data on the memristive devices under study are presented in Supplementary material.
2.2 Mathematical modelThe dynamics of neurons was determined by a modified FitzHugh-Nagumo (mFHN) model. This model is based on the assumption that ion currents associated with nerve pulse conduction can be divided into fast-acting and slow-acting components. These components are responsible for generation, adhesion, and rest, respectively, of the membrane. The mathematical description of the model is introduced by the equations obtained and investigated in Binczak et al. (2006):
{u·=F1,2(u)-ϑ+Wexϑ·=ε·[g(u)-ϑ-η], (1)The fast variable u describes the membrane voltage of the neuron. ϑ qualitatively describes the dynamics of slow (potassium) currents. Wex is an external pulse current with a certain duty cycle (Q) and amplitude (Aex), respectively. Function g(u) is a piecewise linear function determined by the polarity of the voltage on the neuron membrane, g(u) = α·u for u < 0 and g(u) = β·u if u≥ 0, where α=0.78 and β=1.86 are the constants that determine the dynamics of the recovery ϑ. ε is the parameter that controls the level of depolarization and therefore determines the dynamic model of the neuron, and η is a constant parameter. We have added a detailed description of the derivation of Equation 1 and placed it in the Supplementary material.
F1,2(u)=γ1·I1·d1+γ2·I2·d2 (2)The function presented in Equation 2 is a non-linear function defined as the sum of the product of the current in the memristor and its active load d (load resistance). Coefficient γ1, 2 is determined from the method of the least squares approximation of current-voltage characteristic and having the dimension V−1. The indices 1 and 2 denote Au/Ta/ZrO2(Y2O3)/Pt/Ti/glass and Au/Ru/ZrO2(Y2O3)/Pt/Ti/glass devices, respectively. The current itself consists of the product of the current density and the fixed area of the electrodes (Sel) of the memristor, I1 = j1·Sel.
Mathematical expressions for the current densities were used in the following form (Chua and Kang, 1976) (Equations 3–5).
j1,2=x1,2·jlin1,2+(1-x1,2)·jnonlin1,2 (3) {jlin1,2=|u|·σ1,2-1jnonlin1,2=|u|·B·exp(b1,2·|u|-Eb1,2) (4) x·1,2={A · exp(−Em1,2−δ1,2 · u)·f1,2(x1,2,p),u>Vset0,Vreset<u<Vset−A · exp(−Em1,2+δ1,2 · u)·f1,2(x1,2,p),u<Vreset (5)where j1, 2 is the current density going through the memristor, which consists of a linear component (jlin1, 2) and a non-linear component (jnonlin1, 2), σ1, 2 is a specific resistance, u is external voltage acting on the input of device, and B, A, b1, 2, δ1, 2 are constants determined from experimental data (from the approximation of the current-voltage characteristics of the corresponding device). Energy values Eb1, 2, Em1, 2 denote effective barriers for electron jumps and oxygen ion hopping, respectively. State variable x1, 2 has a probabilistic nature describing how current density can randomly change in the range from 0 to 1. When x1, 2 = 1, the memristive device is highly conducting (low resistance state). When x1, 2 = 0, the memristive device is in the high resistance state, and the change in this quantity (x1, 2) corresponds to the drift velocity of ions in the dielectric layer, exponentially dependent on the applied voltage to the device.
To correctly implement (Equation 5), we introduced the window function using (Joglekar and Wolf, 2009).
f1,2(x1,2,p)=1-(2·x1,2-1)2p (6)The proposed window function restricts the dynamic (Equation 6) in an acceptable range, satisfying the boundary conditions, f(0) = f(1) = 0 for all positive values of p. Equations describing the variable x1, 2 derive from the diverse internal processes of filament development in our memristive device. A detailed description of parameters is presented in Mishchenko et al. (2022), and the values are in Supplementary material.
Summarizing Equations 1–6 we obtained the following 3D system of differential equations:
u·=|u|∑1,2γ1,2·[x1,2·σ1,2-1+(1-x1,2)·B·exp(b1,2·|u|-Eb1,2)]·Sel1,2·d1,2-ϑ+Wexϑ·=ε·[g(u)-ϑ-η] (7) x·1,2={A · exp(−Em1,2−δ1,2 · u)·f1,2(x1,2,p),u>Vset0,Vreset<u<Vset−A · exp(−Em1,2+δ1,2 · u)·f1,2(x1,2,p),u<VresetIntegration of Equation 7 was implemented using a built-in MATLAB solver of ordinary differential equations based on the Runge—Kutt (RK4) algorithm with the following fixed parameters: integration error: ψ = 10−10; constant step: s = 0.02 and initial conditions (-0.65, 0, 0.00001, 0.00001).
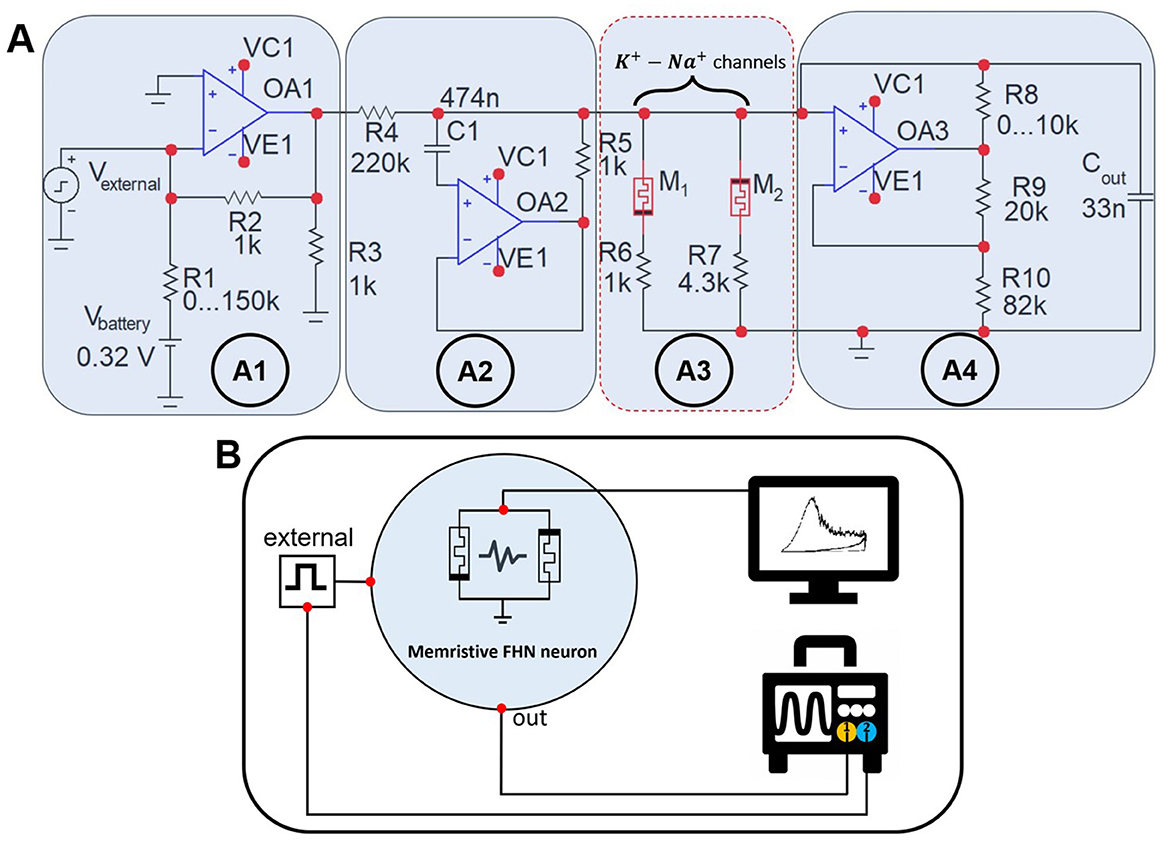
2.3 Experimental modelFigure 2A illustrates experimental circuit simulating a postsynaptic neuron modeled by mFHN (Gerasimova et al., 2021; Kipelkin et al., 2023; Binczak et al., 2006). The circuit includes a counter-parallel connection of two memristors M1 and M2 simulating Na+ and K+ ion channels of neuronal membrane, respectively (Figure 2A3). The input block (Figure 2A1) of the circuit consists of a power source, which is a 1.5 Volt battery (Vbattery), and a potentiometer R1 ∈ [0;150] kΩ, which is used to switch dynamic modes. The input block also includes a source of external stimulus (Vexternal), created by the KEYSIGHT 33600A random pulse generator, which has a 14-bit capacity and sampling frequency of 120 MHz. Next, the signal propagates through the circuit and enters the coupling RL generator (Figure 2A2) implemented with the MC1458L operational amplifier with a resistance value of R = R5 and inductance L = C1R4R5. The output block (Figure 2A4) includes a capacitor Cout, which creates a voltage drop across the channels, and an adjustable variable resistor R8 ∈ [0;10] kΩ which changes the amplitude and duration of oscillations at the output. The entire process of signal flow can be considered as the accumulation of potential on the neuron membrane.

Figure 2. System for conducting an experiment on non-volatile memristive devices. (A) The experimental mFHN model circuit is based on memristive devices that simulate sodium and potassium ion channels in biological neurons. Memristor M1 is based on the Au/Ta/ZrO2(Y2O3)/Pt/Ti/glass device, and M2 describes the Au/Ru/ZrO2(Y2O3)/Pt/Ti/glass memristive device. R6 and R7 are load resistances for the corresponding memristive devices. (B) Schematic illustration of experimental setup recording signals from the memristive neuron electronic circuit. Processing and visualization of the recorded transient processes is carried out using the OriginPro 2019b software.
The block diagram of the experimental setup is shown in Figure 2B. Agilent B1500a analyzer is used to analyze the characteristics of memristive devices. The signal generated by the analog neuronal oscillator was recorded on the Cout capacitor and then read using 1 channel by an ALFATEC S7-334 digital three-channel oscilloscope with a sampling rate of 5 GHz. The inbound signal from the external stimulus was displayed in channel 2.
3 Results 3.1 Simulations of the mathematical modelFirst, we consider how the memristive neuron modeled by Equation 7 responded to stimulation pulses of different amplitudes (Aex). Figures 3A, B illustrate the results of computational modeling. Increasing of the pulse amplitude upper certain threshold led to generation of the response pulse. The pulse shape was qualitatively similar to neuronal excitability mediated by sodium and potassium transmembrane currents.

Figure 3. Results of computational modeling on the response of a memristive neuron to external impulse stimulation. (A) Membrane potential response to a single subthreshold, threshold, and suprathreshold signals. The threshold value of the membrane potential is −30mV. (B) Type of stimulation of the membrane potential. The dotted line indicates the pulse generation threshold. Pulse duration in the first three cases was 11 ms. Model parameters: ε = 0.009, η = 0.1. (C) Bifurcation diagram illustrating the excitable, bistable, and self-oscillatory modes of the memristive neuron, filmed during forward and reverse passage of external stimulus. The diagram on the left shows an example of a trajectory on the plane (u, ϑ) for the excited mode and on the right for the self-oscillating mode.
With prolonged external stimulus, the neuron switched to a self-oscillatory mode and generated a periodic sequence of pulses, qualitatively similar to regular oscillations of the membrane potential in real neurons of the 3rd excitability class (Izhikevich, 2007). Note that the model dynamics demonstrates the qualitative match of the main characteristics and properties of the pulses with biological action potential properties, including the existence of a threshold leading to an "all-or-none" response, as well as the presence of refractory periods.
In addition, the amplitude of the external impact determines one of the three possible dynamic modes of the memristive neuron including excitable, bistable, or oscillatory ones. According to the bifurcation diagram in Figure 3C, a region of bistability emerges in the dynamics of the memristive neuron (Equation 7). Bistability, in this case, means that, depending on the initial conditions of the system, for example, (u0,ϑ0,x10,x20), the neuron can either maintain a resting potential or generate a periodic sequence of spikes. In other words, in the phase space of the dynamical system given by Equation 7, a stable fixed point coexists with a stable limit cycle. We found that for the set of parameters used, the bistability region appeared in the range of voltages 120 μV ≤ Aex ≤ 200 μV. The excitable mode, in which the resting potential is stable, and when the threshold is exceeded, one or more pulses are generated is realized at Aex < 120 μV. For Aex> 200 μV, the resting potential loses stability and self-oscillations emerge in the system via a subcritical bifurcation scenario. Corresponding stable limit cycle attracts all trajectories representing only one attractor. Bifurcation point Aex=120 μV corresponds to the fold limit cycle bifurcation. In the case of increasing voltage, the 2-fold limit cycle is divided into robust stable and unstable limit cycles. The unstable limit cycle disappears at Aex=200 μV via subcritical Andronov-Hopf bifurcation. According to Izhikevich's classification, our neural model can be defined as a bistable resonator (Moehlis, 2008).
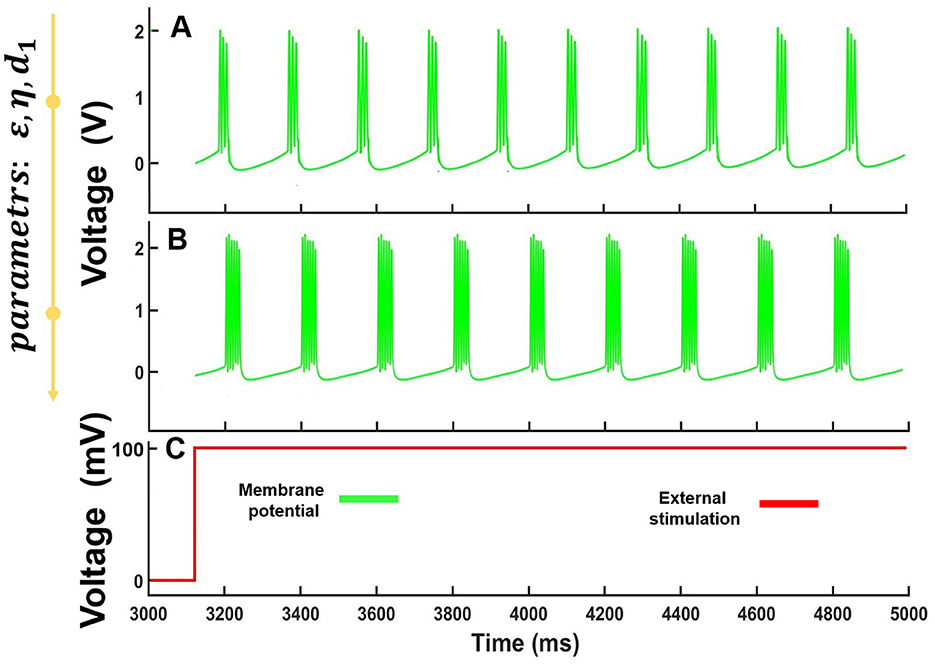
Interestingly, the specific parameter range of the model demonstrated spike-burst oscillations. In the case of ε∈ [0.001;0.006], η∈ [0.06;0.08], d1∈ [840;985] and for fixed d2 = 4300, we observed the spike-burst dynamics with a different number of spikes in the burst as illustrated in Figure 4.

Figure 4. Computational modeling of Equation 7 for a constant voltage level stimulation. (A) Bursts composed of three spikes for ε= 0.0028 , η = 0.068 and d1= 875, (B) Bursts composed of six spikes for ε= 0.0049 , η = 0.074 and d1 = 927. The fixed value is d2= 4,300. (C) The form of stimulating the form of stimulating voltage.
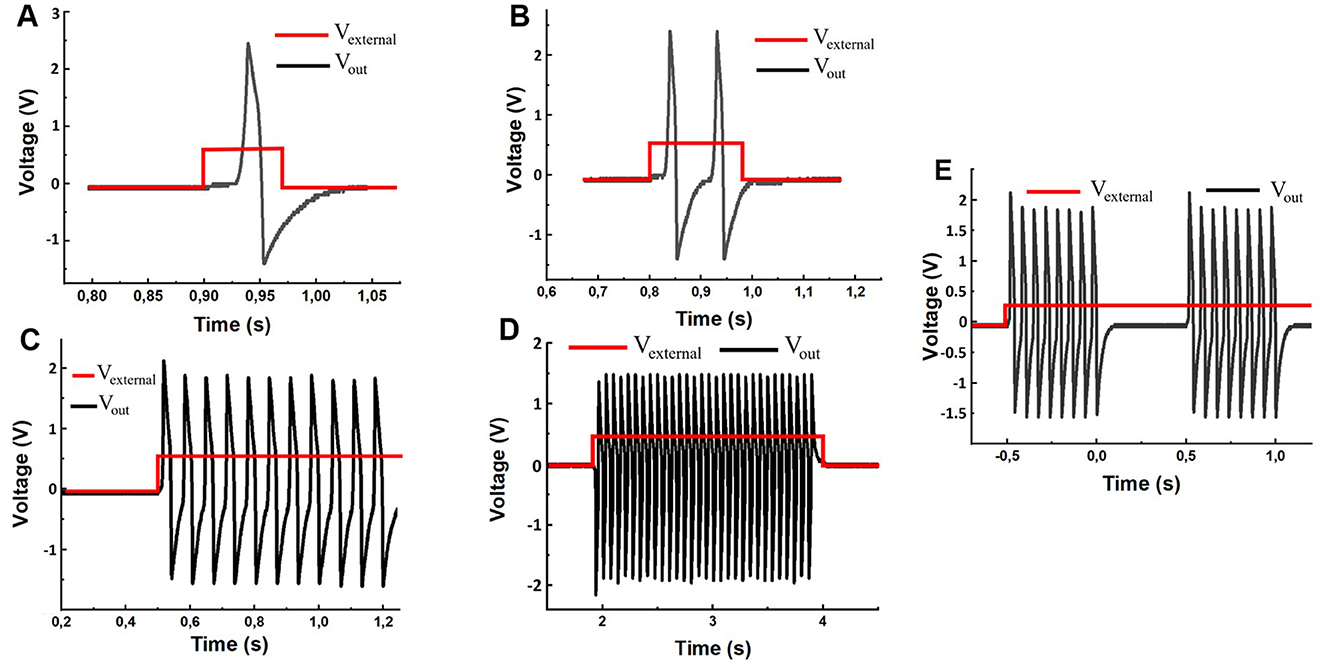
3.2 Electronic circuit experimental studyAfter checking the performance of the generator (using the system in Figure 2), by calibration, we applied an external unipolar time-dependent effect to the input and changed the values of the R1 potentiometers in the range from 0 to 100 kΩ and R8 from 0 to 5 kΩ. As a result, we observed a variety of output signals similar to typical biological neuron responses including both single and multiple activities with a certain number of spikes, as shown in Figure 5.

Figure 5. Electronic circuit waveforms driven by stimulation square pulses with a given duration and a fixed amplitude of 120 millivolts. (A) Single pulse response to a short stimulation of 0.074-s duration. (B) Two consequent spikes in response to the 0.18-s stimulus. (C) Multiple spike responses to the 2-s stimulus. (D) The constant level depolarization yields a periodic spike sequence. (E) The experimentally spontaneous spike-burst oscillations for R1 = 121 kΩ, R8 = 7.8 kΩ and 120 mV external stimulation voltage.
The mechanisms of spike generation in the memristor-based circuit (Figure 2A) can be qualitatively described similarly to the processes of depolarization, repolarization, and hyperpolarization as follows (Figure 6).
留言 (0)