Cell culture
PBMCs were kept in RPMI 1640 medium with stable glutamine, 2.0 g/L NaHCO3 (PAN Biotech, Germany), and 13% heat-inactivated fetal bovine serum (FBS Premium, PAN-Biotech, Germany). For counting, cells were mixed with an equal volume of Tuerk's solution (Thermo Fisher Scientific, USA) and counted using a Neubauer hemocytometer.
For experiments involving vesicle isolation from the cell culture supernatant, vesicle-free FBS was used. Therefore, FBS was ultrafiltered using an ultrafiltration unit (Amicon Ultra-15, Merck Millipore, USA) with a molecular weight cut-off of 100 kDa.
Human skin fibroblasts 1BR3 (ECACC 90011801, Sigma-Aldrich, USA) were grown in Eagle's minimum essential medium (EMEM, Sigma-Aldrich, USA) supplemented with 15% FBS, 2 mM L-Glutamine (Gibco, Thermo Fisher Scientific, USA) and 1% Non Essential Amino Acids (Gibco, Thermo Fisher Scientific, USA). MRC-5 fetal lung fibroblasts were grown in Dulbeccos Modified Eagle Medium (DMEM)/F-12 (1:1) (Gibco, Thermo Fisher Scientific, USA) with 10% FBS. Immortalized oral keratinocytes OKF6 TERT-1 were grown in keratinocyte serum-free medium supplemented with 25 μg/ml bovine pituitary extract and 0.2 ng/ml epidermal growth factor (Gibco, Thermo Fisher Scientific, USA). Human coronary fibroblasts (HCF) were grown in Fibroblast Growth Medium 3 (Promo Cell, Germany). Human umbilical vein endothelial cells (HUVEC) were grown in endothelial cell growth medium 2 (PromoCell, Germany). Human coronary artery endothelial cells (HCAECs) were grown in MesoEndo Cell Growth Medium (Cell Applications, USA). The oral squamous cell carcinoma cell lines Cal33 and BHY were grown in DMEM high glucose (PAN-Biotech, Germany) supplemented with 10% FBS and 2 mM L-Glutamine. All cells were grown at 37 °C and 95% humidity with 5% CO2 for PBMCs, 1BR3, MRC-5, OKF6 TERT-1, HCF, HUVEC and HCAECs or 10% CO2 for BHY and Cal33. All cell lines (except 1BR3) were provided by the Institute of Radiation Biology (ISB) at the Helmholtz Center Munich (HMGU) and tested regularly for mycoplasma contamination.
For passaging adherent cell lines, cells were washed once with Dulbecco’s Phosphate Buffer Saline (DPBS, Biowest, France), detached at 37 °C using TrypLE Express enzymes (Thermo Fisher Scientific, USA), and centrifuged at 200 g to remove the enzymes before they were resuspended in growth medium.
Irradiation
All samples were irradiated in flasks, plates, or blood tubes in horizontal positions using the X-ray cabinet RS225 (Xstrahl Limited, UK). Irradiation was performed with a tube voltage of 195 kV, 10 mA current, and a 0.5 mm copper filter plus an additional 2.09 mm flattening aluminum filter at room temperature (RT). The distance of the samples from the source was set to 500 mm to provide a dose rate of 0.52 Gy/min.
Blood sample collection and PBMC isolation
Whole blood from 12 healthy donors (5 male, 7 female) aged between 20 and 63 was collected in 7.5 mL sterile Lithium-Heparin S-monovettes (#01.1604.001, Sarstedt, Germany). Blood samples taken on different days from randomly selected individuals from these 12 donors were defined as biological replicates. All blood samples were directly irradiated ex vivo in monovettes immediately before PBMCs were isolated.
PBMCs were isolated immediately following irradiation by density gradient centrifugation using Histopaque-1077 (Sigma-Aldrich, USA). 15 mL of Histopaque-1077 were added to a 50 mL Leucosep tube (Greiner Bio-one, Austria) and centrifuged for 1 min at 1000 g. Whole blood was diluted in DPBS (1:1) and layered onto the porous barrier before centrifugation without a brake at 400 g for 30 min at 20 °C. Following centrifugation, the plasma layer was discarded, and the buffy coat, which contains the PBMCs, was collected with a pasteur pipette and transferred to a tube containing 10 mL of RPMI 1640 medium. To minimize residual platelet contamination, PBMCs were washed in RPMI 1640 and centrifuged twice at 250 g for 10 min. For vesicle analysis, cells were adjusted to a concentration of 106 cells/mL in RPMI 1640 medium supplemented with 13% vesicle-free FBS (see section Cell culture) and incubated for 24–96 h. To harvest PBMCs, cells were centrifuged at 300 g for 10 min and washed twice with DPBS before the pellet was stored at -80 °C.
Ataxia Telangiectasia Mutated (ATM) Inhibitor treatment
The ATM inhibitor KU-60019 (Sigma-Aldrich, USA) was prepared in a concentration of 30 mM in dimethyl sulfoxide (DMSO, PAN-Biotech, Germany) and stored in aliquots at -20 °C until use. Before treatment, PBMCs were diluted to 106 cells/mL in vesicle-free medium. Either 3 µM KU-60019 or 0.01% DMSO as a solvent control was added to the PBMCs. The cells were incubated at 37 °C for 1 h and subsequently exposed to 2 Gy or sham irradiation.
Isolation of EVs
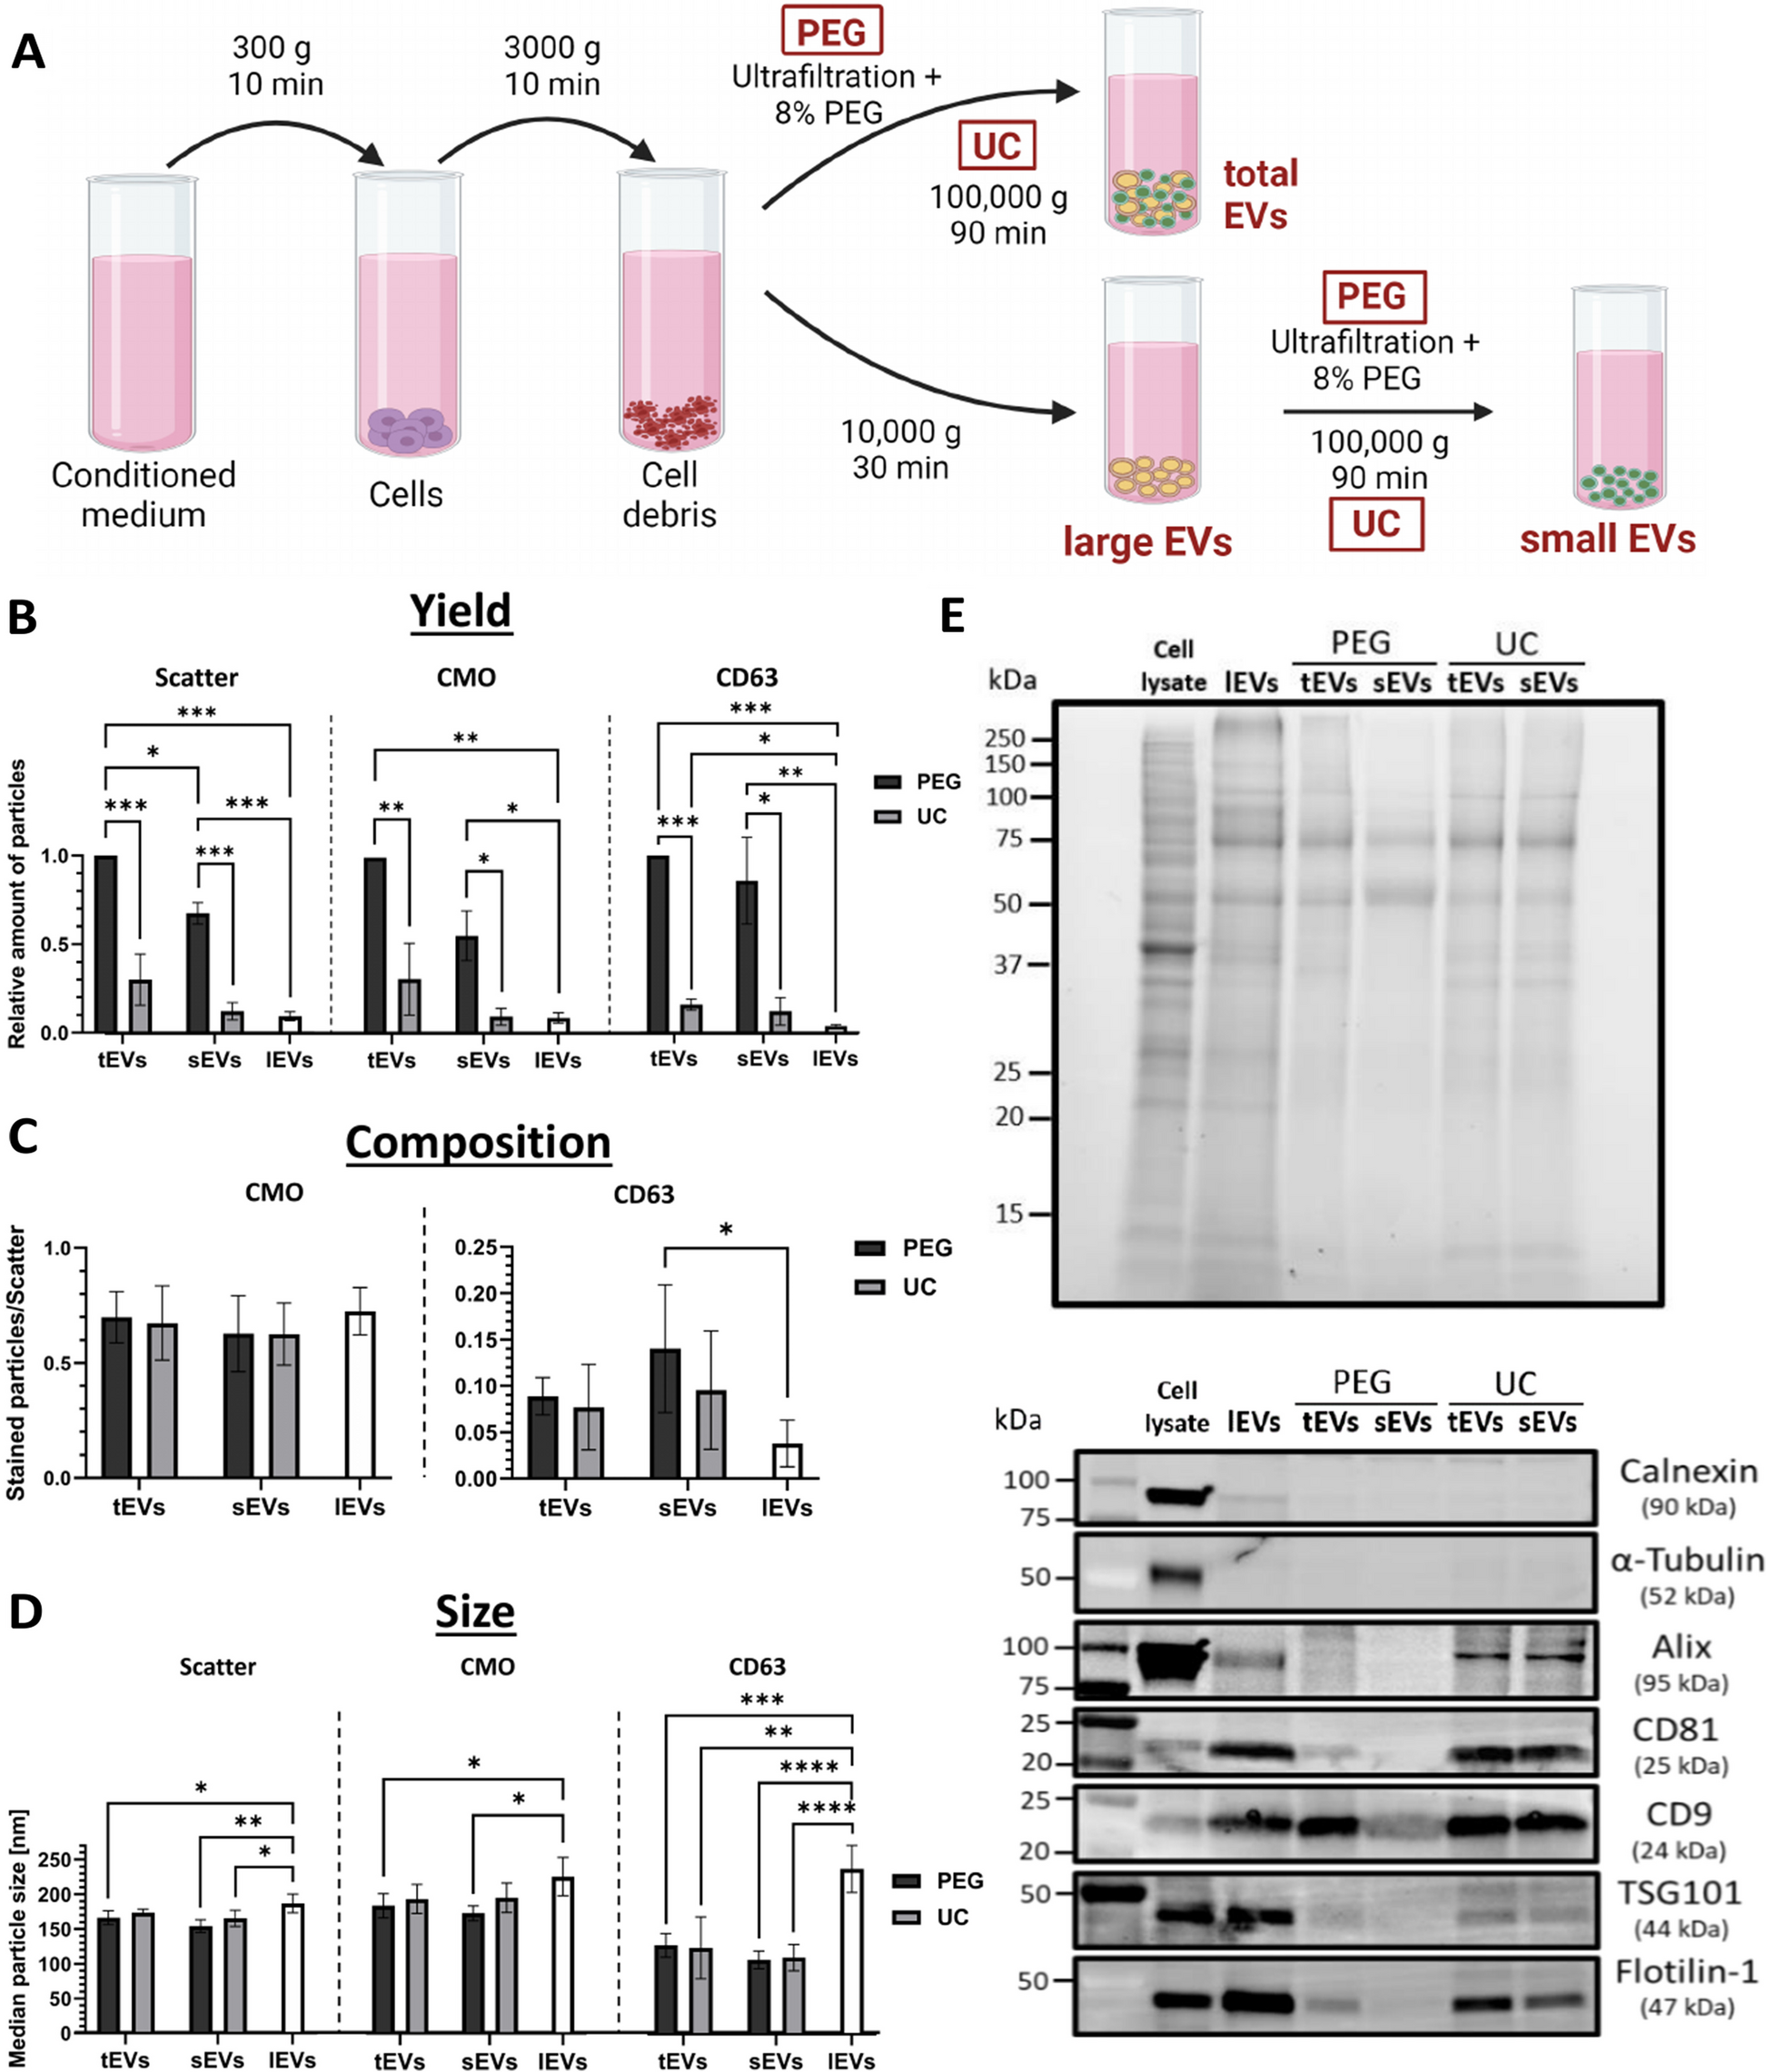
To isolate EVs, conditioned cell culture medium was centrifuged at 300 g for 10 min at RT to separate cells from the supernatant. Cell debris was removed at 3000 g for 10 min. Total EVs (tEVs) were isolated directly from the supernatant through PEG precipitation or ultracentrifugation (UC). Alternatively, the tEVs were further separated into large EVs (lEVs) and small EVs (sEVs) through centrifugation at 10,000 g for 30 min at 4°C. The pellet containing lEVs was washed once with sterile-filtered (0.1 µm) DPBS, centrifuged again at 10,000 g for 30 min, and stored at -80 °C for further analysis. sEVs were isolated from the supernatant by PEG precipitation or UC.
PEG Precipitation
The cell culture supernatant was concentrated using an ultrafiltration unit with a molecular weight cut-off of 100 kDa (Vivaspin2, Sartorius, Germany). To precipitate tEVs, a 40% w/v stock solution of polyethylene glycol 6000 (PEG, Sigma-Aldrich) dissolved in deionized water (30 °C) and sterile filtered (0.2 μm), was mixed with the supernatant to achieve a final concentration of 8% PEG. Tubes were incubated for 1 h at 4 °C and centrifuged for 30 min at 1500 g. The supernatant was aspirated and the tubes were centrifuged for another 5 min at 1500 g. The remaining supernatant was then completely removed with a 10 µL pipette tip, and the pellet was either stored or resuspended in 30–100 µL of sterile-filtered (0.1 µM) DPBS. The suspension was mixed by scratching over a rack and stored at -80 °C for further analysis.
Ultracentrifugation (UC)
For EV isolation by UC, cell culture supernatants depleted of cells, debris, and optionally lEVs, were transferred into polycarbonate tubes (#5082 or #4494, Seton Scientific Petaluma, USA) and centrifuged at 100,000 g for 90 min at 4 °C in a T-1250 fixed-angle rotor (k-factor 68.7) and Sorvall WX ultracentrifuge (Thermo Fisher Scientific, USA). The pellet was washed in 1 mL sterile-filtered (0.1 µm) DPBS and transferred to a 1.5 mL polypropylene tube (#357,448, Beckman Coulter, USA). After another round of centrifugation for 90 min at 100,000 g using 1.5 mL microfuge tube adapters (#11,058, Beranek Laborgeräte, Germany), the pellet was stored or resuspended in 30–100 µL sterile-filtered DPBS at – 80 °C.
Nanoparticle tracking analysis
The Zetaview twin nanoparticle tracking analyzer (NTA) from Particle Metrics (Germany) was used to measure particle concentration, size distribution, and presence of the vesicle-marker CD63 using the green (520/550 nm) laser/filter combination. All samples were diluted in DPBS to a final volume of 1 mL and around 250 particles per frame. The following settings were used for scattered light: Camera sensitivity: 85, Shutter: 100.
In order to stain membrane-containing particles, 1 µL prediluted (1:500) CellMask Orange (CMO, Invitrogen, Thermo Fisher Scientific, USA) was added to the sample in a total volume of 10 µL and incubated for 5 min at RT. The sample was then further diluted to get a final concentration of 10 ng/µL CMO and approximately 250 particles (Scatter) per frame. Fluorescence was analyzed at a sensitivity of 93 and a Shutter of 100.
For CD63 antigen staining, samples were adjusted to a concentration of approximately 1000 particles per frame in Scatter mode. Samples were mixed with 1 µL prediluted (1:10) CD63 antibody (Miltenyi Biotec, Germany) and incubated for 30 min at RT. Samples were further diluted to 1 mL (CD63 dilution 1:10,000). Fluorescence was analyzed at a sensitivity of 93. Videos were analyzed by the ZetaView Software version 8.0.16 with the following parameters based on the manufacturer’s pre-set parameters: particle size: 5–1000 nm, minimum brightness: 30 (Scatter/CMO) or 25 (CD63), minimal area of particles: 30, minimal tracking length: 15 frames. All samples were individually thawed right before analysis and kept on ice. To analyze EV release, the concentrations of unstained (scatter) and CMO-stained particles were measured. The relative particle changes have been further normalized to the number of viable cells per time point by dividing the particle concentrations with the cell counts determined at the time of EV harvest. All values were normalized to the unirradiated samples at 48 h.
RNA isolation
Total RNA isolation was performed using the mRNeasy Kit (Qiagen, Germany) according to the manufacturer’s protocol. MiRNA of cells and EVs were extracted using the miRNeasy micro Kit (Qiagen, Germany) as stated in the manufacturer’s protocol.
Reverse transcription of mRNA/miRNA and quantitative real-time polymerase chain reaction (qPCR)
Total RNA was transcribed to cDNA with the GoScript Reverse Transcription System (Promega, USA) and miRNA was transcribed using the miCURY LNA RT Kit (Qiagen, Germany) according to the manufacturer’s instructions. Quantitative PCR was performed on a CFX96 touch real-time PCR detection system (Bio-Rad, USA) using the iTaq SYBR Green Mastermix (Bio-Rad Laboratories, USA) and a calculated amount of 1–10 ng cDNA per reaction. MiRNA primers from the miRCURY LNA miRNA PCR Assays were purchased from Qiagen, whereas mRNA primers were synthesized by Eurofins genomics or purchased from Qiagen’s QuantiTect Primer Assays (see Supplementary Table 1).
Western blotting
For western blot analysis, cells or EVs were lysed in RIPA lysis buffer containing 1% Halt Protease and Phosphatase Inhibitor Cocktail (Thermo Fisher Scientific, USA) and 5 mM EDTA for 15 min on ice. The cell and vesicle lysates were centrifuged for 15 min at 14,000 g. The protein concentration was determined by the DC protein assay (Bio-Rad Laboratories, USA). Proteins were denatured by heating with 4 × Laemmli Sample buffer (Bio-Rad Laboratories, USA) supplemented with 2 mM dithiothreitol (DTT) for 10 min at 95 °C.
For protein separation by sodium dodecyl sulfate–polyacrylamide gel electrophoresis (SDS-PAGE), 20–30 µg of sample proteins, were loaded onto 4–20% Criterion TGX Stain-Free Precast Gels (Bio-Rad Laboratories, USA), allowing for total protein normalization. The gels were run in TGS buffer (250 mM Tris, 1.92 M Glycine, 0.1% SDS, pH 8.3) at 50 V for 15 min and 200 V for 40 min.
Proteins were transferred onto a polyvinylidene difluoride membrane (Immun-Blot Low fluorescence PVDF Membrane, Bio-Rad Laboratories, USA) using the Trans-Blot Turbo Transfer System (Bio-Rad Laboratories, USA). The membranes were blocked with Intercept blocking buffer (LI-COR, USA) for 1 h at RT. Protein detection with primary antibodies was performed overnight at RT using the antibodies listed in Supplementary Table 2. For visualization, the fluorescent secondary antibody Starbright Blue 520/700 Goat-anti mouse/rabbit (1:10,000, Bio-Rad Laboratories, USA) and the ChemiDoc Imaging System (Bio-Rad Laboratories, USA) were used.
EV–recipient cell interactions
To study the interactions between EVs and recipient cells, tEVs of 2 Gy or sham-irradiated PBMCs isolated after 96 h by ultrafiltration and PEG precipitation or UC were counted by NTA and diluted to a concentration of 1*1011 Particles/mL in a dilution of PKH26 in Diluent C (1:500, MINI26-1KT, Sigma-Aldrich, USA) to stain the EV membrane. As a negative control, equal volumes of PBS instead of EVs were mixed with PKH26 in Diluent C. Excessive dye was removed by using Exosome Spin Columns (Thermo Fisher Scientific, USA) according to the manufacturer’s protocol. Subsequently, stained EVs and PBS were further diluted 1:5 with DPBS.
For quantifying the EV uptake by FACs analysis, recipient cell lines (PBMCs, HCAEC, HUVEC, HCF, MRC-5, 1BR3, OKF6, BHY, Cal33) were seeded at a density of 100,000 cells per well in a 12-well plate in 2 mL medium (≙ 104 EVs/cell). The next day, the medium was changed and 50 µL of stained EVs or control were added to the medium. After 24 h, cells were trypsinized, washed with DPBS, and fixed with 2% Paraformaldehyde (PFA, Sigma-Aldrich, USA) in DPBS for 15 min at RT. After washing with DPBS, cells were resuspended in 100 µL autoMACS FACS buffer, and the PKH26 signal was measured on a MACSQuant Analyzer 10 (Miltenyi Biotec, Germany) with an excitation of 488 nm in B2 channel (585/40 nm).
For visualizing EV uptake using fluorescence microscopy images, cells were seeded in a density of 10,000 cells in 100 µL medium per well of a 96-well plate. 5 µL of stained EVs were added (≙ 104 EVs/cell), and cells were washed and fixed on the plate after 24 h. For high-resolution images of EV uptake by OKF6 cells, 10,000 cells of OKF6 in 100 µL were seeded in 8-well removable silicon chambers (Ibidi, Germany) attached to a polymer coverslip with ibiTreat tissue culture-treated surface (Ibidi, Germany). 10 µL of stained EVs were added to the cells and incubated for 24 h. Silicon chambers were removed before cells were washed in DPBS and fixed with 4% PFA for 10 min at RT. Ibidi slides were washed three times with DPBS and permeabilized by incubation with 0.1% Triton X-100 in DPBS for 10 min. After washing three times with DPBS, coverslips were incubated in a blocking solution with PBS containing 1% BSA, 300 mM glycine, and 0.1% Tween-20 for 30 min at RT. 50 µL of antibody Lamin A (1:100, ab26300, Abcam, UK) diluted in the blocking solution was added dropwise to the cells before they were covered and incubated for 1 h at RT. After another round of DPBS washing, cells were incubated with the secondary antibody Anti-rabbit IgG Alexa Fluor 488 (1:500, Cell Signaling Technology, USA) for 1 h at RT and mounted with 1 drop of VECTASHIELD Antifade Mounting Medium with DAPI (Vector Laboratories, USA) to stain the nuclei. The images were taken using a Zeiss AxioImager.Z2 microscope (Zeiss, Germany) coupled to an AxioCam 503 mono microscope camera together with the ZEN 3.5 Pro software. Nuclei were visualized in the DAPI channel, stained EVs were detected in the AF-555 channel, and the Lamin A signal was visualized using the AF-488 channel. For comparing the signal between different cell types, images were obtained with an EC Plan-Neofluar 20x/0.5 M27 objective. For a high-resolution z-stack image of OKF6, images were obtained with an EC Plan-Neofluar 100x/1.30 Oil Pol M27 objective in combination with Immersol 518 F (Zeiss, Germany).
MicroRNA mimic transfection
For testing the effect of miR-34a-5p on viability, 3000 HCAEC and 1BR3, or 6000 OKF6 cells, respectively, were seeded in 100 µL medium per well in 96-well plates. For investigating the effect of miR-34a-5p on senescence and apoptosis, 100,000 or 200,000 cells were seeded in a 6-well plate containing 2.5 mL medium. The next day, the culture medium was replaced, and cells were transfected with 10 nM hsa-miR-34a mirVana miRNA mimic (#4,464,066, Thermo Fisher Scientific, USA) or 10 nM of a random sequence miRNA mimic negative control (mirVana miRNA mimic Negative Control #1, #4,464,058, Thermo Fisher Scientific, USA) using lipofectamine RNAiMAX (Thermo Fisher Scientific, USA), according to the manufacturer’s protocol.
Biological effect of EVs on recipient cells
To assess the effect of irradiation on the biological function of PBMC-derived EVs, tEVs from the supernatant of 2 Gy and sham-irradiated PBMCs (106 cells/mL) from four different donors were isolated by PEG precipitation after 96 h. The tEV pellet was resuspended in an equivalent volume of fresh OKF6 growth medium. 45,000 OKF6 cells were seeded in a 12-well plate in 1 mL of medium. The next day, OKF6 cells were washed with DPBS and the medium was replaced with 1 mL of tEVs isolated from 106 PBMCs. OKF6 were irradiated 1 h after the addition of the EVs and harvested 72 h after irradiation to measure miR-34a-5p expression and effects on senescence.
Cell viability assay
Cell viability was determined based on the average metabolic activity. The water-soluble tetrazolium (WST) assay was performed using WST-8 reagent (Cell Counting Kit-8, Sigma-Aldrich, USA), which produces an orange formazan product upon reduction by dehydrogenases.
Cells were seeded in 96-well plates with 100 µL of culture medium, followed by transfection and irradiation the day after seeding. As a control, untreated cells were used, and medium alone served as a blank. 72 h after treatment, 10 µL of the CCK-8 reagent was added to each well, and the samples were incubated for 3 h. The absorbance of the formazan product at 450 nm was subsequently quantified on a Tecan infinite plate reader (Tecan Group AG, Switzerland).
Senescence assay
To measure senescence, β-galactosidase activity was evaluated in HCAEC, OKF6, and 1BR3 cell lines 72 h after treatment. For this purpose, the CellEvent Senescence Green Flow Cytometry Assay Kit (Invitrogen, Thermo Fisher Scientific, USA) was used to perform the assay according to the manufacturer's protocol. After harvesting and fixing the cells with 2% PFA, cells were stained for 1.5 h at 37 °C in a 1:500 working solution and analyzed using a 488 nm laser and the 525/50 nm filter (B1 channel) on the flow cytometer.
Annexin V/PI apoptosis assay
The percentage of dead, early, and late apoptotic cells was determined using the Annexin-V-FITC Kit from Miltenyi according to the manufacturer’s protocol and analyzed on the flow cytometer. Annexin-positive and PI-negative cells were considered as early apoptotic cells, while annexin-positive and PI-positive cells were considered as late apoptotic cells.
Data analysis
Western Blot band intensities were quantified using Image Lab version 6.1 (Bio-Rad Laboratories, USA) and normalized to the total protein load in each lane determined by the stain-free method. All flow cytometry data were analyzed on the MACSQuantify Software version 2.13.3. For qPCR analysis, ΔCt values were calculated as Cttarget—Cthousekeeper, ΔΔCt values as ΔCttreatment- ΔCtcontrol and fold changes as 2− ΔΔCt. For statistical analysis, we employed various tests based on the specific comparisons required. To compare fold changes against a designated value, we utilized one-sample t-tests. For the comparison of two means, we applied the Student's t-test. When comparing two or more variables, we used a two-way ANOVA followed by the Benjamini–Hochberg post hoc test to control for false discovery rates. To compare multiple means against a single control mean, we conducted Dunnett's multiple comparison test. Data visualization and data analysis were performed using GraphPad Prism 9.5.0 software. *p ≤ 0.05; **p ≤ 0.01; ***p ≤ 0.001; ****p ≤ 0.0001.


留言 (0)