
記住我


Essential thrombocythemia (ET) is a myeloproliferative neoplasm (MPN) whose clinical course is often indolent but might be adversely affected by arterial and venous thrombosis, hemorrhages, and disease progression to myelofibrosis (MF) or, rarely, to acute myeloid leukemia (AML) [1]. Treatment depends on disease risk stratification, which is assessed through scoring models that are generally designed to estimate thrombosis probability, since it represents the leading cause of mortality and morbidity in ET patients. According to the latest ELN and NCCN recommendations, IPSET-t and r-IPSET-t are the two principal models used to estimate thrombotic risk by merging clinical and molecular data at the time of ET diagnosis [2, 3]. Following what has been done in MF, efforts were recently made on refining prognostic models with additional genetic information (i.e., non-driver mutations) also in ET and polycythemia vera (PV) [4]. However, molecular analyses are costly and not widely accessible, thus being hardly applicable in widespread and relatively indolent diseases. Therefore, attention has been paid to develop easily attainable scoring systems by incorporating complete blood counts (CBC) data, based on the rationale that enhanced clonal myeloproliferation, represented by higher absolute neutrophil count (ANC), and pronounced immune dysregulation, with lower absolute lymphocyte count (ALC), may affect different outcomes. Therefore, ANC and ALC have been used to design new survival predictors in MPNs over the last few years [5,6,7]. More specifically, increased ANC appeared to promote venous thrombosis in PV and – possibly – also in ET, while showed to adversely affect overall survival (OS) rates in ET, along with reduced ALC [8, 9]. As a result of these new insights, Tefferi et al. proposed a novel globally applicable survival model for ET named “triple A”, based on age, ANC and ALC, all evaluated at first medical referral [9]. Age (4 points >70 years, 2 points 50–70 years), ANC (1 point >8.0 × 10⁹/L), ALC (1 point <1.7 × 10⁹/L) were used to define AAA risk class as low (0–1 point; L), intermediate-1 (2-3 points; Int-1), intermediate-2 (4 points; Int-2), and high (5-6 points, H). Authors highlighted that the AAA model excellently discriminate OS in a large cohort of ET patients, independently of adverse cytogenetical and mutational features. Recently, Krecak and colleagues applied AAA model in a PV cohort confirming its ability to predict OS, and Lucijanic et al. did the same in prefibrotic and overt MF [10, 11]. All this considered, triple A model appears to retain a wide range of applicability among MPNs.
To test general utility of the AAA model in ET, we applied the score in a single center cohort of 314 ET patients to investigate its role in predicting OS and other main adverse outcomes, such as thrombotic and hemorrhagic events. All patients were diagnosed from 2002 to 2023 at the Division of Hematology of Udine in accordance with the most current WHO classification in effect at that time. The few cases preceding year 2008 were retrospectively verified to be in compliance with the subsequent WHO classification criteria. Thrombosis and major bleedings (MB) were defined according to WHO (https://icd.who.int/browse11) and ISTH classifications, respectively [12]. Microvascular disturbances (headache, lightheadedness, visual symptoms, palpitations, chest pain, erythromelalgia, and distal paresthesia) and splenic discomfort were counted as disease related symptoms. Cardiovascular (CV) risk factors evaluated at ET diagnosis were arterial hypertension, diabetes, and active smoking. Clinical and laboratory data were collected through medical chart review. Statistical analysis was performed with Jamovi Software (version 2.3.21). Shapiro–Wilk’s test was used to check for data distribution. Chi-squared test and Kruskal–Wallis test were used to compare categorical and continuous variables, respectively. OS, TFS, MB-free survival, vascular (thrombosis and MB) event-free survival (vEFS) and global event-free survival (EFS; including thrombosis, MB, MF or AML progression, death) were defined from diagnosis to first event/last contact. Survival analyses were performed with the Kaplan–Meier method, the log-rank test, and the Cox regression.
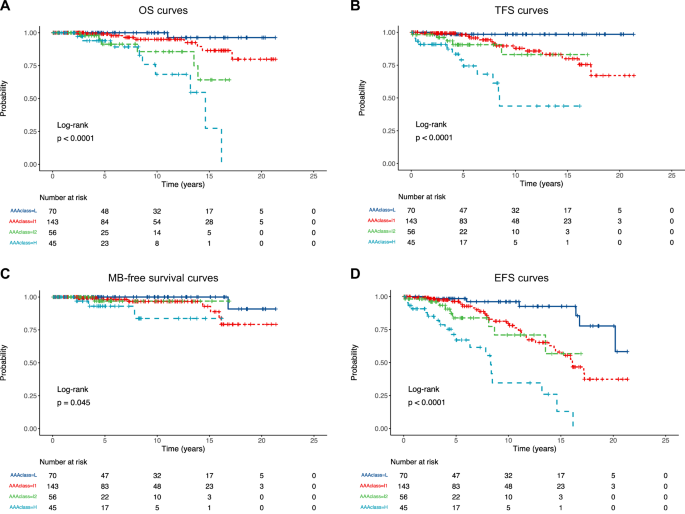
Population had slight prevalence of female patients (56.1%), median age at diagnosis was 63 years (IQR: 50–71), and median follow-up time was 6.1 years (IQR 2.9–12.2). A total of 70 (22.3%), 143 (45.5%), 56 (17.8%), and 45 (14.3%) cases were defined as L, Int-1, Int-2, and H risk according to the AAA model, respectively. The overall patient characteristics stratified by AAA risk class are summarized in Table 1. Higher AAA classes were enriched in older patients (p < 0.001) and presence of CV risk factors (p < 0.001). Among these, arterial hypertension resulted to be the factor most strongly associated with higher AAA score (p < 0.001). Notably, no statistical difference in driver mutations distribution among AAA classes was observed. Globally, 32 (10.2%) thrombosis, 12 (3.8%) MB, 16 (5.1) disease progressions, and 24 (7.6%) deaths were recorded during follow-up time. We confirmed the AAA model capability to excellently differentiate OS among classes in our ET cohort (p < 0.001; Fig. 1A): median OS was 13.2 years in H risk group, while not reached in all others. Death rate was higher in H (HR = 47.2; p < 0.001), Int-2 (HR = 21.2; p = 0.005) and Int-1 (HR = 5.5; p = 0.108) AAA classes, compared to L risk. Regarding vascular events, we found that AAA groups were strongly associated with different TFS (p < 0.001; Fig. 1B), with median TFS of 8.5 years in H risk group, while not reached in all others. Thrombosis rate was higher in H (HR = 45.6; p < 0.001), Int-2 (HR = 13.1; p = 0.020) and Int-1 (HR = 9.0; p = 0.034) AAA classes, compared to L risk. Similarly, MB-free survival was statistically different among AAA classes (p = 0.045; Fig. 1C), even though median MB-free survival was not reached in all groups. MB rate was higher among H (HR = 15.8; p = 0.020), Int-2 (HR = 3.4; p = 0.392) and Int-1 (HR = 4.8; p = 0.143) AAA classes, compared to L risk. Consequently, AAA significantly correlated with distinct vEFS curves (p < 0.001). Median vEFS was 8.5 years in H risk group, while not reached in all others; 10-year vEFS was 100% (CI95: 100-100), 96.6% (CI95: 92.7–100), 96.9 (CI95: 91.0–100) and 83.7 (CI95: 66.5–100) in L, Int-1, Int-2 and H risk, respectively. Vascular events probability was higher in H (HR = 28.1; p < 0.001), Int-2 (HR = 7.3; p = 0.019) and Int-1 (HR = 6.6; p = 0.011) compared to L risk. Differently, no association was observed between AAA classes and disease progression, maybe due to a higher incidence of MF and AML progression in long-standing ET cases. In support of this, we observed that median time to progression (8.5 years; IQR: 6.6–10.7) exceeded median follow-up time of Int-1 (6.9 years; IQR: 2.8–12.9), Int-2 (4.6 years; IQR: 2.7–10.1), and H (5.0 years; IQR: 2.4–8.6) groups. Nevertheless, AAA model was capable to recapitulate global adverse outcomes in our cohort (p < 0.001; Fig. 1D). In detail, median EFS was 8.3 years in H risk, 16.1 years in Int-1, while not reached in the other two groups, and event probability was higher in H (HR = 15.6; p < 0.001), Int-2 (HR = 4.9; p = 0.003) and Int-1 (HR = 3.8; p = 0.003) compared to L risk. In univariable and multivariable analysis, we confirmed that older age and elevated ANC negatively affected OS, while a non-significant negative trend was observed for low ALC, probably due to small sample size of our cohort compared to Mayo Clinic (n = 598) and University of Florence (n = 485) AAA validatory cohorts. As regards other adverse outcomes, older age and high ANC both retained the greatest adverse impact especially in relation to TFS, vEFS and EFS (Supplementary table).
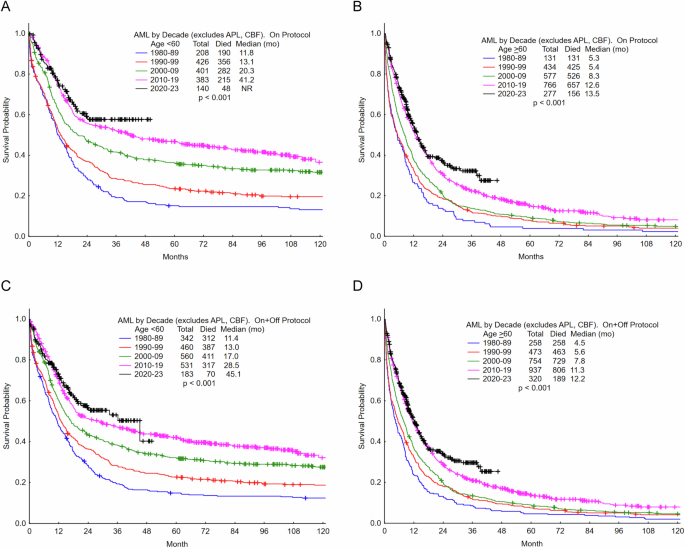
Table 1 Patients’ characteristics at ET diagnosis and main clinical outcomes among AAA risk classes.Fig. 1: Outomes according to AAA risk.
A OS according to AAA risk. 10-year OS was 100% (CI95: 100-100), 95.0% (CI95: 90.0–100), 85.6 (CI95: 72.6–100) and 68.3 (CI95: 49.0–95.3) in L (blue), Int-1 (red), Int-2 (green) and H (azure) risk classes, respectively. Figure 1B TFS according to AAA risk. 10-year TFS was 98,5% (IC95: 95,5–100), 87,8% (IC95: 80,5–95,8), 83,0 (IC95: 68,1–100) and 43,8 (IC95: 24,5–78,5) in L (blue), Int-1 (red), Int-2 (green) and H (azure) risk classes, respectively. Figure 1C MB-free survival according to AAA risk. 10-year MB free survival was 100% (IC95: 100–100), 96,6% (IC95: 92,7–100), 96,9 (IC95: 91,0–100) and 83,7 (IC95: 66,5–100) in L (blue), Int-1 (red), Int-2 (green) and H (azure) risk classes, respectively. Figure 1D. EFS according to AAA risk. 10-year EFS was 96,2% (IC95: 91,0–100), 79,7% (IC95: 71,1–89,4), 70,9 (IC95: 53,9–93,3) and 34,6 (IC95: 18,1–66,2) in L (blue), Int-1 (red), Int-2 (green) and H (azure) risk classes, respectively.
As JAK2 mutation is associated with increased risk of thrombosis in both IPSET-t and r-IPSET-t scores, we tested the efficacy of the AAA model in JAK2-mutated cases (n = 201). We confirmed its ability to discriminate thrombotic (p < 0.001), vascular (p < 0.001), and global adverse events (p < 0.001) risk. Correlations between AAA score and MB was slightly above significance threshold (p = 0.051), probably due to the limited number of events observed (n = 10; 5%). No statistical difference emerged when testing the AAA model as outcome predictor in CALR-mutated, MPL-mutated and triple negative cases.
With the limits of a retrospective analysis and the relatively low number of patients and short follow-up time, our data confirmed the efficacy of the AAA model in predicting OS in our ET cohort. More, we found that AAA model is also associated with risk of thrombosis and MB. In conclusion, the AAA model proved to be able in predicting not only OS, but also to globally foresee the adverse outcomes in ET, independently of JAK2 mutational status. Our results encourage us to consider AAA model as a new easy tool that may flank the classical IPSET-t and r-IPSET-t systems for ET risk evaluation to promptly identify high risk ET patients at first referral.
Available upon reasonable request.
留言 (0)