
記住我


Multiple myeloma (MM) is characterized by complex, heterogeneous genetic abnormalities that significantly affect disease progression, treatment response, and prognosis. Recurrent genetic alterations in MM include primary events such as immunoglobulin heavy chain (IGH) structural variations (SVs) and hyperdiploidy, and secondary events associated with disease progression, including 1q gain, 17p deletion, and MYC rearrangements [1]. Risk stratification in MM is largely based on these genetic alterations, with adverse risk factors including specific IGH translocations [t(4;14), t(14;16), t(14;20)], 1q gain, and TP53 alterations [2].
MYC rearrangements have been proposed as additional high-risk features of progression and relapse in newly diagnosed MM (NDMM), but their prognostic implication has not been fully established [3]. While earlier studies using fluorescence in situ hybridization (FISH) or targeted capture-based sequencing have suggested an independent association between MYC rearrangements and poor outcomes [4, 5], more recent whole genome sequencing (WGS) studies have identified that only MYC translocations involving IgL are consistently associated with poor outcomes [6,7,8]. These discrepancies likely result from the complex nature of MYC rearrangements, which often involve multiple chromosomal partners and widely distributed breakpoints.
The MYC rearrangement frequency in NDMM is highly variable, ranging from 8–26% when detected by FISH [4, 5, 7, 9] to 36–41% when identified by WGS [6, 7]. Expression analysis of MYC using immunohistochemistry (IHC) showed overexpression in 40% of cases, and this overexpression was associated with poor prognosis, whereas pairwise MYC rearrangements analysis by FISH showed positive results in 20% of cases [9]. This variability highlights the crucial role of detection methods in understanding the role of MYC in MM pathogenesis. Given its role as an oncogene, a comprehensive evaluation of both the SVs and expression of MYC may be essential to achieve accurate risk stratification.
Optical genome mapping (OGM) is a promising technology for comprehensive detection of SV and copy number variations (CNV). OGM can identify complex rearrangements undetectable by conventional cytogenetic methods and may complement traditional technologies, such as karyotyping, FISH, and chromosomal microarrays [10]. Recent studies have demonstrated the efficacy of OGM in detecting genome-wide SVs and CNVs in hematological cancers, including MM [10,11,12]. However, the clinical utility of combining OGM with conventional cytogenetics for MYC rearrangement detection in MM remains unexplored. In this study, we comprehensively analyzed MYC rearrangements in MM using OGM in conjunction with FISH, karyotyping, and NGS and determined their effect on its expression of this proto-oncogene.
Genomic analysis of MYC rearrangements was performed in patients with NDMM diagnosed at the Korea University Guro Hospital between January 2023 and April 2024. A total of 30 bone marrow (BM) aspirate samples with karyotyping, FISH, and targeted NGS results were collected for OGM analysis. All analyses were conducted in accordance with relevant guidelines and regulations. This study was approved by the Institutional Review Board of Korea University, Guro Hospital (2024GR0240) with an exemption for patient consent, and was conducted in accordance with the Declaration of Helsinki.
OGM was performed using genomic DNA isolated from the BM aspirate, fluorescently labeled using the Direct Label Enzyme (DLE-1) and DL-Green fluorophore, loaded onto a Bionano Saphyr Chip, imaged using a Saphyr instrument, and analyzed using the rare variant analysis pipeline of the Bionano Solve/Access software (Bionano Genomics, San Diego, CA, USA). MYC rearrangements, including translocations, deletions, duplications, and inversions, were examined using OGM. For FISH, MYC rearrangements were analyzed using the LSI IGH/MYC/CEP8 tricolor dual fusion translocation probe (Vysis, IL, USA). Cases with negative MYC rearrangement results by FISH and positive results by OGM were further analyzed using the LSI MYC dual-color break-apart probe (ZytoVision GmbH, Bremerhaven, Germany). MYC IHC staining was performed using the immunoreactive score (IRS) [13] to evaluate the intensity and percentage of MYC-overexpressing tumor cells. For MYC overexpression analysis, IRS 0–1 (negative) and 2–3 (mild) were considered negative, while IRS 4–8 (moderate) and 9–12 (strongly positive) were considered positive.
Using OGM in conjunction with FISH, karyotyping, and NGS, MYC rearrangements were detected in 43.3% of patients (Table S1). When analyzed by OGM, 40.0% of the samples were detected with MYC rearrangements, including 9 samples with translocation, 1 with deletion, 1 with inversion, and 1 with translocation and complex intra-locus rearrangement. Karyotyping revealed MYC rearrangements in 13.3% of samples, of which three were also detected by OGM (Table S1). MYC mutations were analyzed using targeted NGS and not detected in our study. Based on either the OGM or karyotyping results, MYC rearrangements showed a trend towards hyperdiploidy (46.2% vs. 11.8%, P = 0.09). However, there was no baseline clinical and molecular characteristics differences between patients with and without MYC rearrangements (Table S2).
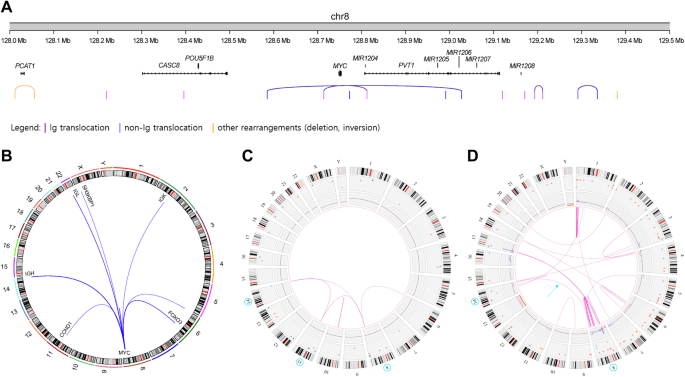
According to OGM results, rearrangement breakpoints were located at chr8:126.3–129.4 Mb. Duplication, deletion, and inversion breakpoints were found scattered across the centromeric region of MYC at chr8:126.3–128.1 Mb. The majority of translocation breakpoints were concentrated between 128.6 and 129.4 Mb. We analyzed the enrichment of super-enhancer sites near MYC breakpoints, using hotspot translocation breakpoint regions of MYC previously reported by Mikulasova et al. around chr8:128.6–129.0 Mb and chr8:129.1 Mb–129.4 Mb [6]. Translocation breakpoints were clustered in these regions at rates of 31.3% and 43.8%, respectively (Fig. 1A).
Fig. 1: Characterization of MYC rearrangements in multiple myeloma using OGM.
A Genome plot (GRCh37) showing the locations of MYC locus breakpoints on 8q24.21. The breakpoints are indicated by vertical lines of corresponding to the rearrangement subtypes and partner genes (e.g., translocation involving Ig loci as purple, translocation involving non-Ig loci as blue, and other rearrangements such as deletion or inversion in orange). Arcs indicate the positions of two breakpoints found in one sample. B Circos plot showing the repertoire of MYC translocations in multiple myeloma. Circos plot of a case showing primary translocation involving t(11;14) translocation and MYC rearrangement involving IGH, MYC, and CCND1 depicted in (C), and a case with complex MYC rearrangement involving IGH translocation and chromoanagensis causing MYC amplification (6 copies) depicted in (D).
MYC translocations were detected in 36.7% of the samples, with recurrent gene partners including enhancers from the immunoglobulin loci IGH (16.7%) and IGL and IGK (both 6.7%). Additionally, FOXO3 on chromosome 6 and SH3KBP1 on chromosome X were detected (Fig. 1B). Two samples exhibited complex MYC translocations involving more than one of the partners mentioned above. One sample with a primary translocation involving t(11;14) exhibited an MYC rearrangement involving IGH, MYC, and CCND1 (Fig. 1C). The variant allele frequency (VAF) of IGH::MYC was higher compared to IGH::CCND1 (VAF 17% vs. 9%), the subsequent complex rearrangement involving MYC may outcompeted the primary clone with IGH::CCND1. Another sample with an IGH translocation also showed MYC amplification via chromoanagenesis (Fig. 1D). Interestingly, these two samples showed centromeric translocation breakpoints near the identified hotspot regions, at chr8:128.1–128.5 Mb, suggesting different underlying mechanisms for these rearrangements.
The presence of hotspot breakpoints in MYC rearranged MM samples, especially in translocations, allowed us to detect MYC rearrangements by FISH. We reviewed targeted region of commercially available FISH probes and analyzed MYC rearrangements using translocation dual fusion probe targeting the region chr8:128.2-129.3 Mb, covering both the first hotspot (chr8:128.6–129.0 Mb) and most of the second hotspot (chr8:129.1 Mb–129.4 Mb). A positive signal for MYC rearrangement was defined as either a fusion signal or gain of dim MYC signal. We detected MYC rearrangements in 26.7% of the samples. Among samples with MYC rearrangements, 30.8% were not detected using FISH (Table S1), primarily due to breakpoints located too close to or outside the targeted region (Table S3). The distribution of MYC rearrangements breakpoints in MM differs from that seen in other lymphomas, such as Burkitt’s lymphoma or diffuse large B cell lymphoma, suggesting that the target regions of MYC FISH probes designed for other lymphomas may affect the detection frequency of MYC rearrangements in MM.
We examined the effect of MYC rearrangements on protein expression using MYC IHC in bone marrow biopsies evaluated using the IRS. MYC overexpression was observed in 72.7% of MYC-rearranged cases with available BM biopsies, comprising 7 with MYC translocations, 1 with an inversion, and 1 with both translocation and complex intra-locus rearrangement. The MYC IRS was significantly higher in the MYC-rearranged group than in the non-rearranged group (median 4.0 vs. 2.0, P = 0.012; Fig. 2A, B).
Fig. 2: MYC rearrangement and its correlation with MYC protein expression.
A Example images illustrating MYC IHC staining and corresponding IRS (X40 magnification). B, C Bar plots showing median IRS values with error bars representing standard error. Individual data points are overlaid to show the distribution of all values. B compares IRS in samples with and without MYC rearrangements, while C compares samples by the type of MYC rearrangement. D Genome map view (GRCh37) showing a novel MYC translocation involving SH3KBP1 (also known as CIN85) at Xp22.12 with sequence annotation illustration (E; exon, fill box; coding exon). E IHC images of the same case as in (D) using anti-Kappa (left) and anti-MYC (right) antibodies (X40 magnification).
Notably, MYC expression levels were consistently high in MM samples with translocations involving immunoglobulin loci but varied in those with non-immunoglobulin partners, such as FOXO3, where MYC overexpression was previously reported via RNA sequencing [6]. Samples with MYC translocations involving immunoglobulin loci exhibited significantly higher MYC expression than samples with translocations involving different partners (P = 0.037) and showed a trend towards higher expression compared to other MYC rearrangements (P = 0.092) (Fig. 2C). No significant difference in IRS was observed among MYC-rearranged samples based on breakpoint locations, including, MYC hotspot or telomeric regions.
Interestingly, moderate MYC expression was also detected in a patient with a novel MYC translocation involving SH3KBP1 (CIN85) at Xp22.12 in the same orientation (Fig. 2D). SH3KBP1 encodes SH3 domain-containing kinase binding protein 1, which is associated with B cell receptor activation signal transmission [14]. The SH3KBP1 breakpoint was associated with accessible chromatin marks (H3K27ac) and a DNase I hypersensitivity site identified by a combination of DNase-seq and FAIRE-seq, suggesting that it may be a highly accessible transcribed region (Figure S1).
Our study reports the following significant findings: (1) MYC rearrangements were observed in a significant proportion of MM cases, particularly when using OGM; (2) MYC translocation breakpoints were enriched at 128.6–129.4 Mb. While commercially available FISH probes with the most coverage of these breakpoints were used to analyze MYC rearrangements, this approach was limited; (3) MYC expression was uniformly high in MM samples with translocations involving immunoglobulin loci but variable in those with non-immunoglobulin partners. Notably, MYC overexpression has also been observed, although rarely, in cases with inversions or non-immunoglobulin translocations. We propose that FISH probes targeting the chr8:128.6–129.4 Mb region, using a break-apart design followed by partner-specific probes, would optimally detect MYC translocations in MM. The combination of OGM and MYC IHC for MYC rearrangement evaluation may have practical implications for routine prognostic assessments. Future studies incorporating a larger number of MYC rearrangements with corresponding clinical outcome data is necessary to clarify the prognostic impact of MYC rearrangements. Furthermore, integrating RNA expression data along with IHC would expand the understanding of the dysregulation mechanisms associated with MYC rearrangements.
留言 (0)