
記住我


The baseline demographics and clinical characteristics of SCALE (study population with prediabetes and a BMI of at least 30 kg/m2 or at least 27 kg/m2 with comorbidities from countries where HRQoL was assessed, n = 1755) and STEP 1 (n = 1961) study participants are shown in Table 1. The mean (SD) BMI was 39.2 (6.5) and 37.9 (6.7) kg/m2 in the SCALE and STEP 1 datasets, respectively, and 22.5% (396/1755) and 25.9% (508/1,961) of the SCALE and STEP 1 analysis sets, respectively, were men. The mean (SD) ages in SCALE and STEP 1 were 47.9 (11.7) and 46.5 (12.7) years, respectively. In SCALE, 13.4% of participants had heart or circulatory diseases at baseline, and in STEP 1, 2.3% of participants had CAD at baseline. The mean (SD) baseline EQ-5D-3L scores in SCALE were 0.929 (0.061) in men and 0.923 (0.064) in women. The corresponding STEP 1 EQ-5D-3L scores were 0.903 (0.094) in men and 0.892 (0.106) in women. The mean baseline SF-6D utilities (Portugal) in STEP 1 were 0.900 (0.065) and 0.898 (0.064) in men and women, respectively.
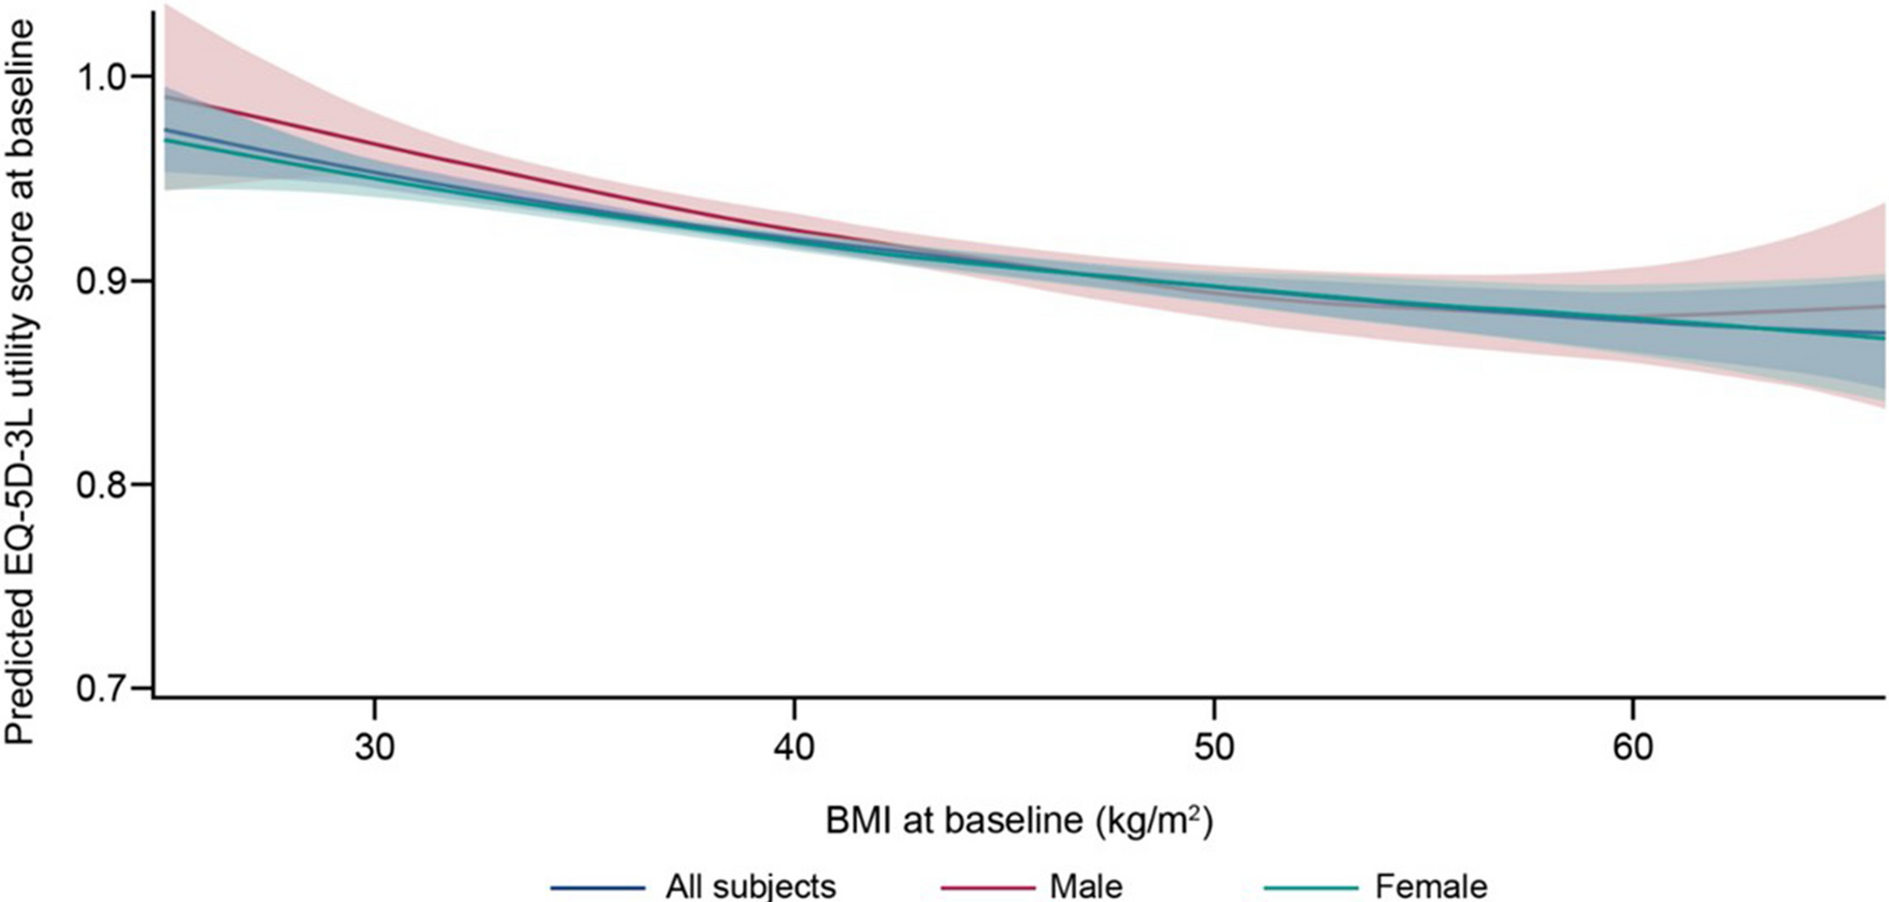
Table 1 Baseline demographics and disease characteristics of participants from SCALE and STEP 1Correlation Between Baseline BMI and UtilitySCALE EQ-5D-3L for UKIn the prediabetes FAS population of SCALE, a higher baseline BMI was correlated with decreasing baseline utility scores (Fig. 1), although the correlation was non-significant based on p values of linear, quadratic and cubic effects. The confidence bands widened toward the extremes of the observed BMI.
Fig. 1
Regression model: predicted EQ-5D-3L (UK) utility score from SCALE vs. BMI. Red-colored area corresponds to the prediction interval for men; green-colored area is the prediction interval for women. BMI body mass index, EQ-5D-3L EuroQoL-5 dimensions-3 levels
The results of the regression model on baseline utility (EQ-5D-3L) are presented in Table 2. The model predicted statistically significant higher baseline utilities for men (0.0104; 95% CI 0.0034, 0.0174; p = 0.0036) compared with women and statistically significant lower utilities for older participants (age 45–54 years: − 0.0145; 95% CI − 0.0247, − 0.0043; p = 0.0054, age 55–64: − 0.0203; 95% CI − 0.0313, − 0.0092; p = 0.0003, age 65–74: − 0.0229; 95% CI − 0.0376, − 0.0083; p = 0.0022, age ≥ 75: − 0.0512; 95% CI − 0.1013, − 0.0012; p = 0.0449) compared with younger participants (25–34 years) and for participants with hypertension (− 0.0089; 95% CI − 0.0152, − 0.0026; p = 0.0055) compared with participants without hypertension; all other parameters were fixed. BMI, heart or circulatory disease and smoking status were non-significant predictors of baseline utility. To preserve comparability with the model presented by Søltoft et al. [13], simplified models, e.g., with removed quadratic and cubic terms for BMI, were not further explored.
Table 2 Regression model between baseline BMI and baseline EQ-5D-3L (UK) scores from SCALE and STEP 1 and SF-6D (Portugal) scores from STEP 1 – full analysis set (men and women)In the male subset (Table 3), a statistically significant and negative correlation was reported between utility and the age group of 65–74 years (− 0.0279; 95% CI − 0.0555, − 0.0003; p = 0.0474) compared with younger participants. In the female subset (Table 4), the age groups of 45–54 years (− 0.0125; 95% CI − 0.0242, − 0.0009; p = 0.0343), 55–64 years (− 0.0198; 95% CI − 0.0324, − 0.0071; p = 0.0022) and 65–74 years (− 0.0206; 95% CI − 0.0382, − 0.0030; p = 0.0218) compared with younger participants and participants with hypertension (− 0.0115; 95% CI − 0.0188, − 0.0042; p = 0.0021) compared with participants without hypertension were statistically significant and negatively correlated with utility.
Table 3 Regression model between baseline BMI and baseline EQ-5D-3L (UK) scores from SCALE and STEP 1 and SF-6D (Portugal) scores from STEP 1—male populationTable 4 Regression model between baseline BMI and baseline EQ-5D-3L (UK) scores from SCALE and STEP 1, and SF-6D (Portugal) scores from STEP 1—female populationSTEP 1 EQ-5D-3L for UKIn the FAS population of STEP 1, a higher baseline BMI was correlated with decreasing baseline utilities (Fig. 2). Note that although we observed a decrease in average utility values with an additional unit of BMI, this trend was not significant based on p values of linear, quadratic and cubic effects. The confidence bands widened toward the extremes of the observed BMI.
Fig. 2
Regression model: predicted EQ-5D-3L (UK) utility score from STEP 1 vs. BMI. Red-colored area corresponds to the prediction interval for men; green-colored area is the prediction interval for women. BMI body mass index, EQ-5D-3L EuroQoL-5 dimensions-3 levels
The results of our regression model on baseline utility (EQ-5D-3L) are presented in Table 2. Assuming other parameters being fixed, our model predicted EQ-5D-3L lower baseline utilities for women compared with men (0.0123; 95% CI 0.0020, 0.0225; p = 0.0188), previous smokers (− 0.0119; 95% CI − 0.0224, − 0.0014; p = 0.0257) compared with never-smokers, older participants (− 0.0008; 95% CI − 0.0012, − 0.0004; p = 0.0002) compared with younger participants and participants with CAD (− 0.0705; 95% CI − 0.1003, − 0.0407; p < 0.0001) compared with those without CAD at baseline. Prediabetes status at baseline and hypertension, along with BMI, were not significant predictors of baseline utility. To preserve comparability with the model presented by Søltoft et al. [13], simplified models, e.g., with removed quadratic and cubic terms for BMI, were not further explored.
In the male subset of the FAS (Table 3), the presence of CAD at baseline (− 0.0848; 95% CI − 0.1197, − 0.0499; p ≤ 0.0001) was the only statistically significant (negative) predictor of baseline EQ-5D-3L scores. In the female subset (Table 4), older age (− 0.0010; 95% CI − 0.0014, − 0.0005; p = 0.0001), presence of CAD at baseline (− 0.061; 95% CI − 0.1092, − 0.0136; p = 0.0119) and current (− 0.0177; 95% CI − 0.0346, − 0.0008; p = 0.0403) or previous smoking (− 0.0153; 95% CI − 0.0281, − 0.0026; p = 0.0182) were statistically significantly negatively correlated with baseline utility.
STEP 1 SF-6D for PortugalIn the FAS population of STEP 1, the estimated regression coefficients indicated that participants with higher BMI had lower baseline SF-6D scores, although the correlation was not statistically significant (Fig. 3).
Fig. 3
Regression model: predicted SF-6D (Portugal) utility score from STEP 1 vs. BMI. Red-colored area corresponds to the prediction interval for men; green-colored area is the prediction interval for women. BMI body mass index, SF-6D Short Form 6 dimension
The results of the regression model on baseline utility (SF-6D) are presented in Table 2. Only the presence of CAD at baseline (− 0.0228; 95% CI − 0.0420, − 0.0036; p = 0.0198) was statistically significant and negatively correlated with SF-6D versus those without CAD. All other factors were not statistically significant predictors of baseline utility. The estimated regression coefficients indicated that participants with prediabetes had smaller baseline utilities (− 0.0014; 95% CI − 0.0074, 0.0046; p = 0.6519) than those without prediabetes, older participants had higher baseline utilities (0.0001; 95% CI − 0.0002, 0.0004; p = 0.4519) than younger participants, men had higher baseline utilities (0.0028; 95% CI − 0.0038, 0.0094; p = 0.4118) than women, and participants with hypertension (− 0.0004; 95% CI − 0.0106, 0.0024; p = 0.2146) and current (− 0.0010; 95% CI − 0.0100, 0.0080; p = 0.8238) or previous smokers (− 0.0003; 95% CI − 0.0071, 0.0064; p = 0.9238) had lower baseline utilities than those without hypertension or never-smokers.
In the male subset of the FAS (Table 3), the presence of CAD at baseline (− 0.0303; 95% CI − 0.0555, − 0.0051; p = 0.0184) was the only factor with a statistically significant correlation (negative) with utility. In the female subset of the FAS (Table 4), no statistically significant correlation between the selected factors and baseline SF-6D utilities was identified.
Overall, based on the estimated relationship between baseline BMI and utility (Tables 3 and 4), it can be calculated that an additional unit of BMI (within the range of 30–40 kg/m2) was correlated with 0.0041 and 0.0031 lower EQ-5D-3L scores in SCALE, 0.0039 and 0.0047 lower EQ-5D-3L scores in STEP 1 and 0.0027 and 0.0020 lower SF-6D scores among men and women, respectively, assuming linearity of the relationship.
留言 (0)