
記住我
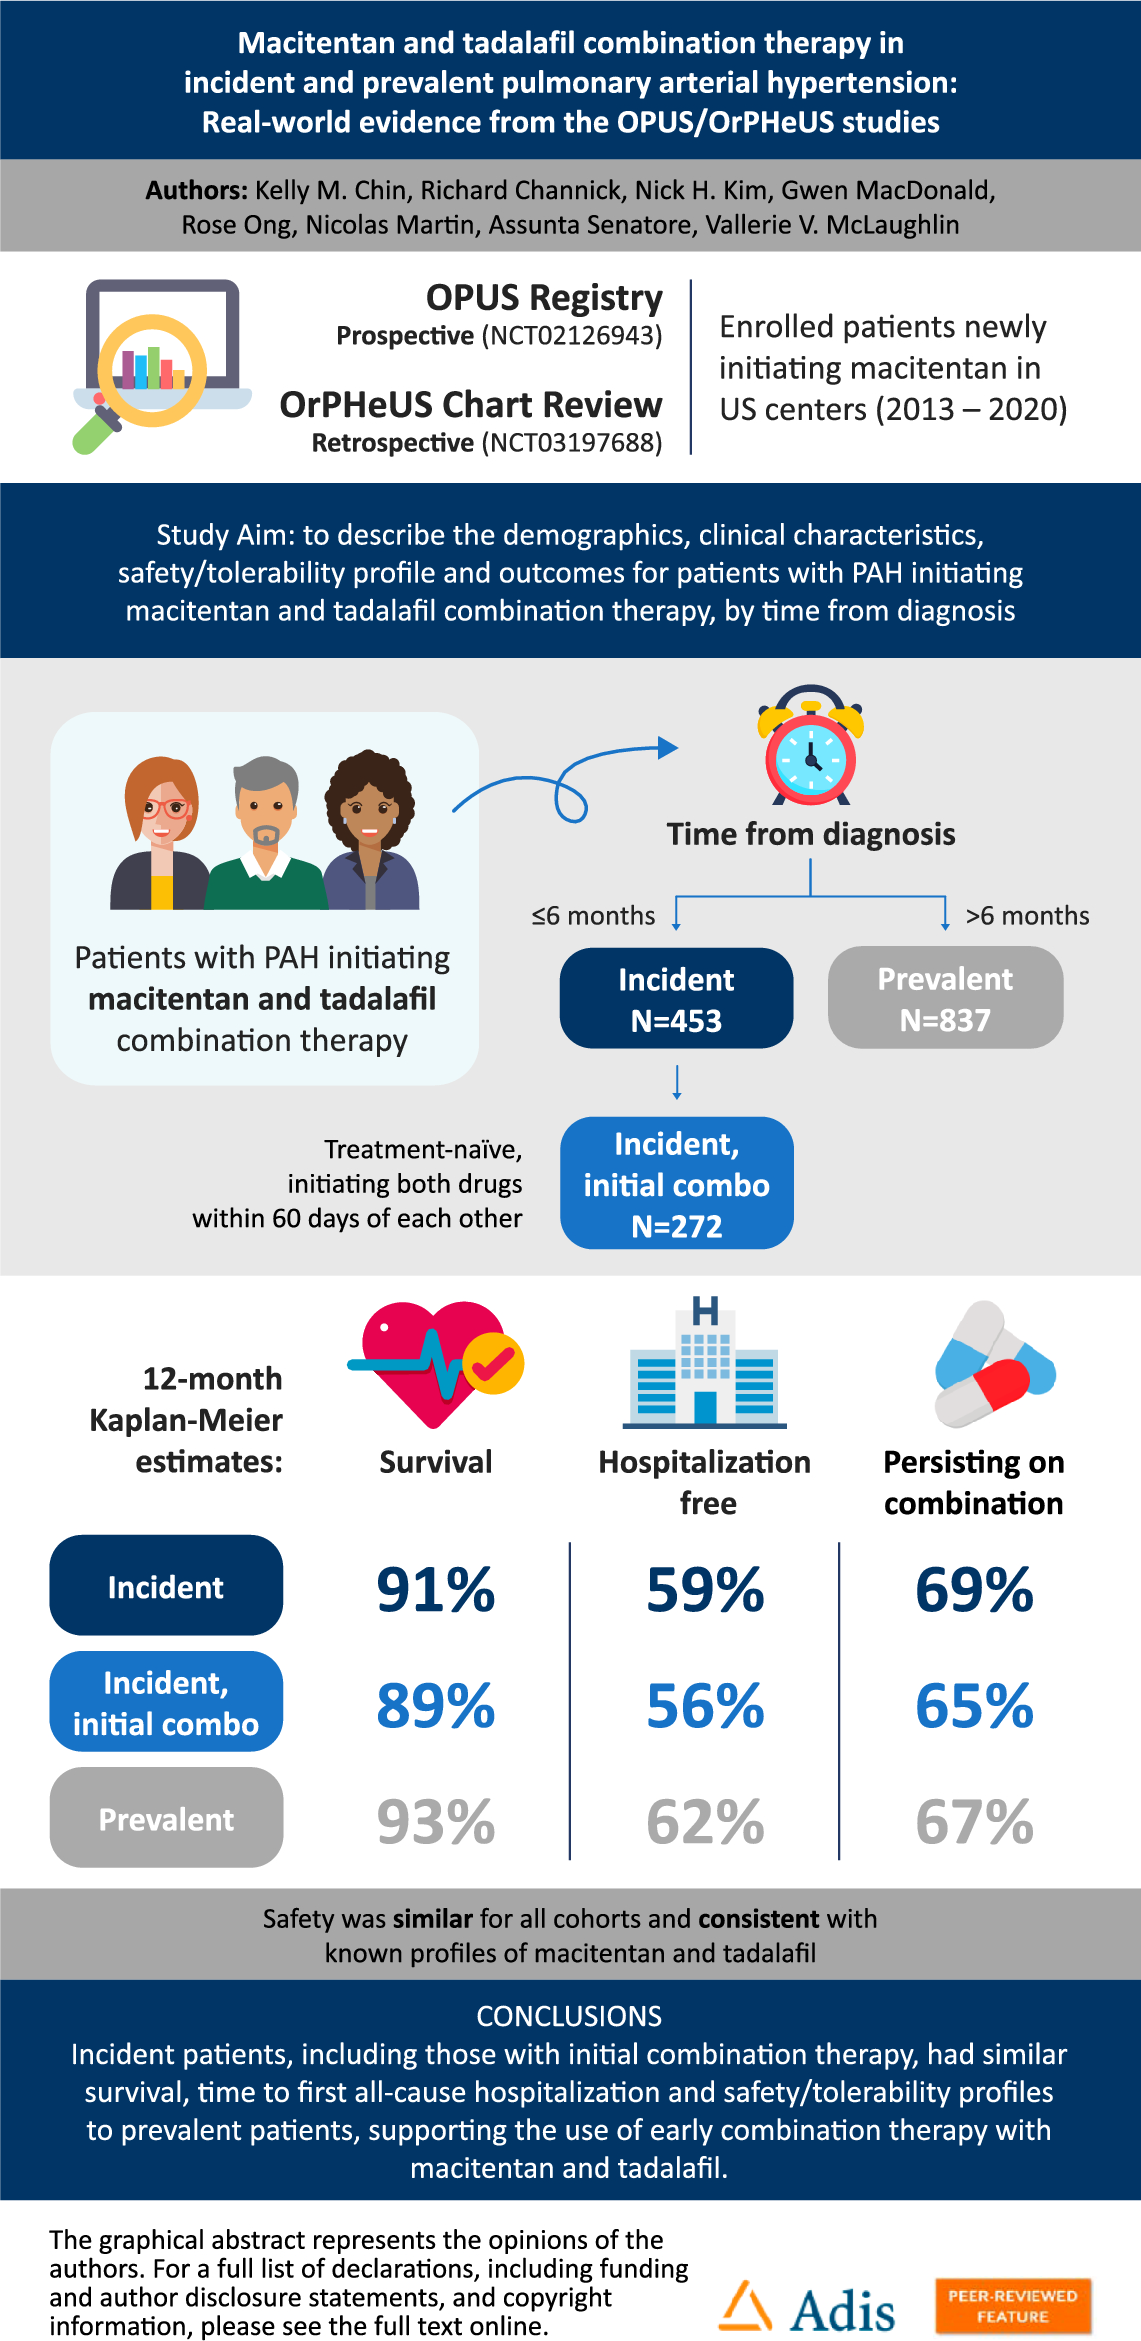


In the combined OPUS and OrPHeUS database [11], 4626 patients had a diagnosis of PAH (Fig. 1). In this analysis, there were 1336 patients with PAH who received macitentan and tadalafil double combination therapy (overall cohort); 453 (33.9%) were incident, of whom 272 (20.4%) were incident with initial combination, the remaining 181 incident patients had initiated combination therapy > 60 days apart or had a previous PAH-targeted therapy prior to initiating macitentan and tadalafil combination therapy and were not included as a separate subcohort. There were 837 (62.6%) prevalent patients and 46 patients were missing a time from diagnosis and were included in the overall cohort only. The majority of patients in all cohorts initiated tadalafil prior to macitentan (range 59.9–76.0%; Table S1).
Fig. 1
Patient disposition: 155 sites contributed to the combined OPUS and OrPHeUS database which contained n = 5654 patients at closure. a 46 patients did not have a time from diagnosis and were not included in the incident or prevalent data. b Time from diagnosis to initiation of combination M+T therapy ≤ 6 months. c Time from diagnosis to initiation of combination M+T therapy > 6 months. M+T macitentan and tadalafil combination therapy, PAH pulmonary arterial hypertension
Patient demographics and baseline characteristics at index date are reported in Table 1. At index date, the median [interquartile range (Q1, Q3)] age [overall cohort; 60 (49, 70)] and age distribution (Fig. S1) were similar across cohorts. The proportion of female patients (overall cohort; 76.0%) and race distribution (overall cohort; 75.7% white, 15.6% Black or African American) were also well balanced across all cohorts. The median (Q1, Q3) time from diagnosis to index was 1.8 (0.7, 3.5) months for the incident cohort, 1.1 (0.5, 2.0) months for the incident initial combination subcohort, and 36.9 (15.6, 70.9) months for the prevalent cohort. Compared to the prevalent cohort, the incident cohort and incident initial combination subcohort had a higher proportion of patients with PAH associated with connective tissue disease (CTD-PAH; 26.2% vs. 32.2% and 32.0%) or portal hypertension (PoPH; 4.3% vs. 6.2% and 6.3%), whereas the prevalent cohort had a higher proportion of patients with PAH associated with congenital heart disease (CHD-PAH; 7.8% vs. 3.1% and 1.8%). Compared to the prevalent cohort, the incident cohort and incident initial combination subcohort had higher proportions of patients with diabetes (19.6% vs. 26.0% and 25.4%), obesity (20.4% vs. 23.8% and 25.4%), and edema (17.9% vs. 23.8% and 26.1%), and fewer with anemia (17.9% vs. 12.6% and 12.5%).
Table 1 Demographics and baseline characteristics at index dateInformation on PAH severity at index date is presented in Table 2 (missing data ranging from 50.1 to 60.7% in the overall cohort; summarized in Table S2). For those with data, versus prevalent patients, incident and incident initial combination patients had a lower median 6-min walk distance [6MWD; 332 m (n = 354) vs. 274 m (n = 166) and 268 m (n = 93)], worse World Health Organization functional class [WHO FC; III/IV: 58.2% (n/N = 234/402) vs. 72.5% (n/N = 185/255) and 74.2% (n/N = 115/155)], were more likely to be in the high-risk brain natriuretic peptide/n-terminal pro-brain natriuretic peptide (BNP/NT-proBNP) category [26.7% (n/N = 82/307) vs. 42.9% (n/N = 88/205) and 46.2% (n/N = 54/117)], and had more severe hemodynamics, including higher median pulmonary vascular resistance [6.6 Wood Units (WU) (n = 244) vs. 8.1 WU (n = 283) and 8.7 WU (n = 178)] and higher median mean pulmonary arterial pressure [44 mmHg (n = 276) vs. 46 mmHg (n = 331) and 48 mmHg (n = 206)].
Table 2 Measures of PAH severity at index dateTreatment PatternsThe breakdown of PAH-targeted therapy prior to and at index is shown in Table 3, with the specific combinations at index shown in Table S3. At least one prior PAH-targeted therapy was reported for 11.0% of incident and 33.5% of prevalent patients. The median (Q1, Q3) time from diagnosis to initiation of the first drug in the macitentan and tadalafil combination was 0.4 (0.0, 1.2) months, 0.4 (0.0, 1.3) months, and 8.2 (0.9, 34.9) months for incident, incident initial combination, and prevalent patients, respectively. The median (Q1, Q3) time from first drug to initiation of the second drug in the combination (i.e., index date) was 0.9 (0.2, 2.6) months, 0.4 (0.1, 0.9) months, and 16.0 (6.0, 36.9) months, for incident, incident initial combination, and prevalent patients, respectively. At index, the majority of patients were receiving macitentan and tadalafil; for those who were taking another PAH-targeted therapy, a prostacyclin pathway agent (PPA) was the most common in all cohorts (intravenous/subcutaneous [range 4.4–15.1%] and oral/inhaled [range 0−15.9%)]. For patients who escalated therapy during follow-up, the majority in all cohorts initiated an oral or inhaled PPA (Table 3). KM estimates of time to therapy escalation are shown in Fig. 2. The median (Q1, Q3) number of months for escalation from first to second drug of the macitentan and tadalafil combination was 0.9 (0.2, 2.6), 0.4 (0.1, 0.9), and 16.0 (6.0, 36.9), and from macitentan and tadalafil combination to next PAH-targeted therapy was 5.2 (1.8, 11.6), 3.4 (1.0, 7.1), and 8.2 (3.5, 16.2), for incident, incident initial combination, and prevalent patients, respectively.
Table 3 PAH-targeted therapies prior to and at index and at follow-upFig. 2
KM estimates of escalation from a first to second drug of the macitentan and tadalafil combination and b macitentan and tadalafil combination therapy to additional PAH-targeted therapy. CL confidence limits, KM Kaplan–Meier, M+T macitentan plus tadalafil combination, PAH pulmonary arterial hypertension
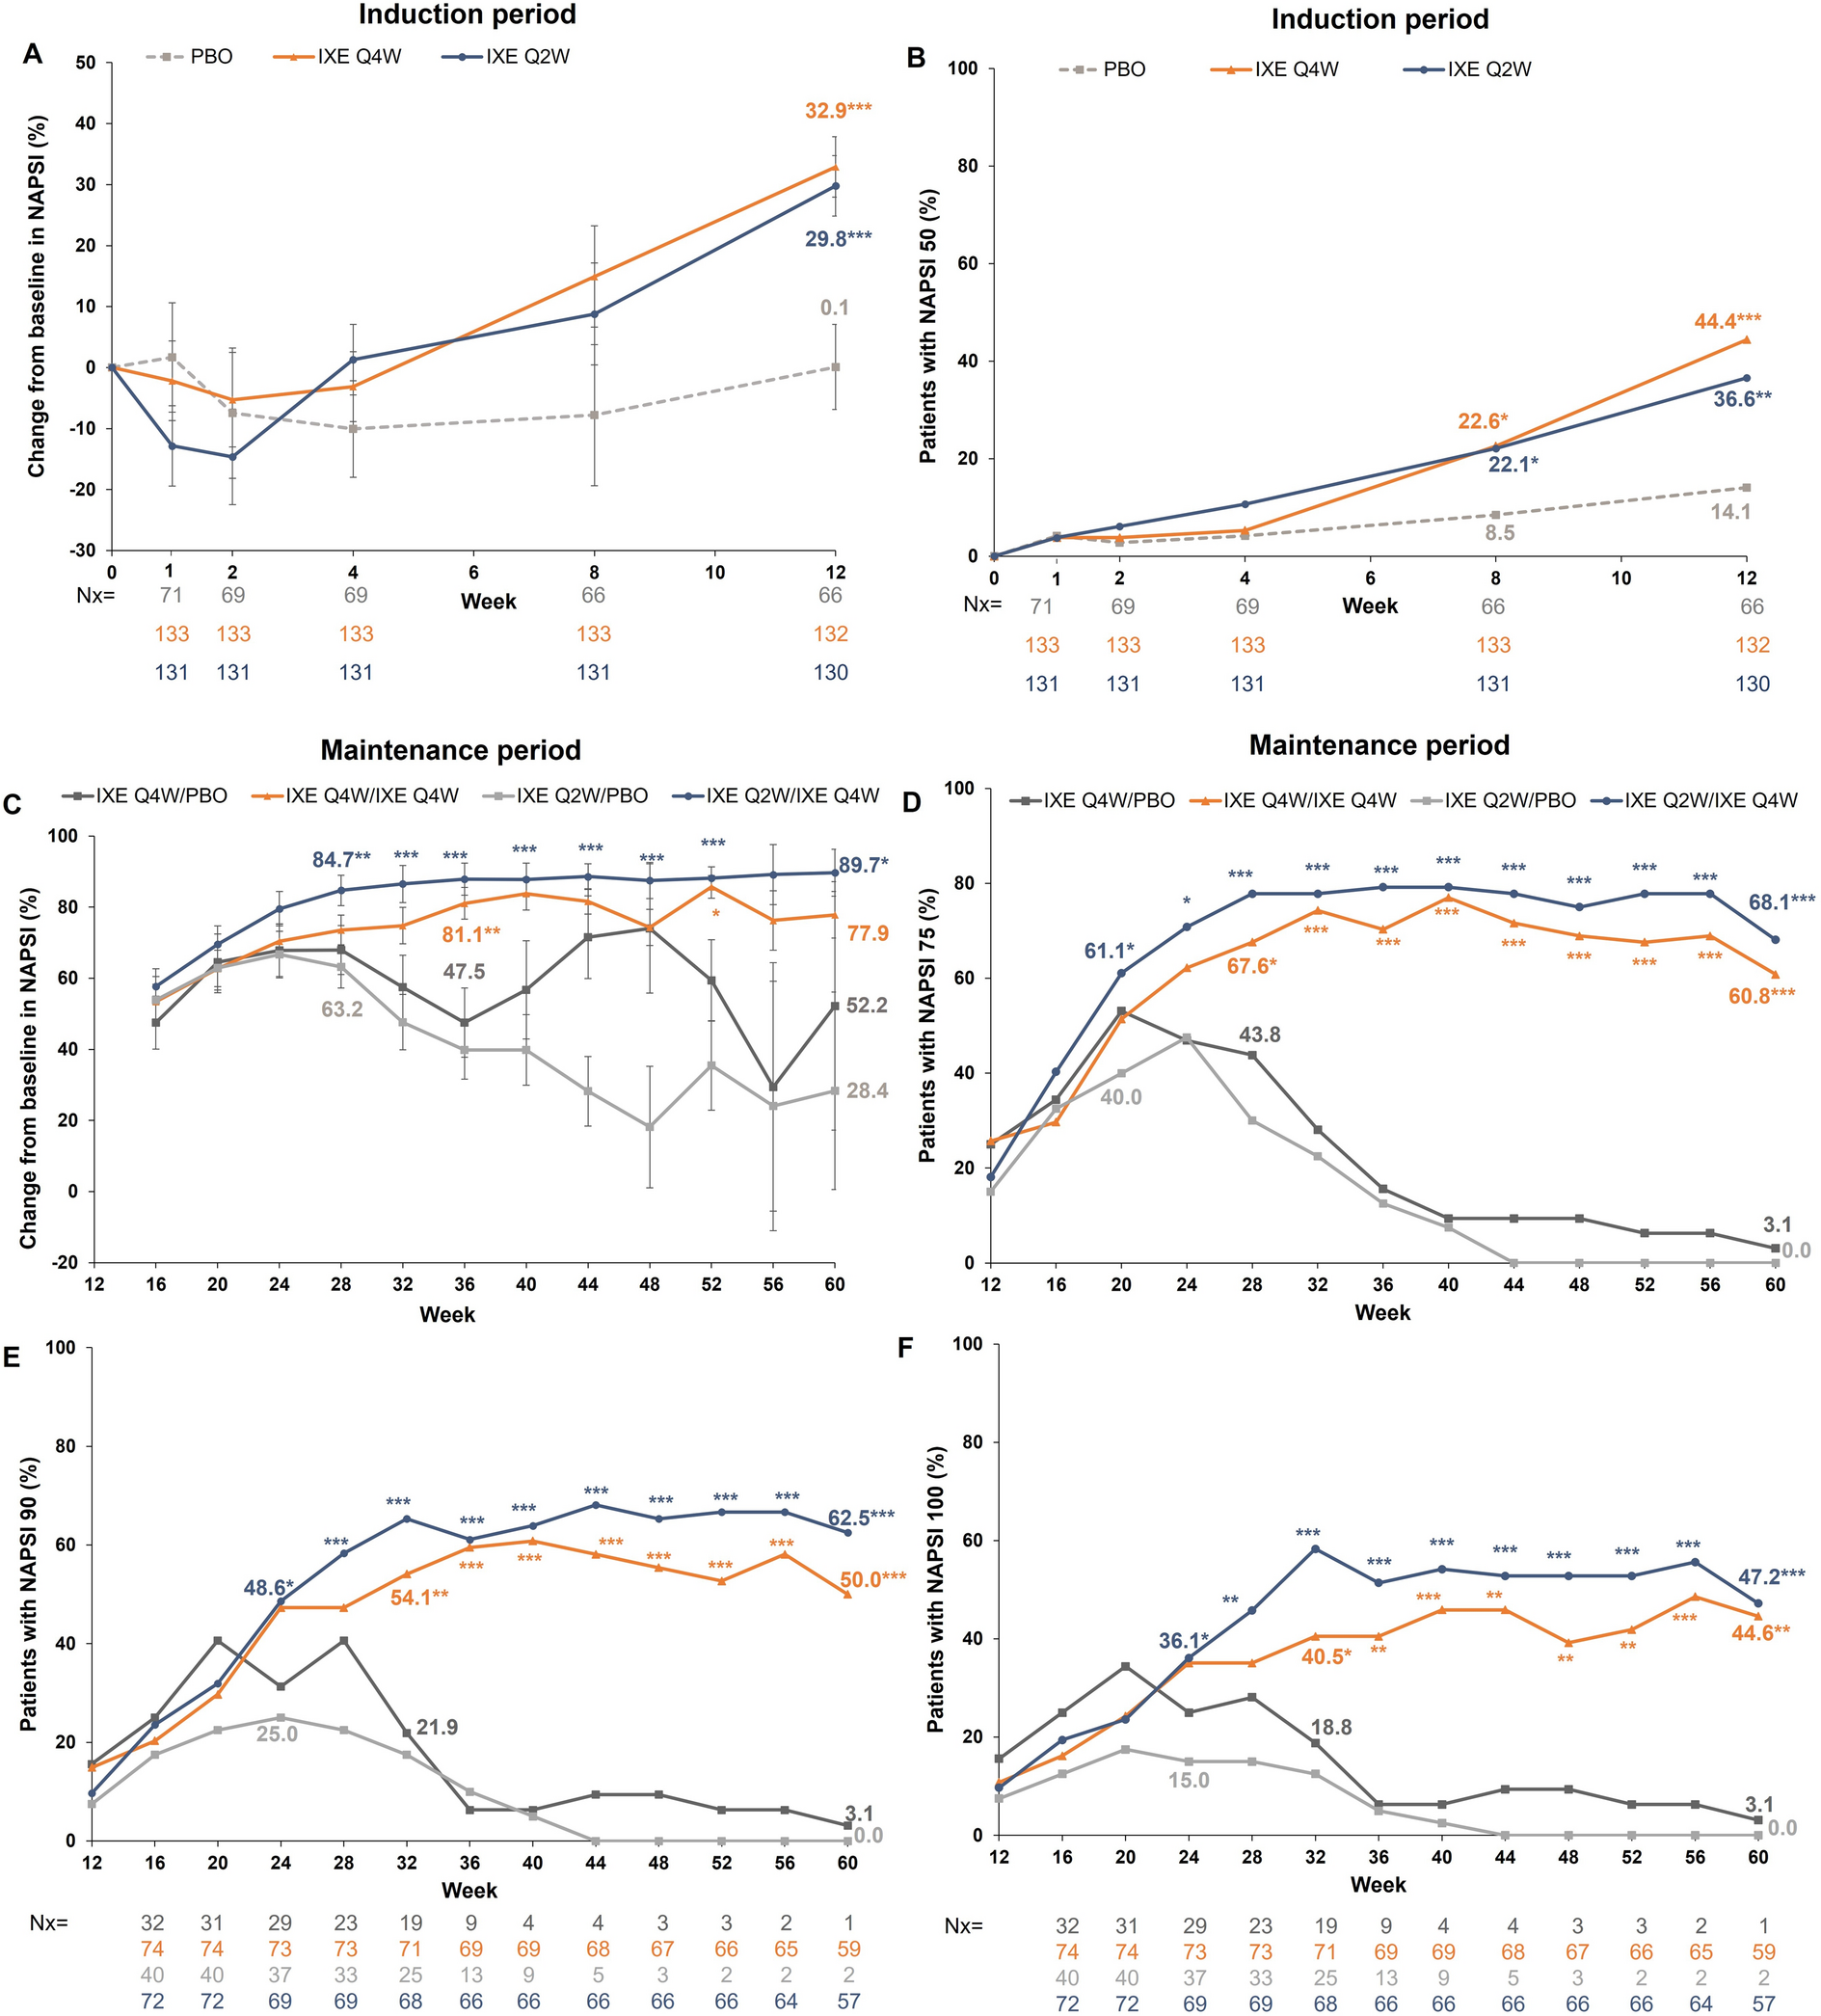
Survival and HospitalizationsThe median (Q1, Q3) exposure to macitentan and tadalafil combination therapy was similar between the cohorts, at 14.2 (4.2, 27.5), 12.2 (3.2, 25.5), and 14.7 (4.5, 28.0), months for the incident, incident initial combination, and prevalent patients, respectively. The 12-month KM estimates (95% CL) of survival were 91.2% (87.7, 93.7) in the incident, 88.5% (83.2, 92.2) in the incident initial combination, and 92.9% (90.6, 94.6) in the prevalent cohorts; the 24-month KM estimates were 83.7% (78.5, 87.7), 81.1% (73.7, 86.7), and 84.9% (81.4, 87.7), respectively (Table 4; Fig. 3). The proportion of patients who experienced an all-cause hospitalization, as well as the incidence rate (per person-year, 95% CL), was similar in the incident [45.7%, 0.47 (0.39, 0.57)], incident initial combination [44.9%, 0.51 (0.41, 0.65)], and prevalent [41.5%, 0.39 (0.34, 0.45)] cohorts (Table 4). The 12-month KM estimates (95% CL) for patients free from hospitalization were 59.4% (54.1, 64.4) in the incident, 56.3% (49.1, 62.9) in the incident initial combination, and 62.3% (58.5, 65.9) in the prevalent cohorts; the 24-month KM estimates were 40.4% (34.5, 46.2), 39.5% (31.7, 47.1), and 49.1% (44.7, 53.3), respectively (Table 4; Fig. 4).
Table 4 Survival and hospitalizationsFig. 3
KM estimates of survival from macitentan plus tadalafil combination initiation; the y-axis has been truncated at 30%. CL confidence limits, KM Kaplan–Meier, M+T macitentan plus tadalafil combination
Fig. 4
KM estimates of time from macitentan plus tadalafil combination initiation to first all-cause hospitalization; the y-axis has been truncated at 30%. CL confidence limits, KM Kaplan–Meier, M+T macitentan plus tadalafil combination
Safety and TolerabilitySafety data are presented in Table 5. In OPUS, the proportions of patients experiencing an AE (range 77.8–80.3%) or SAE (range 48.1–49.7%) were similar between all cohorts, but with a higher AE incidence rate (per person-year, 95% CL) in the incident initial combination [1.82 (1.38, 2.39)] compared to the incident ([1.46 (1.15, 1.84)] and prevalent cohorts [1.37 (1.10, 1.70)] (Table 5). The most common AEs were dyspnea, headache, and anemia in the incident cohort, dyspnea, headache, anemia, and hypoxia in the incident initial combination subcohort, and dyspnea, headache, and nausea in the prevalent cohort (Table 5). There was a higher proportion of patients in the incident cohort (14.8%) and incident initial combination (13.6%) subcohort who experienced an AESI (grouped terms) of anemia/hemoglobin decrease compared to the prevalent (7.1%) cohort, whereas the proportions of patients with an AESI of edema or hepatic events were similar between the cohorts (ranges 26.3–28.2% and 4.7–8.5%, respectively; Table 5).
Table 5 Adverse events and discontinuationsThe proportion of patients that discontinued combination therapy for any reason during the observation period was 47.5%, 50.0% and 47.3% in the incident, incident initial combination subcohort and prevalent cohorts (Table 5); the 12-month KM estimates (95% CL) for patients persisting on combination therapy were 68.6% (63.9, 72.8), 65.0% (58.8, 70.6), and 66.9% (63.5, 70.0), respectively (Table 5). The proportion of patients discontinuing macitentan, tadalafil, or both drugs, as well as the reasons for macitentan discontinuation (not collected for tadalafil), are presented in Table S4. Of patients discontinuing macitentan (range 34.9–36.8%), roughly the same proportion discontinued due to an AE (range 13.9–15.4%) versus another reason (range 13.6–15.1%), in all cohorts.
留言 (0)