Materials
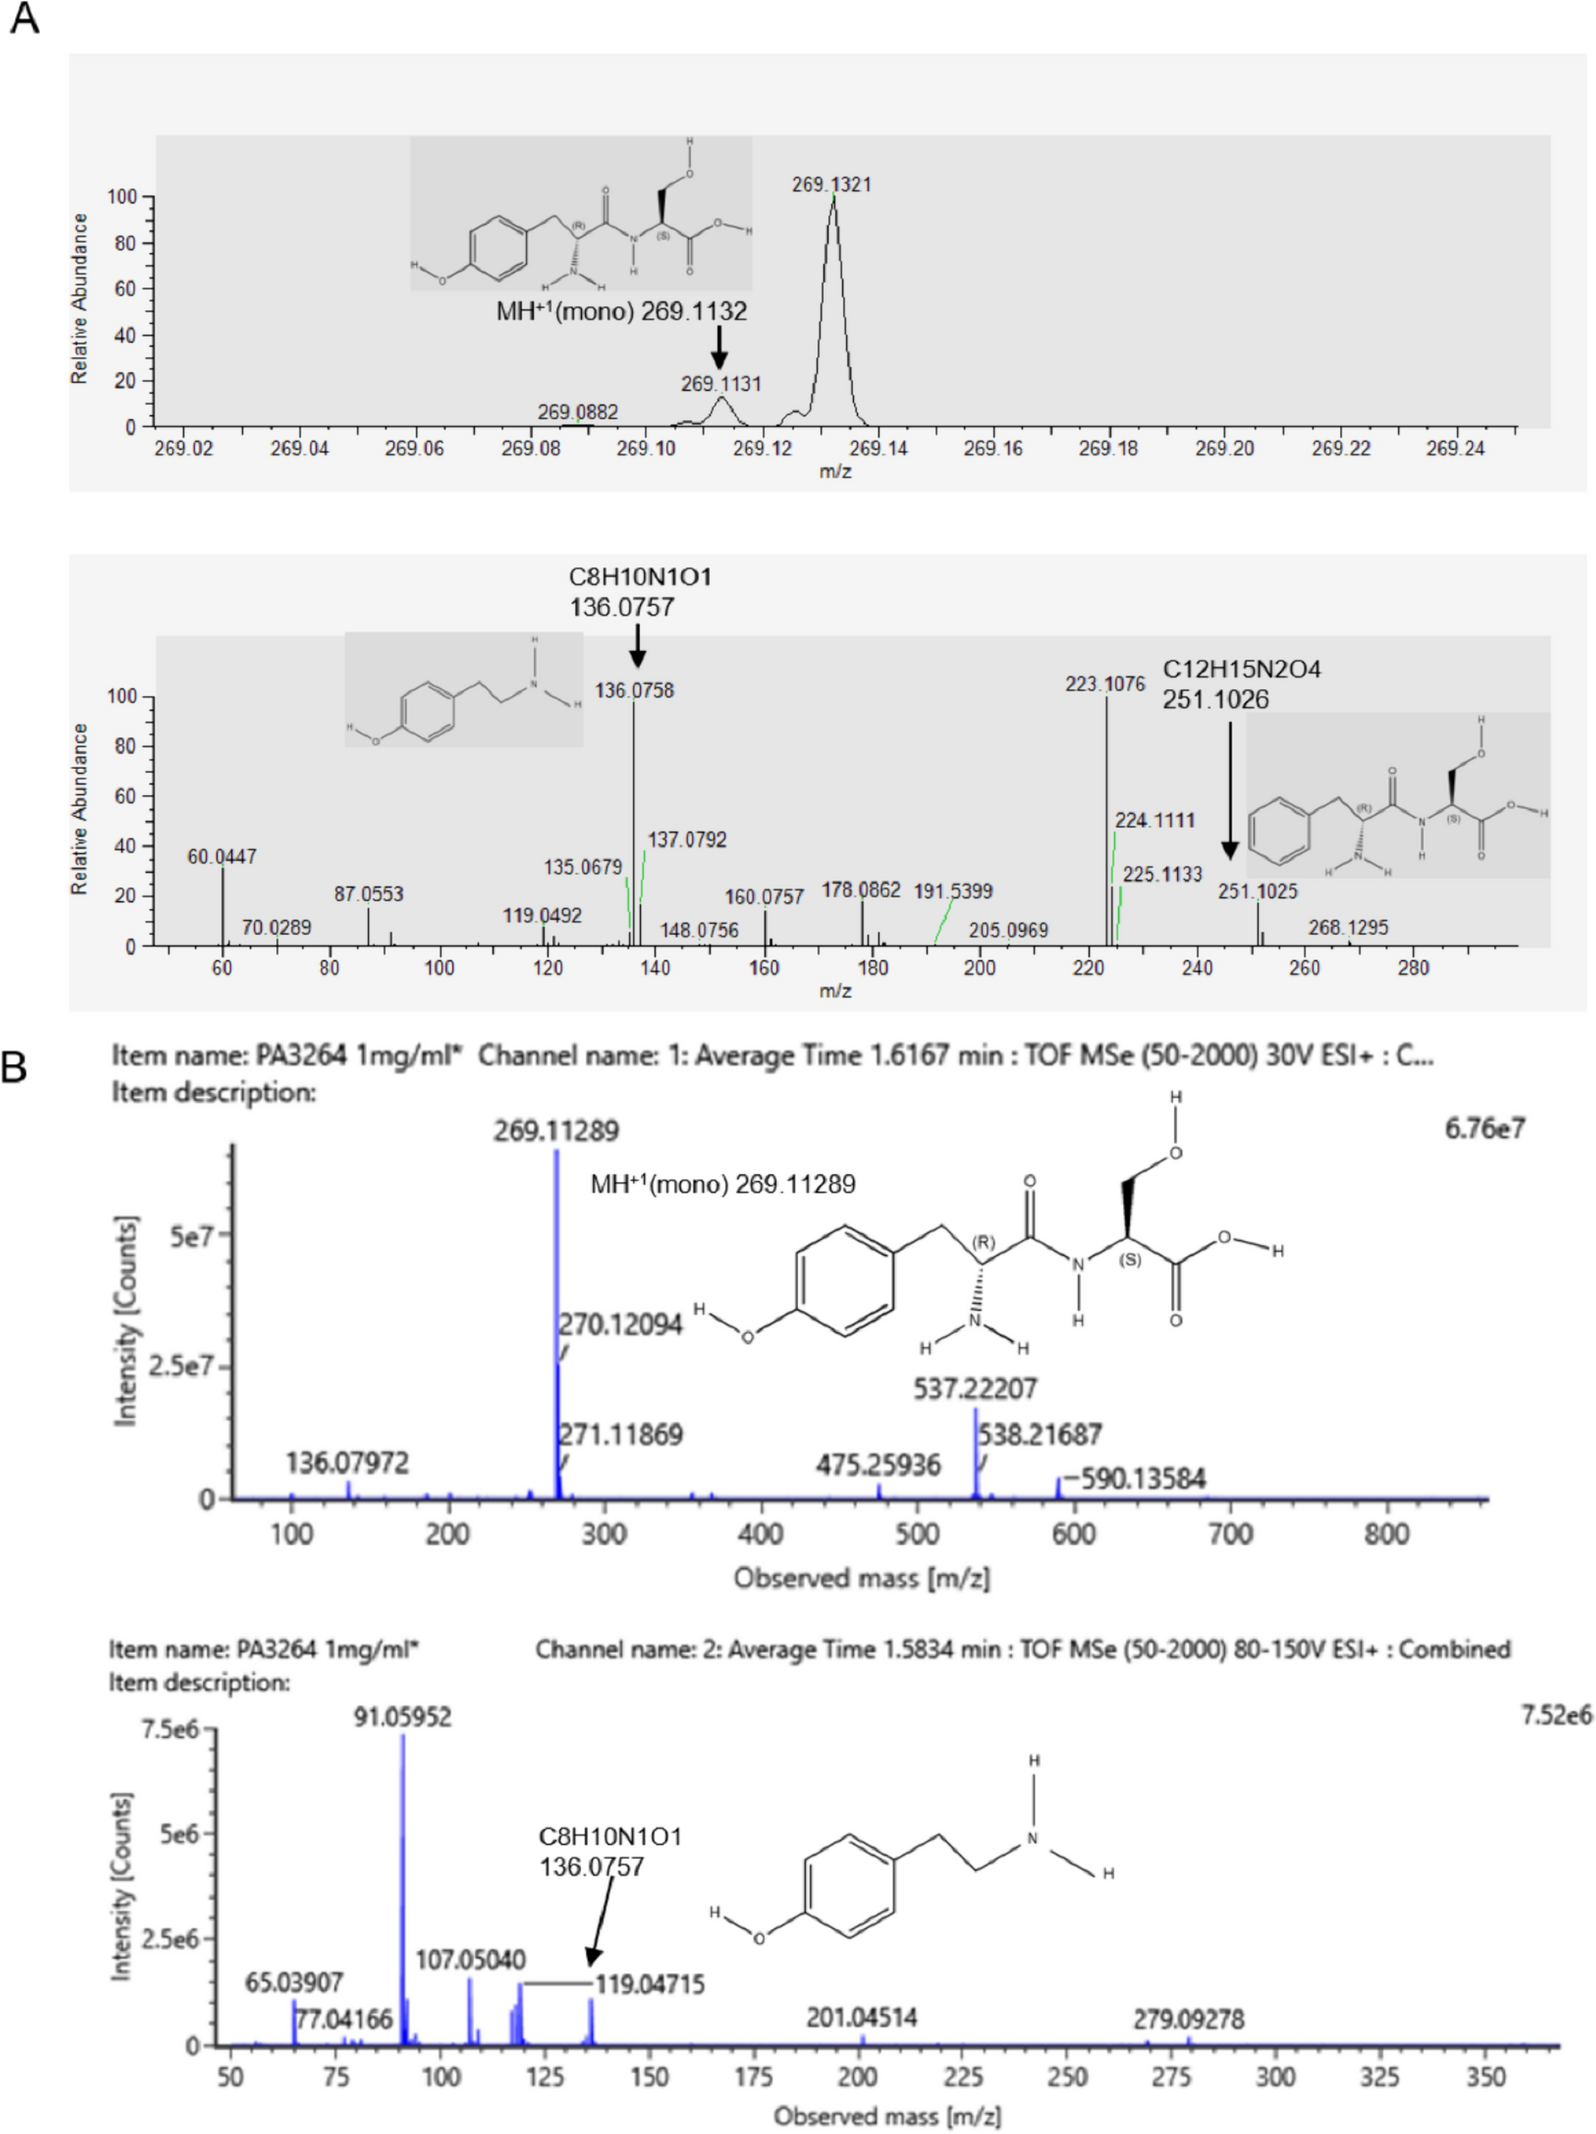
D-Tyrosine-L-serine (PA3264) was synthesized and purified by GenScript Company (C216JHB100_5, NJ, USA). The HPLC purity was ≥ 98.0%. The peptide was soluble in ddH2O and stored at −20 °C. A patent application was filed for the compound (Chinese patent application for authorization No.: CN 114315958 B).
UPLC-MS/MS analysis of PA3264 from Squama Manis
Squama Manis was obtained from Fifth Medical Center of Chinese PLA General Hospital and identified by Xiaohe Xiao professor. A Vanquish Flex UPLC system (Thermo Scientific, MA, USA) interfaced with a Q Exactive Focus mass spectrometer (Thermo Scientific) was used for UPLC-MS/MS analysis [13,14,15]. The following UPLC condition was used: The chromatographic column a Thermo Scientific Accucore HILIC column (2.1 × 100 mm, 2.6 μm, Part No.: 17526–102130); and an eluent of 10 mM ammonium acetate in 10% acetonitrile (A) and 10 mM ammonium acetate in acetonitrile (B) with the following gradient elution system: 25% A and 75% B in 0–6 min, then 45% B in 6–7 min, 30% B in 7–10.1 min, 75% B in 10.1–22 min at an eluent flow rate of 0.3 mL/min. The column temperature was maintained at 40 °C. The total running time was 22 min. An injection volume of 5 μL was used for each sample. The optimized parameters of MS were as follows: Spray voltage, 3.8 kV; Aux gas heater temperature, 350 °C; Sheath gas flow rate, 45 arb; Aux gas flow rate, 15 arb; Capillary temperature, 320 °C; S-lens RF, 60 V; scan mode: (1) full MS: resolution: 70, 000; automatic gain control target: 1.0e6; maximum injection time: 100 ms; scan range: 133.4–2000 m/z; (2) dd-MS2: resolution: 17500; automatic gain control target: 1.0e5; maximum injection time: 50 ms; loop count: 3; isolation window: 2.0 m/z; NCE/stepped: 20 40 60; dynamic exclusion: 8 s.
Cell cultures
The breast cancer cell lines MDA-MB-231 and 4T1 were obtained from ATCC and maintained in high-glucose Dulbecco Modified Eagle Medium (DMEM) and RPMI 1640 medium supplemented with 100 U/mL penicillin, 100 µg/mL streptomycin (all from BOSTER, Beijing, China), and 10% fetal bovine serum (C04001-500, VivaCell, Beijing, China) in a humidified atmosphere of 5% CO2 at 37 °C for serial passaging. The cells were harvested during the logarithmic growth phase for subsequent experiments. The cells were frozen in a serum-free cell freezing medium (03.17004DA, EallBio, Beijing EallBio Biomedical Technology Co., Ltd, China).
Mice
Female BALB/c mice (6–8 weeks old; 18–20 g) were purchased from SPF Biotechnology Co., Ltd. (Beijing, China) and housed in a standard pathogen-free (SPF) standard room. Six-week-old female supra-immunodeficient NCG-hIL15 mice were purchased from GemPharmatech (Jiangsu, China) and were maintained in microisolator cages under pathogen-free conditions. Laboratory animal production license: SCXY (Jing) 2019-0010, Laboratory animal production license: SCXK (Su) 2020–0004. All mice were given free access to standard laboratory chow and water ad libitum for the experiment with a 12-h light–dark cycle at a temperature of 21–25 °C. Protocols for animal experiments were approved by the guidelines for the care and use of laboratory animals. All experiments were performed under the approved guidelines of the Animal Ethics Committee of the Fifth Medical Center, Chinese PLA General Hospital (IACUC-2023-0014).
Tumor challenge and treatment experiments
4T1 orthotopic tumors were induced via subdermal inoculation of 2 × 10⁵ 4T1 early passage cells suspended in 100 μL of PBS into the 4th mammary fat pad of BALB/c females, as described previously [16]. At 1-week post-inoculation (tumors were palpable around 15 mm3), the animals were randomly distributed into the control and treatment groups. PA3264 (100 mg/kg) was administered intraperitoneally (i.p.) once daily. Cisplatin (HY-17394, MedChemExpress, NJ, USA) was used as the positive control (2 mg/kg, once every 4 days) [17]. Animal body weight and tumor growth were measured three times per week. Tumor volume was calculated using the following equation: 0.5 × length × width2 [18]. At the end of the experimental period, the mice were sacrificed, and the remaining tumors were harvested for weighing and other experiments.
The humanized PBMC-CDX mouse model was established previously [19, 20]. MDA-MB-231 tumor cells were subcutaneously inoculated into tumor-donor mice. After the tumors grew, tumors with a volume of approximately 500–1000 mm3 were removed under aseptic conditions, cut into tumor masses of approximately 8 mm3, and inoculated subcutaneously in the right flank of experimental mice with a cannula needle. Each mouse was injected with a tumor mass. Three days after tumor inoculation, healthy adult PBMCs were inoculated into the mice by resuspension in PBS at an inoculation rate of 2 × 10⁶/mouse. Tumors were administered in groups when they grew to approximately 50–70 mm3 (Day10). PA3264 was intraperitoneally injected at a dose of 50 mg/kg for 21 days.
Histology and immunohistochemistry (IHC)
Tumor samples were fixed in 4% paraformaldehyde and then dehydrated and embedded with paraffin for H&E staining. Proteins in tumor tissues were also assessed by immunohistochemistry assay. Tissue sections (4 μm) were deparaffinized, rehydrated, and antigen-repaired. After blocking, anti-Ki67 (Abcam, ab16667, 1:100) and Caspase 3 (Bioss, bs-0081R, 1:100) were incubated overnight at 4 °C. The corresponding secondary antibody was incubated for 1 h. Finally, sections were stained with 3,3'-diaminobenzidine (DAB, BOSTER, AR1022), counter-stained with hematoxylin, dehydrated with gradient ethanol, cleared with xylene, sealed with neutral gum, observed, and photographed under an Eclipse microscope (Nikon Corporation). The proportion of positively stained area was analysed using Image J by calculating the positive areas in the total cells [21, 22].
Transcriptome sequencing (RNA-seq) analysis
Total RNA was extracted from the samples and enriched with oligo (dT)-attached magnetic beads. The synthesized and purified double-stranded cDNA was subjected to end repair and 3'-adenylation. Sequencing adapters were connected to the ends of these 3′ adenylated cDNA fragments, and the selected fragments were amplified by PCR and qualified using an Agilent 2100 Bioanalyzer (Agilent Technologies, Santa Clara, CA, USA). Libraries were constructed using the VAHTS Universal V6 RNA-seq Library Prep Kit according to the manufacturer’s instructions after the quality inspection was completed. Sequencing was performed using Illumina HiSeqTM 2500. Differential expression analysis was performed using the DESeq2. A Q value < 0.05 and foldchange > 2 or foldchange < 0.5 was set as the threshold for significantly differentially expressed genes (DEGs). Transcriptome sequencing and analysis were performed by OE Biotech Co. Ltd. (Shanghai, China) using standard procedures.
Molecular docking
Molecular docking was performed using Schrödinger Suite Release 2018-1 [23, 24]. PI3Kγ, AKT1, and NF-κB p65 proteins were used as receptors, and PA3264 was used as a ligand. Three-dimensional crystal structures of PI3Kγ (PDB ID: 4HVB), AKT1 (PDB ID: 4EKL), and NF-κB p65 (PDB ID: 1NFI) were retrieved from the RCBS PDB database. This structure was optimized before docking using Protein Preparation Wizard in Maestro 11.5. The docking of the receptor (target) preparation involves the deletion of water molecules from target proteins, removal of protein polymorphisms, complementation of non-complete amino acid residues, and hydrogenation of proteins, followed by lattice-box construction of each target protein. LigPrep was used to convert structures from 2-dimensional to 3-dimensional, correction improper bond distances and bond orders, generating ionization states, and minimizing energy. The processed protein and ligand structures were subjected to docking analysis. Finally, docking scores were calculated to evaluate the binding activity between the ligand and three targets. The display diagram of the molecular docking results was modified using PyMOL.
Cell viability assay
To assess the effects of PA3264 on cell viability, 1.5 × 10⁵ MDA-MB-231 and 9.0 × 10⁴ 4T1 cells per well in 96 well plates were incubated for 12 h. The medium was then replaced with different PA3264 concentrations (0, 0.078, 0.156, 0.313, 0.625, 1.25, 2.5, 5, 10, and 20 mg/mL) for the indicated times. Cell viability was measured using the CCK-8 assay kit (G4103-5ML, Servicebio, Wuhan, China) according to the manufacturer’s instructions. The optical density (OD) values used as the index of cell viability were measured at 450 nm using a microplate reader, and the IC50 values were calculated as described previously [21]. Lactate dehydrogenase (LDH) is a stable cytoplasmic enzyme in all cells. LDH is rapidly released into the cell culture supernatant when the plasma membrane is damaged, a key feature of cells undergoing apoptosis, necrosis, and other forms of cellular damage [25]. The LDH release assay was performed using the LDH Cytotoxicity Assay kit (G1610-100 T, Servicebio, Wuhan, China), according to the manufacturer's protocols.
Colony formation assay
To assess clonogenic ability, single cell suspensions containing 2 × 10³ MDA-MB-231 and 4T1 cells were seeded in 12-well plates and allowed to adhere for 24 h, and treated with PA3264 for 5 days. The cells were fixed in 4% paraformaldehyde and stained with crystal violet. Finally, the colonies were quantified using the ImageJ software.
Wound healing assay
A total of 2 × 10⁵ cells were seeded in the wells of a 12-well plate for 24 h. The cell layer was scratched using a sterile pipette tip (200 µL). Subsequently, cells were cultured with the indicated concentrations of PA3264. Representative images of the wounds were taken at 0 and 24 h using an Eclipse microscope (Nikon Corporation, Tokyo, Japan). Each experiment was conducted in triplicate.
Quantitative real-time PCR (qRT-PCR)
Total RNA was extracted using TRIzol reagent (Alcatel, Beijing, China), and the isolated RNA was reverse-transcribed into cDNA using StarScript III All-in-one RT Mix with gDNA Remover (GenStar, Beijing, China). Primer sequences used are listed in Table 1. Quantitative real-time PCR was performed on a QuantStudio 6 (96-well format, Thermo Fisher, USA) using SYBR Green qPCR Master Mix (Low ROX) (GenStar, Beijing, China). The PCR conditions were as follows: 95 °C for 5 min, followed by 40 cycles of 95 °C for 10 s, and 60 °C for 60 s. The expression levels of these genes were normalized to that of β-actin. The data were analyzed and displayed using the ΔΔCt or 2−ΔΔCt method.
Western blotting
Cell lysates were collected using RIPA buffer [50 mM Tris–HCl, 150 mM NaCl, 1% sodium deoxycholate, and 1% Triton-100, pH 7.45]. Protein denaturation was performed before loading at 100 °C for 15 min. Proteins were separated using 10% SDS-PAGE and transferred to PVDF membranes (Millipore Corp., Bedford, MA, USA). Membranes were then blocked with 5% skim milk for 1 h and exposed to the primary antibodies with an appropriate dilution at 4 °C overnight: p-PI3K (Abcam, ab278545,1: 1500), PI3K (ZENBIO, R22768, 1: 2000), p-AKT (Cell Signaling Technology, 4060 T, 1: 2000), AKT1 (HUABIO, ET1609-47, 1: 1500), p-p65 (Abcam, ab76302, 1: 1500), p65 (Cell Signaling Technology, 8242S, 1: 1000), Cyclin D1 (Abcam, ab134175, 1: 5000). HSP90 (ZENBIO, 251211, 1:2000) was used as the internal control. Membranes were subsequently probed with anti-mouse or anti-rabbit IgG antibodies conjugated to horseradish peroxidase (Transduction Laboratories, Lexington, KY, USA) and visualized using enhanced chemiluminescence (ECL, E422-02, Vazyme, Nanjing, China).
Quantification and statistical analysis
Two-tailed unpaired Student’s t-test was used to compare two groups. Multiple groups were tested using a one-way analysis of variance (ANOVA). Two-factor ANOVA was used for tumor growth analysis. All data are presented as mean ± SEM. Data were processed using GraphPad Prism version 9 (GraphPad Software). In all cases, p values of 0.05 and below were considered to be statistically significant: p < 0.05 (*), p < 0.01 (**), and p < 0.001 (***) were considered statistically significant. Detailed information regarding the number of replicates can be found in the figure legend.


留言 (0)