Bioinformatics analysis of AGAMicroarray dataset acquisition
The gout gene microarray datasets of AGA were retrieved from the GEO database (https://www.ncbi.nlm.nih.gov/geo) using the keywords "Gouty arthritis" or "Gout", Selecting the species as "Homo sapiens" or "Mus musculus", three datasets, including GSE160170, GSE178825, and GSE190138, were obtained. Both GSE178825 and GSE160170 utilized human peripheral blood mononuclear cells (PBMC) as the research tissue, and GSE190138 used C57 mouse ankle joint, dorsal root ganglion (DRG), and spinal cord as research tissues.
Data processing and identification of differentially expressed genes
Network Analyst3.0 (https://www.networkanalyst.ca/) [14], an online data analysis website based on R language, was used to screen differential expressed genes (DEGs) in the AGA and control groups. The DEGs were screened based on the criteria P < 0.05 and |log2FC|> 1.5.
Pathway enrichment analysis
Signal pathway enrichment of DEGs was performed based on Gene Ontology (GO, http://www.geneontology.org) [15] and the Kyoto Encyclopedia of Genes and Genomes (KEGG, http://www.genome.jp/kegg/) database [16]. The DEGs were imported into the DAVID database (DAVID 6.8, http://david.ncifcrf.gov) [17] and P < 0.05 was considered to be statistically significant. The GSEA included all genes in the dataset and helped to select significantly enriched sets of genes, using the R package "clusterProfiler". The top 10 enrichment results were visualized using the "ggplot2" package in R, with P < 0.05 as the screening criterion.
WGCNA
Weighted gene co-expression network analysis of co-expressed genes was performed using the WGCNA package in the R software [18]. The pickSoft threshold function was used to estimate a suitable soft threshold β, which was used to construct a network that fitted the characteristics of a scale-free network. Hierarchical clustering was performed using the ‘hclust’ function, and the dynamic tree cut algorithm was used to identify gene modules. Next, gene significance (GS) and module membership (MM) were calculated and the modules were associated with clinical traits by setting the parameters |MM|> 0.8 and |GS|> 0.1 to screen for genes.
Identification of the composition SGsMaterials and reagents
Shirebi granules (SGs; Lot. 210 602) was obtained from Liaoning Good Nurse Pharmaceutical (Group) Co., Ltd. The composition ratio of SGs included 108 g of Atractylodes rhizome [from Atractylodes lancea (Thunb.) DC.], 108 g of Phellodendri chinensis cortex [from Phellodendron chinense C.K.Schneid.], 162 g of Forsythiae fructus [from Forsythia suspensa (Thunb.) Vahl], 162 g of Dioscoreae hypoglaucae rhizome [from Dioscorea hypoglauca Palibin], 216 g of Coicis semen [from Coix lacryma-jobi L.var.ma-yuen (Roman.) Stapf], 162 g of Stephaniae tetrandrae radix [from Stephania tetrandra S.Moore], 216 g of Mori ramulus [from Morus alba L.], 108 g of Saposhnikoviae radix [from Saposhnikovia divaricata (Turcz.) Schischk.], 129 g of Clematidis radixet rhizome [from Clematis chinensis Osbeck], 216 g of Lonice raejaponicae caulis [from Lonicera japonica Thunb.], 108 g of Pheretima [from Pheretima aspergillum (E.Perrier)] and 162 g of Cyathulae radix [from Cyathula officinalis K.C.Kuan]. The names of the medicinal materials were checked using http://www.worldfloraonline.org on April 20, 2024. The SGs were prepared as follows: first, volatile oils were extracted from Atractylodes rhizome, Forsythiae fructus and Saposhnikoviae radix. The remaining nine herbs were decocted with water to obtain an extract, which was filtered and concentrated to form a fluidized ointment. After adding ethanol thrice, the ointment was left undisturbed for 12 h. The resulting supernatant was concentrated to form a clear paste with a relative density of 1.33–1.35, measured at 50 °C. After drying, SGs were prepared by spraying the volatile oils extracted above. Methanol (SN. 1.06 007.4 008, Lot. I1228 607 234) and acetonitrile (SN. 1.00 030.4 008, Lot. JB123 830) were purchased from Merck.
Sample preparations and solutions
0.5 g of SGs powder was accurately weighed and placed in a stoppered Erlenmeyer flask. Next, 50 mL of 70% methanol was accurately added to the flask and covered with the stopper. The total mass of the powder and stoppered flask was then weighed. The SGs powder was then ultrasonically extracted for 30 min, followed by cooling of the extract. After centrifuging the extract at 12,000g for 10 min, the supernatant of the extract was collected, filtered through a 0.22 µm PTFE filter membrane (Agilent Technologies, USA), and stored at 4 °C.
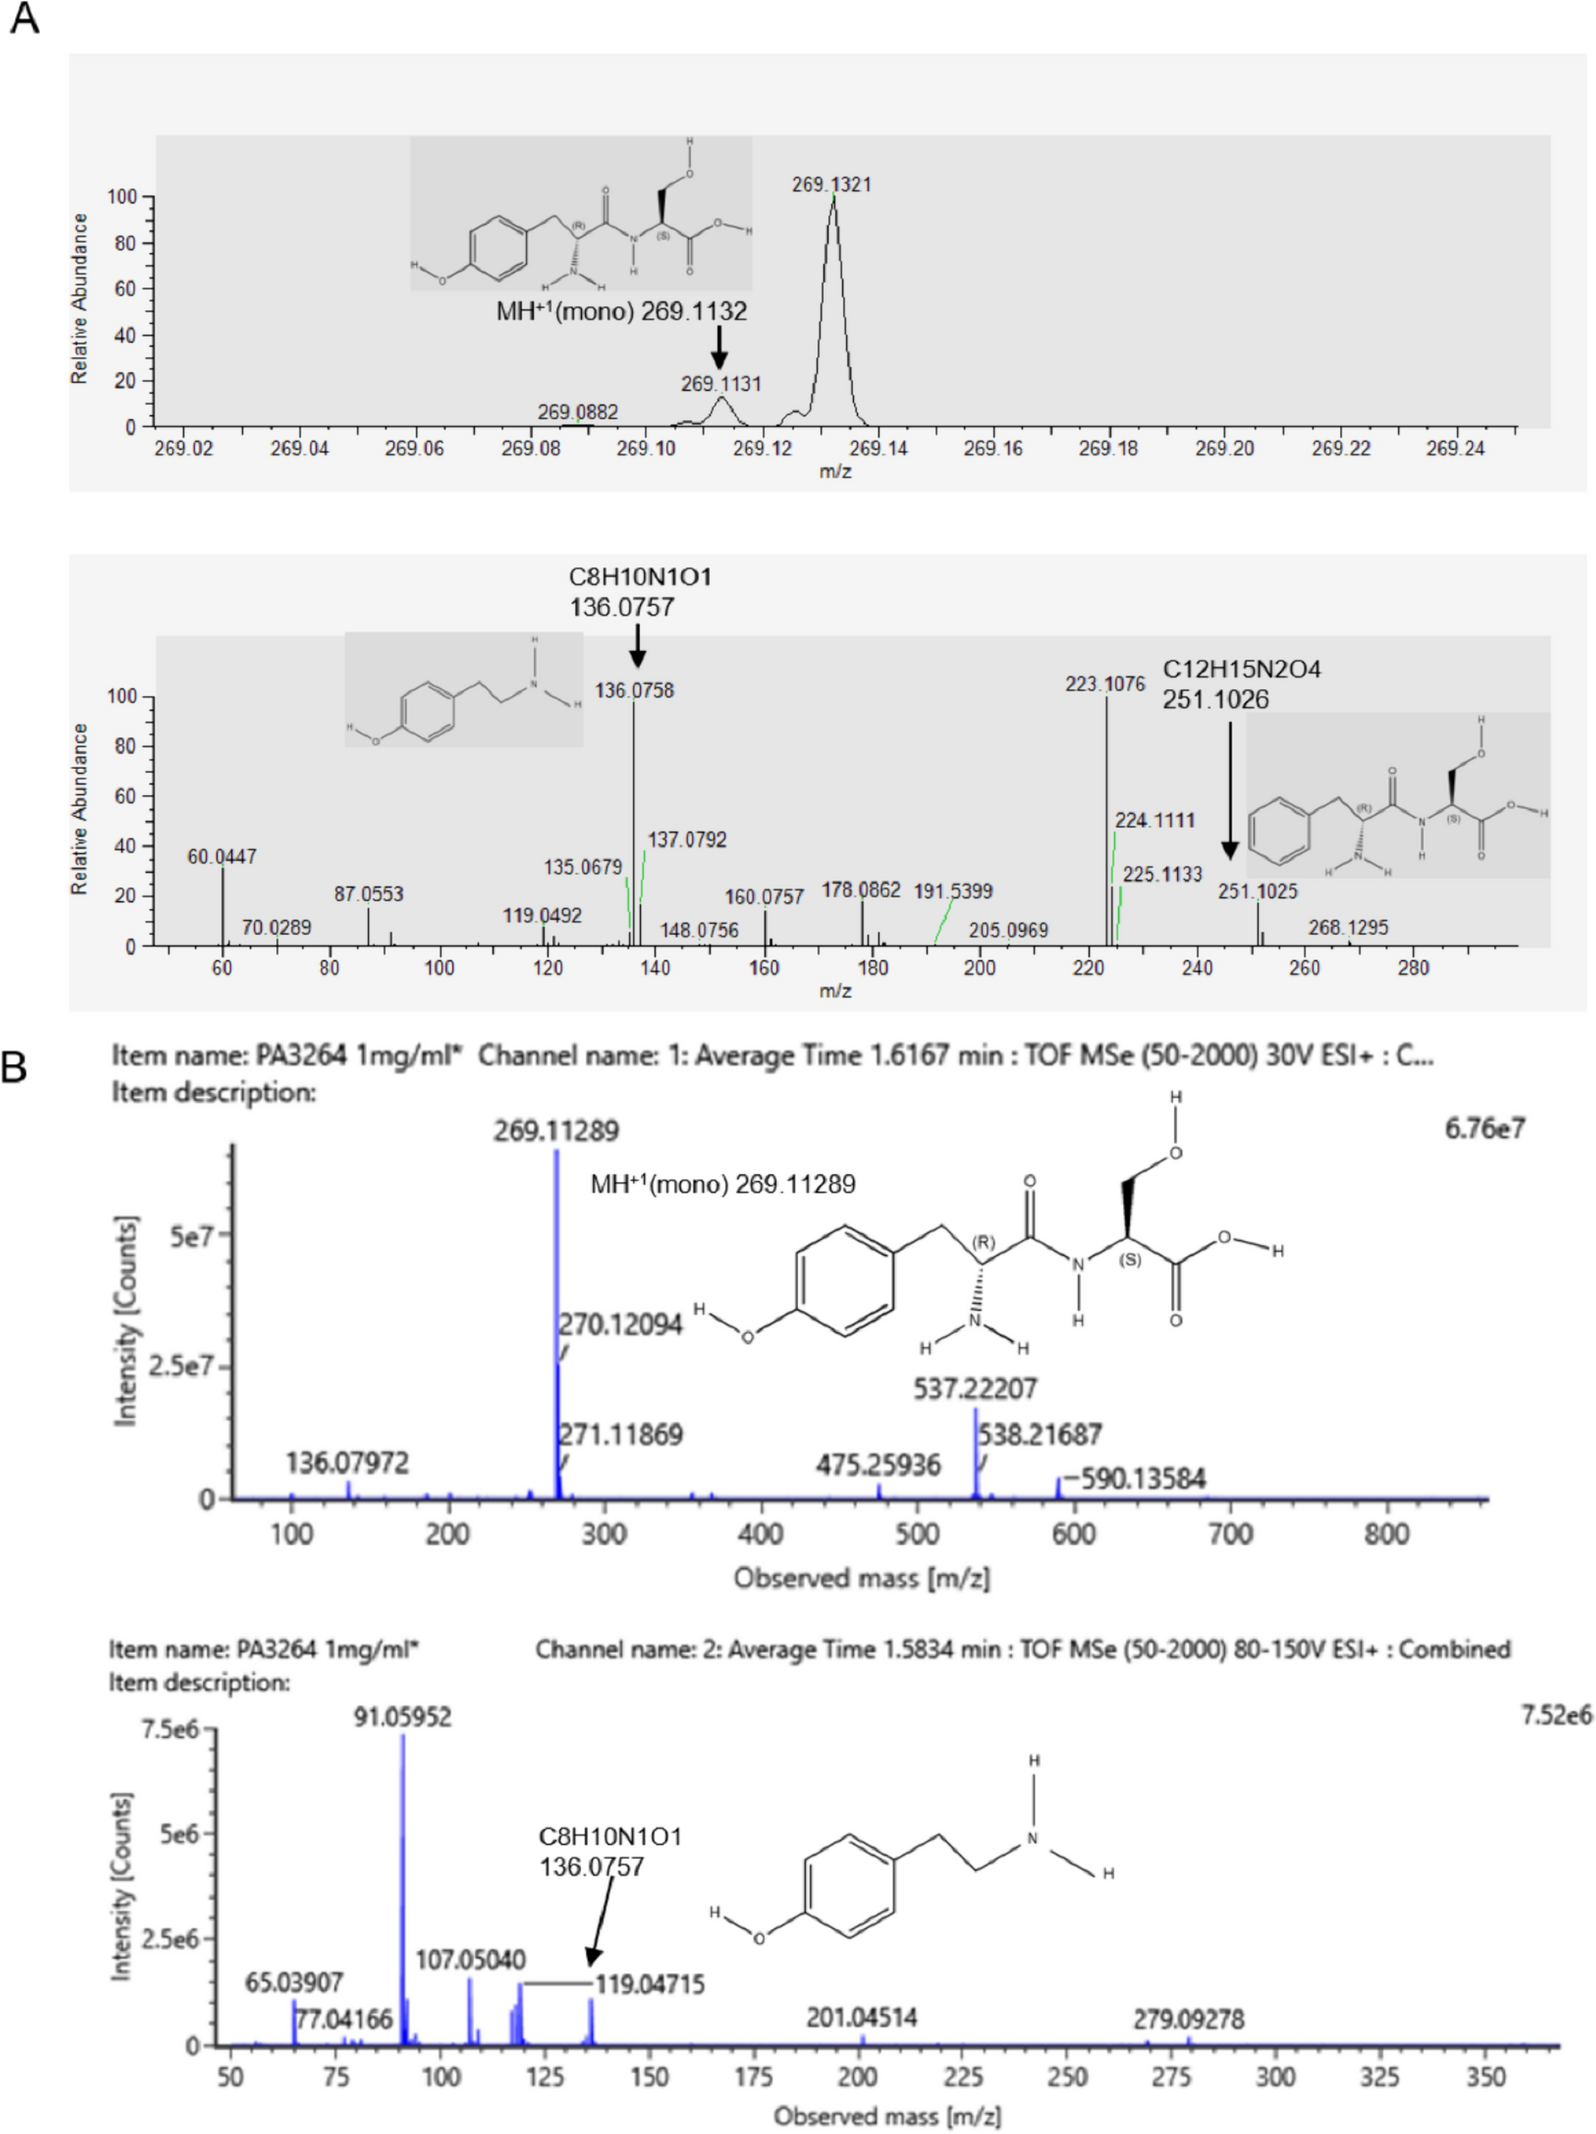
UPLC-Q-TOF–MS/MS analysis
The compositional analysis of SGs was based on the pre-established method [19]. UPLC-Q-TOF–MS/MS analysis was performed using an ACQUITY UPLC-Q-TOF System (Waters USA). Samples were analyzed using Waters Acquity UPLC HSS T3 column (2.1 × 100 mm 1.8 μm; Waters, USA) at 40 °C. The mobile phase composed of 0.1% (v/v) formic acid in water (A) and acetonitrile (B), was analyzed at a flow rate of 0.5 mL/min. A gradient elution program was used as follows: 0–8 min, 2–10% B; 8–14 min, 10–15% B; 14–20 min, 15–20% B; 20–25 min, 20–40% B; 25–28 min, 40 – 98% B; 28–31 min, 98% B. The injection volume was 2 μL.
Mass spectrometry was performed using a Waters SYNAPT G2HDMS System (Waters Corp.) equipped with an electrospray ionization (ESI) source in both positive and negative ion modes. The capillary voltage was 2.6 kV, cone voltage was 40 V, desolvation AGAs (N2) flow rate was 800 L/h, and source temperature and desolvation temperature were set at 120 °C and 400 °C, respectively. The trap collision energy was increased from 10 to 30 eV. All data were acquired and processed using the Masslynx 4.1 software (Waters).
Protein–protein interaction network analysis and construction of a compound-target-pathway-disease network
ETCM v2.0 (http://www.tcmip.cn/ETCM2/front/#/browse/herb) [20] and TCMIP v2.0 (http://www.tcmip.cn/TCMIP/index.php/Home) [21] platforms were used to predict the targets for the components present in SGs. A protein–protein interaction network (PPI network) was constructed based on the String database (http://cn.string-db.org/) [22] for the targets of SGs and gene sets of AGA, which were obtained from WGCNA. The top 20 key targets were identified by the MCC algorithm of CytoHubba in the Cytoscape3.7.1 software. To further elucidate the mechanisms of SGs against AGA, the ‘component-target-pathway-disease’ interaction network was constructed using the links of potentially active ingredients, key targets, and key pathways related to the treatment of AGA with SGs.
Immune-infiltration analysis
The CIBERSORT algorithm (http://cibersort.Stanford.edu/) in the R software was used to calculate the relative proportions of 22 immune infiltrating cells in both the peripheral blood and ankle joints. Next, the Wilcoxon rank sum test was performed to compare the differences in the content of immune cells between the AGA group and the control group. The screening criterion was P < 0.05. To assess the relationship between the key genes involved in the treatment of AGA with SGs and immune cells, Spearman’s correlation analysis was performed.
Animal care and experimentsAnimals
A total of 60 male SD rats of specific-pathogen-free grade, 6–8 weeks, weighing between 200 and 220 g were purchased from Beijing Vital River Laboratory Animal Technology Co., Ltd. (animal license number: SCXK (Jing) 2019-0008). During the experimental period, all rats were provided free access to water and solid chow and were maintained at constant temperature and humidity in the animal facility of the Institute of Traditional Chinese Medicine, China Academy of Traditional Chinese Medicine. All experimental protocols were approved by the Animal Experiment Ethics Committee of the Institute of Chinese Materia Medica, China Academy of Chinese Medical Sciences. The experiments were performed strictly following the Guidelines for the Care and Use of Laboratory Animals of the National Institutes of Health (Ethics number: 2022B067).
Treatment groups
SD rats were randomly divided into six groups (n = 10 rats per group) after adaptive feeding for one week. These groups included control (Con), model (AGA), low-dose treatment (SGs, 2.5 g/kg), medium-dose treatment (SGs, 5 g/kg), high-dose treatment (SGs, 10 g/kg) and positive drug treatment (Colchicine, 0.3 mg/kg). The low, medium and high-dose of SGs were equivalent to one, two and four times the clinical equivalent dose, respectively. After 5 d of gavage administration, a 100 μL solution of 5 μg MSU was injected into the ankle joint cavity of the rats in all groups except for the control group. Then, the treatment was administered for two more days.
Sample collection
On 7 d, all rats were anesthetized with 2% isoflurane 1 h after administration and blood was collected from the abdominal artery. The collected blood samples were left in a vacuum blood collection tube for 30 min, followed by centrifugation at 3000×g for 15 min, serum was collected and stored at − 80 °C. After blood samples were collected, the rats were euthanized, and the ankle joint area was examined from 0.5 cm above to 0.5 cm below. The skin and surrounding muscle tissue were peeled off within 1 min. The ankle joints of the rats from each group were fixed with 4% paraformaldehyde to prepare histopathological synovial sections and perform immunofluorescence detection. The remaining ankle tissue was stored at − 80 °C for further use.
Assessment of arthritis
To assess the effects of SGs on the ankle joint dysfunction of rats, an ankle disability index scale was used 24 h after modeling. The scoring criteria for were as follows [23]: 0 points indicated normal walking, 1 point indicated slightly bent lower limbs and lameness, 2 points indicated moderate lameness with the lower limbs only touching the ground, and 3 points indicated trigeminal walking with severe lameness. Additionally, an ankle joint inflammatory index was established and interpreted based on the following criteria [24]: 0 points indicated normal joints, 1 point indicated visible bone markings and mild joint redness and swelling, 2 points indicated non-visible bone markings and visible joint redness and swelling, and 3 points indicated redness and swelling in extra-articular limbs, such as the thigh. The circumference of the right ankle joint [25] was also measured before and 24 h after modeling using digital calipers with a minimum accuracy of 0.01 mm. The swelling index was calculated using the formula Swelling index = (ankle circumference before modeling - ankle circumference after modeling)/ankle circumference before modeling. The measurement was repeated three times for each group and the average value was recorded.
Paw withdrawal threshold and thermal pain threshold
AGA is often accompanied by intense pain, and evaluating the pain threshold can provide insights into the onset and medication effects of the disease [26]. To investigate mechanical hyperalgesia, von Frey hair tests were performed [27]. The measurements were performed on d 4 and d 6, and each measurement was maintained for three cycles with an interval of 5 min, and the average value was calculated.
To investigate thermal hyperalgesia in rats, the YLS-6B intelligent hot plate instrument was used to measure the thermal pain threshold [28] on 4 d and 6 d. The rats were placed in a hot plate apparatus at (55 ± 0.5) °C, and the time (s) from the moment the rats touched the hot plate to the reaction of licking the hind paw was considered to be the pain threshold of the rat. Each measurement was maintained for 3 cycles with an interval of 30 min, and the average value was calculated.
Enzyme-linked immunosorbent assay
After thawing the rat serum samples at room temperature, the levels of interleukin-1beta (IL-1β, Cat# MM-0 047R1), interleukin-6 (IL-6, Cat# MM-0 190R1), tumor necrosis factor alpha (TNF- α, Cat# MM-0 180R1), citrullinated histone H3 (CitH3, Cat# MM-71 581R2), neutrophil elastase (NE, Cat# MM-0 306R1) and myeloperoxidase (MPO, Cat# MM-50 254R2) were detected using the ELISA kit (MEIMIAN, Jiangsu, China) following the manufacturer’s instructions.
H&E and Safranin O/Fast Green staining
The ankle joint tissues of the rats were fixed in 4% paraformaldehyde, decalcified using ethylene diamine tetraacetic acid (EDTA), dehydrated stepwise with ethanol, made transparent with xylene, embedded in paraffin, and sliced into thin sections (2–4 μm thick). The ankle tissue sections were stained with hematoxylin for 10 min, re-stained with eosin (Cat#G1120, Solarbio, Beijing, China), and sealed. Then, the morphological and pathological changes in the synovial tissue of the ankle were observed under a microscope at 5× and 20× magnification (scale bar: 200 μm and 50 μm).
The ankle joint tissue sections were dipped in Fast Green staining solution for 5 min, washed with a weak acid solution, and dipped in Safranin O stain (Cat#G1371, Solarbio, Beijing, China) for 5 min. The sections were examined under a microscope at 5× and 20× magnification, and images were acquired and analyzed (scale bar: 200 μm and 50 μm). A modified Mankin's method [29] was used to evaluate the degree of cartilage degeneration in rats; a higher score indicated, more serious degeneration.
Western blotting
Ankle tissues were minced and incubated with radioimmunoprecipitation assay (RIPA) lysate for 30 min. After incubation, the contents were centrifuged, and the resulting protein supernatant was collected and quantified using the BCA method. Next, 30 μg of protein underwent SDS-PAGE, and then, it was transferred to a PVDF membrane, the membrane was blocked with skim milk for 1.5 h at room temperature. Primary antibodies against TLR4 (1:1 000, Cat# sc-293 072, Santa Cruz Biotechnology, USA), PKC (1:1 000, Cat# 9 616, Cell Signaling Technology, Beverly, MA), CitH3 (1:1 000, Cat# ab5 103, Abcam, Cambridge, United Kingdom), and MPO (1:4 000, Cat# 66 177–1-Ig, Proteintech, Wuhan, China) were incubated with the membranes overnight at 4 °C. The following day, secondary antibodies were added and incubated at room temperature for 1 h. The relative protein expression was quantified using the ImageJ software after chemiluminescence development.
Immunofluorescence
The paraffin sections of the ankle joints of rats were dewaxed and then antigen retrieval was performed in a microwave oven with sodium citrate buffer (pH 8.0). After the sections were blocked with BSA at room temperature for 30 min, the primary antibodies MPO (1:500) and CitH3 (1:1 000) were added and incubated overnight at 4 °C in a humid box. The following day, secondary antibodies were added and incubated at room temperature for 30 min. The nuclei were counterstained with DAPI and mounted with an anti-fluorescence quencher. The samples were observed, and images were captured using a confocal microscope.
Statistical analysis
All data were analyzed using the SPSS 26.0 software, and graphs were plotted using the GraphPrism 9 software. To ensure that the data were accurate and reliable, biological replicates were performed with six rats per group and all experiments were conducted thrice, the results were reported as the mean ± SEM. The data were assessed for normality using the Shapiro–Wilk test and for variance using the Chi-square test. Afte the requirements were met, the differences in parameters among groups were analyzed by performing one-way ANOVA. When the data did not follow a normal distribution or had unequal variances, the differences in parameters among groups were compared by the Kolmogorov–Smirnov nonparametric test. All differences among and between groups were considered to be statistically significant at P < 0.05.


留言 (0)