
記住我
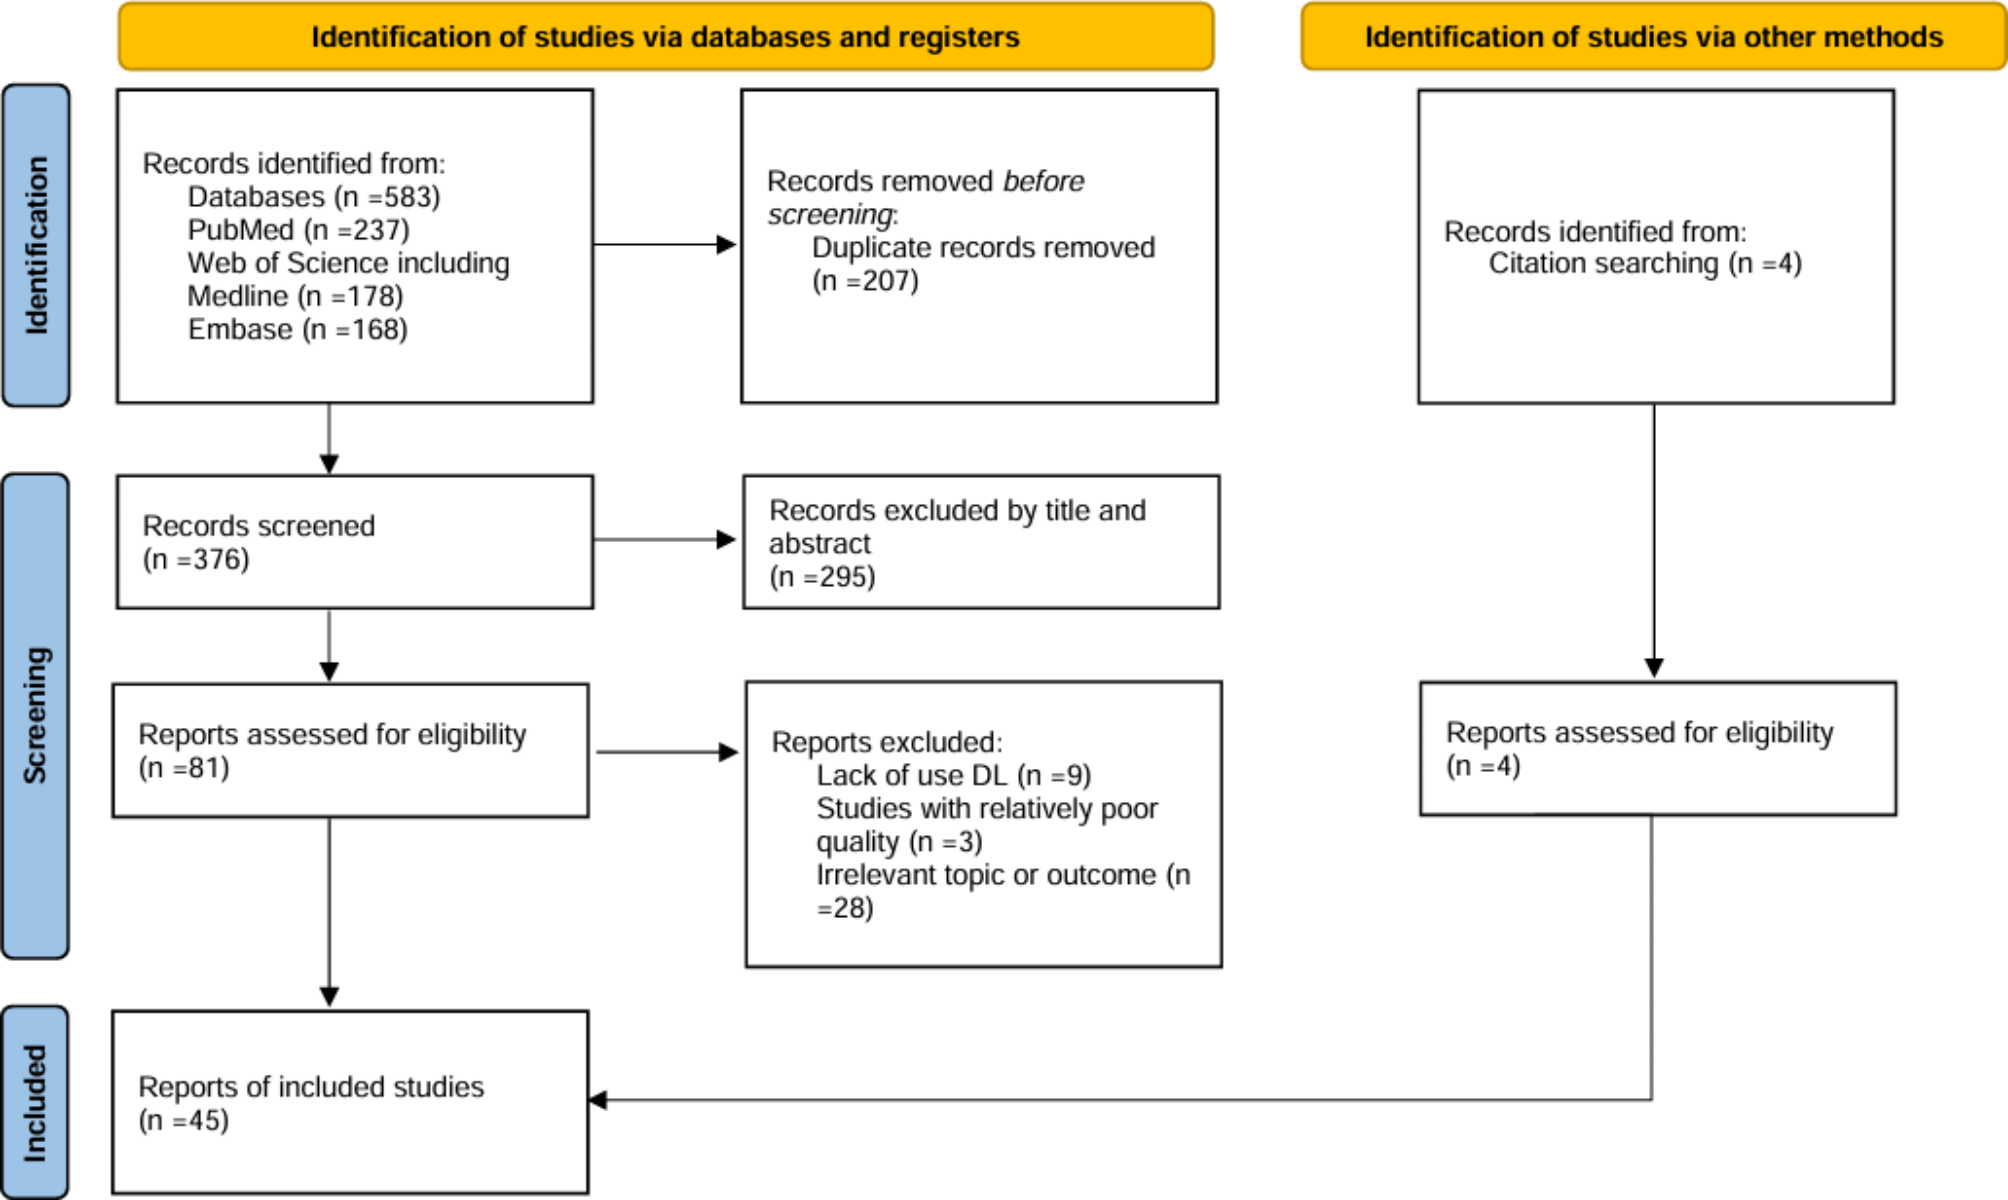

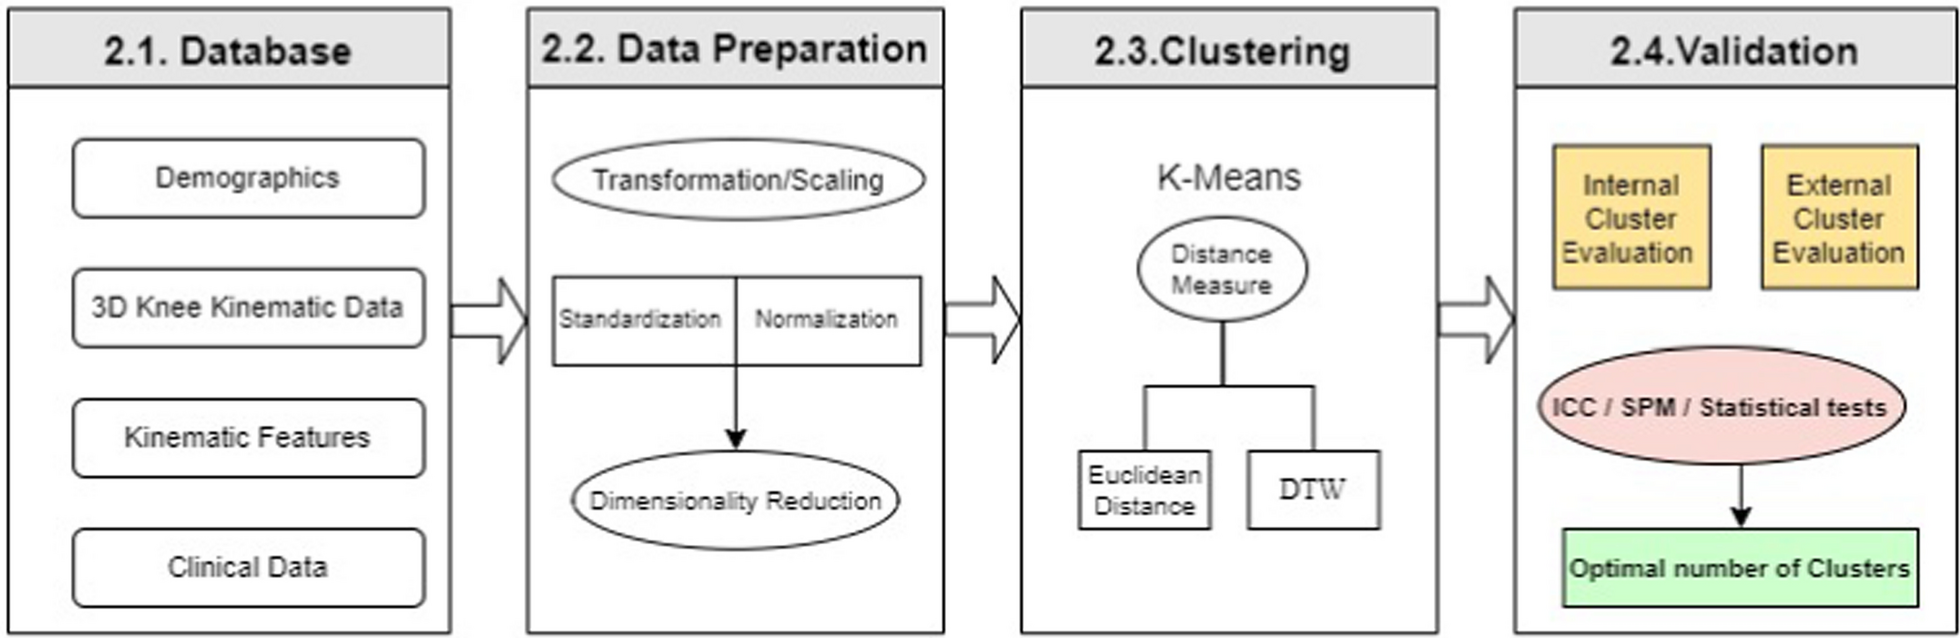
The block diagram presented in Fig. 1 illustrates the different steps in the methodology used in this study to identify distinct clusters (i.e., phenotypes) from the kinematic data. This sequential methodology is designed to ensure a comprehensive and systematic approach. The first step is data collection, including the capture of kinematic, demographic and clinical data. These data are then modified through a preparation process including scaling and dimensionality reduction to reduce their complexity, making it easier to analyze and interpret them. The next step is the determination of clustering techniques aiming to identify kinematic clusters using K-means. This unsupervised machine-learning algorithm based on centroids has been largely used for analyzing kinematic trajectories through clustering [16]. The clustering process involves varying distance measures and clustering parameters, such as the number of clusters. Finally, the resulting clusters are validated for accuracy. This validation process involves using intercluster correlation and statistical hypothesis testing. The clusters, or phenotypes at this point, are evaluated based on their clinical features, demographic data and clinical information, and the results are compared to determine the accuracy of the clustering process.
Fig. 1
Methodology for comprehensive kinematic data analysis: A stepwise approach involving Data Preparation, Clustering using K-Means with varying distance measures (Euclidean Distance or Dynamic Time Warping), and Validation using Inter-Cluster Classification (ICC), Statistical Parametric Mapping (SPM), in addition to traditional statistical tests
DatabaseThe database includes demographic details (See Table 1), three-dimensional (3D) knee kinematic data, kinematic features, and clinical data from 80 candidates for total knee arthroplasty (TKA) with knee osteoarthritis (KOA) confirmed by X-ray imaging and by an experienced orthopaedic surgeon after a physical exam. This dataset was taken from a previous study (ethics approval obtained by the Nova Scotia Health Authority Research Board, reference number: NSHA ROMEO 1016253), which consisted of 178 patients with moderate to severe KOA patient referred by their general practitioner for a surgical consult. Only patients that were deemed surgical candidate for a total knee arthroplasty by the orthopaedic surgeons were kept for the current analysis. Inclusion criteria were as follows: patients with primary KOA confirmed through X-ray imaging and by an experienced orthopedic surgeon after a physical examination. Exclusion criteria included patients unable to walk on a treadmill due to neurological or balance disorders due to neurological or imbalance disorder. The cohort of TKA candidates consisted of 51 women and 29 men, providing a diverse representation of both sexes within the database.
Kinematic data were captured using a Knee Kinesiography exam with the \(\hbox ^}\) system (Emovi Inc., Canada) while the patient walked on a commercial treadmill. This advanced technology is designed to provide accurate 3D measurements of dynamic knee alignment, offering objective data for individuals with movement impairments related to orthopedic conditions. The \(\hbox ^}\) system has received regulatory approvals, including FDA 510(k) clearance, Health Canada licensing, and CE marking, underscoring its reliability and compliance with medical device standards. Unlike traditional static imaging methods such as X-rays or MRI, the Knee Kinesiography exam provides insights into joint function during active movement. This dynamic assessment capability makes the \(\hbox ^}\) system a valuable tool for evaluating and managing orthopedic issues with quantifiable data [17]. The 3D kinematic data combined the knee movement in the sagittal, frontal, and transverse planes to form single-vector data of 300 raw points for each participant, with each plane containing 100 points (i.e., kinematic curves). In addition to these measures, 69 kinematic features extracted from 3D kinematic curves were also included in the database. These features were identified based on an exhaustive review of the literature and variables commonly assessed in clinical biomechanical studies in KOA populations: 30 features from the frontal plane (i.e., adduction/abduction or varus/valgus), 17 features from the sagittal plane (i.e., flexion/extension), and 22 features from the transverse plane (i.e., internal/external rotation). The features extracted included maximums, minima, angles at specific instants of gait, and ranges of motion (ROMs) throughout different phases of the gait cycle (e.g., loading, stance, swing, etc.). These features, which have been extensively studied in clinical biomechanics research are known to provide important insights into the kinematic behavior of KOA patients [2, 7].
Clinical features comprise subjective and objective data collected through patient self-administered questionnaires and supervised functional tests. The Oxford Knee Score (OKS) was used to assess pain and function in activities of daily living (ADL) through a 12-item questionnaire [18]. Based on its original publication, each question is scored from 1 to 5, so an overall OKS can be calculated, ranging from 12 (best outcome) to 60 (worst outcome). To better understand how patients experience their pain, the Pain Catastrophyizing Scale (PCS) was used to assess the tendency to magnify, ruminate, and feel helpless about pain [19]. These three aspects can be evaluated as subscores (3 features), and an overall PCS score can be calculated (the higher the score is, the more catastrophizing the patient’s pain experience is). Finally, patients were invited to perform the Timed-Up-And-Go test (TUG-test) to objectively assess their function. The TUG test starts with the patient sitting in a chair, who then raises, walks 3 ms at a comfortable pace, turns, and walks back to the chair to sit back down. The score is the time (in seconds) it takes to perform this sequence (the greater the time is, the worse is the function). Taken together, these 6 clinical features can provide a complete picture of different aspects of important outcomes in KOA patients, namely, pain (impact on ADL, magnification, and catastrophizing) and function (impact on ADL and subjective assessment).
Data preparationData transformation methodsAmplitudes in kinematic data largely vary across the three different planes of movement (e.g., from 0 to \(60-70^\) in the sagittal plane vs. from −5 to +10\(^\) on average for the two other planes), resulting in heterogeneous data existing at different scales. To address this issue, data transformation was used to rescale the data and remove any biases due to differences in the measurement scales. By doing so, data become more comparable and easier to analyze, thus facilitating a more accurate interpretation of the knee movement patterns. Two distinct data transformation methods were tested: standardization and normalization. The normalization (also known as min-max scaler) method involves scaling the data to a fixed range of values, usually between 0 and 1, by subtracting the minimum value and dividing it by the range. On the other hand, standardization (also known as standard scaler or z-normalization) centers the data around its mean and scales it by its standard deviation, resulting in an unit variance. While normalization is advantageous for preserving the original range of the data, standardization is better suited for data with a Gaussian distribution and can handle outliers more effectively. These two methods were compared to identify the most appropriate technique for scaling the data used in this study.
Kinematic representation methodsTwo distinct methods for representing kinematic data were then evaluated: a global representation method and a local representation method. The global approach involves utilizing a vector consisting of 300 kinematic data points. The local approach involved using the set of 69 kinematic features extracted from the 3D kinematic curves. Once again, the two approaches were compared to identify the most appropriate to identify clusters with maximal differences for this database.
Principal component analysisOnce this step was achieved, a dimensionality reduction phase was integrated, aiming to reduce the complexity of the process data by extracting essential features representing the variability of the data. We applied the principal component analysis (PCA) technique and evaluated its ability to capture the most important features discriminating the different kinematic clusters. PCA is a popular technique for transforming the original data into a new set of orthogonal variables called principal components [20]. These components capture the most significant sources of variability in the data and are ranked according to their contribution to the overall variance. PCA is widely used in pattern recognition and data mining because it simplifies complex datasets while retaining the essential information [21, 22].
ClusteringK-meansAs already described, clustering is used to identify distinct clusters by segregating data (i.e., 3D kinematic data here) into consistent groups, with the intention of extracting the knee kinematic phenotypes by averaging the kinematic curves within each group. This enables the formation of more homogeneous groups with mean patterns that are representative of each phenotype. The clustering algorithm used in this study is K-means, which is commonly used in unsupervised learning to partition data into K clusters, minimizing the sum of the squared distances between the data points and their assigned cluster centroid [23]. The process begins by selecting K centroids at random, then iteratively assigning each data point to its closest centroid and adjusting the centroid position accordingly. The algorithm terminates when the centroids no longer change, or the maximum number of iterations is reached.
Distance between data pointsTwo different methods were tested to set the optimal distance between the data points and each cluster to which they were assigned: the Euclidian distance and dynamic time warping (DTW). The Euclidean distance is a measure of the straight-line distance between two data points in an Euclidean space. It is calculated as the square root of the sum of the squared differences between the corresponding features or variables of two points. This distance metric assumes that the dimensions are independent and equally weighted, which makes it a useful option for clustering when the data are continuous and uniformly scaled. However, it may not be the best choice for datasets with high dimensionality or when the variables are not independent or equally weighted. DTW is a distance metric that is often used in time series analysis, including kinematic or motion capture data. DTW measures the similarity between two sequences of data points, even when they have different lengths and warping (i.e., when one sequence is distorted or shifted with respect to the other). It finds the optimal alignment of sequences by stretching or compressing them in time to minimize the distance between the corresponding points [24]. DTW can be useful for clustering time-series data with irregular shapes and is often used in applications such as speech recognition, gesture recognition, and motion analysis [25].
ValidationTo assess the quality of the clusters produced by the clustering algorithms, we used both internal and external cluster evaluation methods. For the internal evaluation, we calculated the intraclass correlation coefficient (ICC) to measure the similarity among the observations within each cluster. The ICC is a commonly used measure to evaluate the reliability or consistency of measurements within a single cluster and can provide insight into the internal validity of the clusters produced by the algorithm. Additionally, we employed Statistical Parametric Mapping (SPM) by [26]) to evaluate the statistical significance of the differences between the clusters in terms of the features or variables used for clustering. This approach involves analyzing 1-D continuous data without preconceived hypotheses, allowing the detection of any potential differences or patterns that may not have been previously considered by [26]. For the external evaluation, we used statistical significance tests such as Student’s t tests and ANOVAs to identify any significant differences between clusters in terms of demographic, clinical, and kinematic data. A p-value <0.05 was considered to indicate statistical significance. These two evaluation methods were also applied to determine the best number of clusters.
留言 (0)