Cell culture
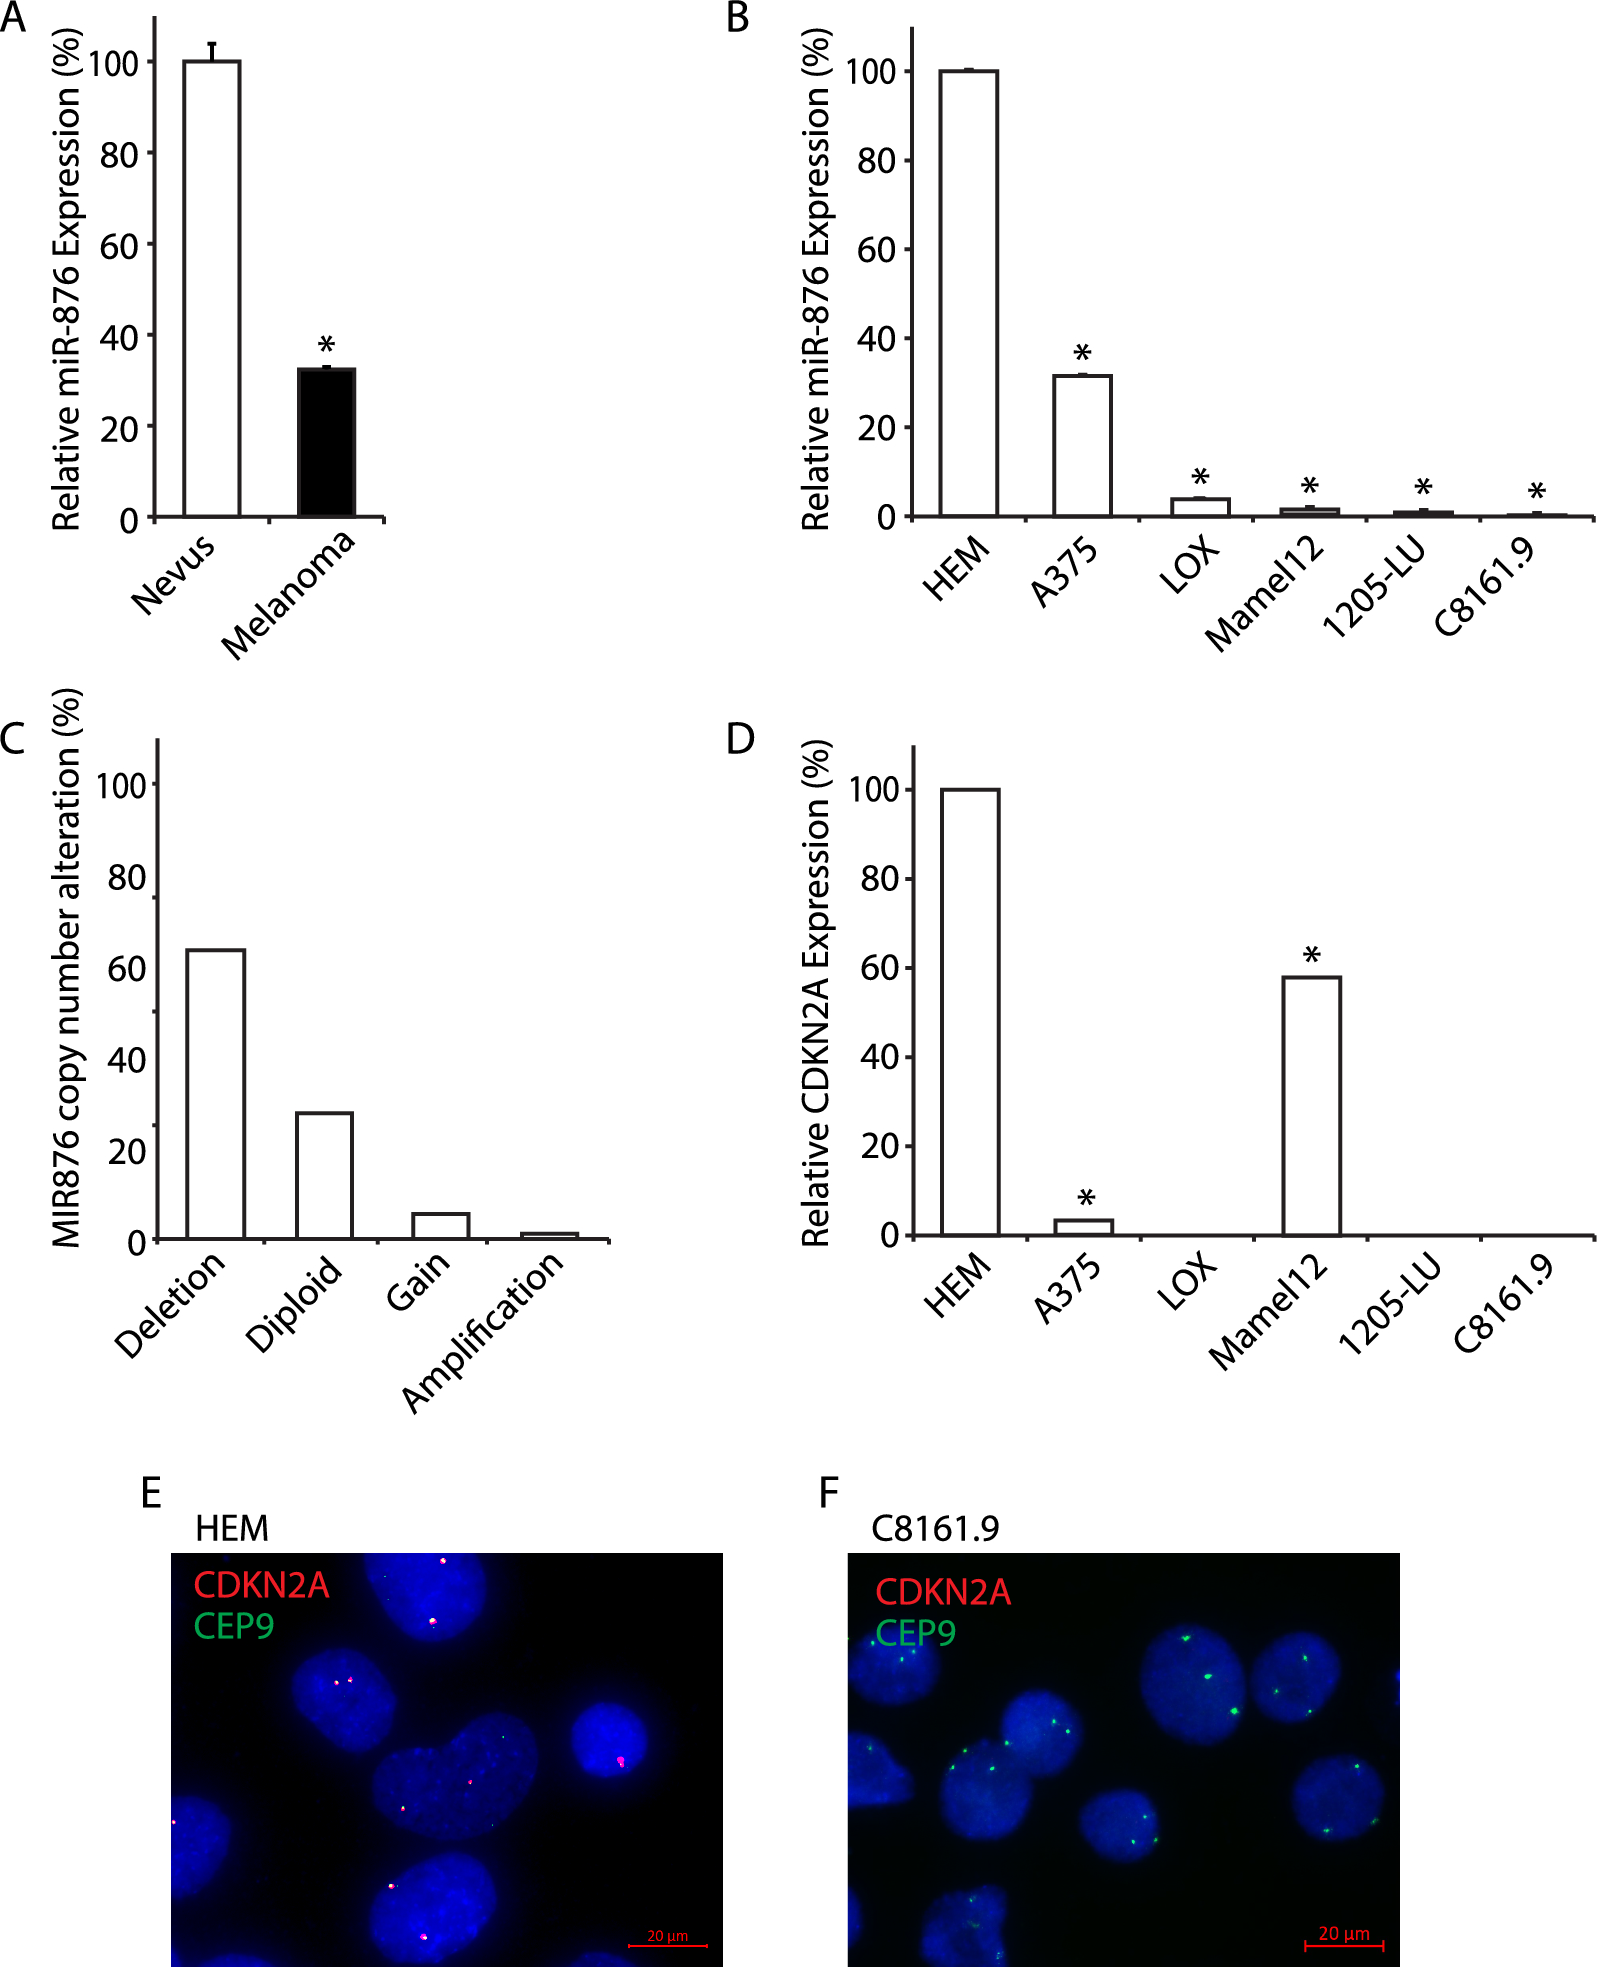
A panel of melanoma cell lines was utilized to assess the expression of miR-876, including C8161.9 (obtained from Dr. D. Welch, UAB, USA), A375 (ATCC, Manassas, VA, USA), LOX (a gift from Dr. Oystein Fodstad, University of Oslo, Norway), 1205-Lu (Coriell Institute, Camden, NJ, USA), and Ma-Mel-12, a short-term melanoma culture (a gift from Dr. Dirk Schadendorf, University of Essen, Germany), as previously described [16]. Human epidermal melanocytes (HEM), used as a control, were obtained from Zen-Bio (Durham, NC, USA), and grown in Mel-2 melanocyte medium. Further characterization of the role of miR-876 was performed in C8161.9 and A375 cells. C8161.9 cells were grown in DMEM/F12 with 5% fetal bovine serum (FBS) (Invitrogen Life Technologies, Carlsbad, CA, USA), and A375 cells were grown in RPMI-1640 with 5% FBS. Cell culture media was supplemented with 1X penicillin/streptomycin (Thermo Fisher Scientific, South San Francisco, CA, USA) and cells were grown at 37 ºC and 5% CO2. All cell lines were routinely tested for mycoplasma contamination using the MycoFluor Mycoplasma Detection Kit (Thermo Fisher Scientific, South San Francisco, CA, USA) following the manufacturer’s instructions.
Plasmids and transfection
The pmir GLO-dual luciferase vector (Promega, Madison, WI, USA), pEZX-MR04-miR-876 and pEZX-MR04 control vectors (GeneCopoeia, Rockville, MD, USA) and the MAPK1/ERK2 cDNA expression vector (Origene, Rockville, MD, USA) were purchased. Transient transfection was carried out by Lipofectamine-2000 (Invitrogen Life Technologies, Carlsbad, CA, USA) according to the manufacturer's protocol. Briefly, 50 nM of control miR (termed cont. miR) or miR-876 were used for transfection. miRNAs were mixed with lipofectamine in serum-free medium and the reaction mixture was added to the cells for 4 h, after which the media was aspirated and replaced. Stable transformants were generated by transfecting C8161.9 and A375 cells with pEZX-MR04 control and pEZX-MR04-876 vectors following selection with puromycin (1 µg/mL). Stable transformants were sorted based on GFP expression using FACS Aria II (BD Biosciences). Transfection of the MAPK1/ERK2 cDNA into C8161.9 and A375 cells was performed as previously described [17].
miRNA extraction and quantitative reverse transcriptase polymerase chain reaction (qRT-PCR)
Samples from primary melanomas (N = 55) and nevi (N = 48) were collected under the auspices of a protocol approved by the Sutter Health Institutional Review Board. The histologic nevus subtypes included in the cohort are presented in Supplemental Table 1. miRNAs from melanoma cell lines and human tumor tissues were extracted by using the mirVana miRNA extraction kit (Thermo Fisher Scientific, South San Francisco, CA) following the manufacturer’s instructions. Quantitation of miR-876 expression in tissues and cell lines was performed by qRT-PCR as previously described [18]. pre-miR-miRNA precursor molecule-negative control (referred to as control miR) and pre-miR-miRNA-876 precursor (referred to as miR-876) and their corresponding miRNA Taqman probes were purchased from ThermoFisher Scientific (South San Francisco, CA, USA). Mature miRNAs were assayed using the TaqMan MicroRNA Assays in accordance with the manufacturer's instructions (Thermo Fisher Scientific, South San Francisco, CA, USA). All RT reactions, including no-template controls and RT minus controls, were run in a 7500 Fast Real Time PCR System (Thermo Fisher Scientific, South San Francisco, CA, USA). RNA concentrations were determined with a NanoDrop (Thermo Fisher Scientific, South San Francisco, CA, USA). Samples were normalized to RNU44 (Thermo Fisher Scientific, South San Francisco, CA, USA). For the validation of RNA-Seq results, RNA was extracted from three tumors per treatment group or following transfection of miR-876 or control miR into C8161.9 cells in culture, and cDNA synthesis and qRT-PCR were performed as described previously [16]. Quantitative PCR was performed using Taqman probes (Thermo Fisher Scientific) for TNFRSF4 (Hs00937195_g1), DDR1 (Hs01058430_m1), CA9 (Hs00154208_m1), CDC42EP5 (Hs01936746_s1), VEGFB (Hs00173634_m1), BRCA2 (Hs00609073_m1), BLM (Hs01119891_m1). GAPDH (Hs02786624_g1), HPRT1 (Hs02800695_m1), and TBP (Hs00427621_m1) were used as control genes. Gene expression levels were quantified using the 7500 Fast Real Time Sequence detection system software (Thermo Fisher Scientific, South San Francisco, CA, USA). Comparative real-time PCR was performed in triplicate, including no-template controls. Relative expression was calculated using the comparative Ct method. Experiments were repeated three times in triplicate for cell lines and twice for tissues.
Luciferase expression assay
Assessment of luciferase expression was performed as previously described [18]. Briefly, the 3’ UTR region of the MAPK1/ERK2 gene containing target site sequences complementary to the seed sequence of miR-876 was cloned in the pmir GLO-dual luciferase vector (Promega, Madison, WI, USA), and the resultant vector named ERK-UTR. For reporter assays, cells were transiently transfected with reporter plasmid with control miR or miR-876. Firefly luciferase activities were measured by using the Dual Luciferase Assay (Promega, Madison, WI, USA) 24 h after transfection and the results were normalized with Renilla luciferase. The experiments were performed in triplicate.
Colony formation assay
The colony formation assay was performed as previously described [18]. Briefly, 500–700 cells were plated in each well of a 6-well plate and allowed to grow till visible colonies appeared. Colonies were stained with crystal violet and counted. The experiments were performed in triplicate.
Western blotting
Cell lysates were prepared in RIPA buffer containing 1 × Halt protease inhibitor cocktail and 1 × Halt phosphatase inhibitor cocktail (Pierce, Rockford, IL, USA) centrifuged at 3500 rpm for 10 min at 4 °C. Proteins (25–50 µg) from each sample were subjected to SDS/polyacrylamide gel electrophoresis (PAGE) and transferred onto a nitrocellulose membrane. Western analysis of ERK expression was performed as previously described [17] using specific antibodies against ERK1/2 (#4695, from Cell Signaling Technology, Danvers, MA) and GAPDH (#sc-365062, from Santa Cruz Biotechnology, Santa Cruz, CA, USA).
Cell cycle and Annexin V assays
Cell cycle and Annexin V assays were performed by using the Muse cell cycle kit and Muse Annexin V apoptosis kit, respectively (EMD Millipore, Hayward, CA, USA) as described [18].
Migration and invasion assays
Melanoma cells (1.5 × 10⁵) were seeded in the upper wells of BD BioCoat Chambers (BD Biosciences, Bedford MA), with or without 15 µL of Matrigel at 6 mg/mL in RPMI without serum. The lower wells contained the same medium with 20% serum. The cells that invaded or migrated 24 h later were fixed, stained and counted.
Cell counting kit-8 (CCK-8) cell proliferation assay
A375 cells stably expressing control miR or miR-876 were seeded (1000 cells/well in 100 μL medium) in a 96-well cell culture plate (Corning Inc., Corning, NY, USA) on Day − 1 and incubated at 37 °C in a humidified incubator with 5% CO2 for 24 h. On Day 0, the culture medium was replaced with medium containing various concentrations of vemurafenib, starting at 10 µM and serially diluted by a factor of three. Cells were incubated for another 72 h under the same conditions as described above. On Day 3, 10 μL of the CCK-8 reagent (Dojindo Molecular Technologies, Rockville, MD) was added into each well, and the OD at 450 nm was measured using a multimode microplate reader (Varioskan, Thermofisher Scientific, Chicago, IL, USA) after incubation for 2 h at 37 °C.
Animal studies
Eight-week-old nu/nu mice were purchased from Jackson Laboratories, Sacramento, CA, USA. In vivo studies were carried out in accordance with the National Institutes of Health guidelines, Health Research Extension Act of 1985 and the Public Health Service Policy on Humane Care and Use of Laboratory Animals (Policy), Office of Laboratory Animal Welfare assurance, and an approved Institutional Animal Care and Use Committee (IACUC) protocol. C8161.9 cells (1 × 10⁶) were injected subcutaneously in a total volume of 100 µL in the mouse flank. Once tumors were palpable (with average tumor volumes ≥ 70 mm3), mice were randomized and divided into the following treatment groups: control miR (n = 8) and miR-876 (n = 8). The miR was injected intratumorally twice weekly for the duration of the study, as previously described [19]. The animals were randomly assigned to the treatment groups, and the investigator performing tumor measurements was blinded to the identity of the treatment groups. No samples were excluded from the analysis. Tumors were measured by caliper and volumes were calculated as a product of (length × width × width)/2. Mice were sacrificed and tumors collected and processed for RNA extraction.
RNA sequencing (RNA-Seq)
RNA extraction and sequencing were performed as previously described [20]. Briefly, total RNA was extracted from tumor tissues using the RNeasy tissue kit (Qiagen, Redwood City, CA, USA). RNA-Seq was performed from ~ 500 ng of total RNA processed using TruSeq polyA selection, at a target depth of 40 million paired-end, stranded reads on an Illumina 2500. The RNA-Seq data was aligned to the human reference genome (hg19) using the software STAR, followed by gene quantification in the software AltAnalyze to obtain gene-level RPKM values. Differential expression (fold > 1.2, empirical Bayes moderated t-test p < 0.05) was determined using AltAnalyze version 2.1.3 using the Ensembl 72 human database. Embedded gene-set enrichment analyses were performed using GO-Elite with default options. Hierarchical clustering was performed in AltAnalyze using HOPACH clustering for rows and weighted cosine clustering for genes. The analyses presented focused on a heat map representing the top 684 up- and down-regulated genes (empirical Bayes moderated t-test, p < 0.05; fold change = 1.2).
Next-generation sequencing (NGS)Tumor DNA extraction
Genomic DNA was extracted from the panel of melanoma cell lines using the QIAamp DNA FFPE Tissue kit (Qiagen, Redwood City, CA, USA), and its quantity and integrity determined using a TapeStation (Agilent Technologies, Santa Clara, CA, USA).
DNA sequencing
MiSeq 2 × 151 base paired-end sequencing was performed to detect single-nucleotide variant (SNV) and insertion/deletion (indel) variants at 1% allelic frequency or higher in target regions with sufficient read coverage. We used the 56G Oncology Panel V2 from Swift Biosciences (Ann Arbor, MI, USA). Per sample, we only considered a mean coverage of at least 500 for DNA sequencing, and SNV and indel variants at 1% allelic frequency or higher in target regions with sufficient read coverage (at least 100 ×). The 56 gene targets covered by the cancer panel were previously described [21] but did include BRAF and CDKN2A.
Data analysis
Data obtained using the 56G Oncology Panel V2 was analyzed using Genialis Expressions (Accel-Amplicon analysis workflow, Genialis Inc., Boston, MA, USA). In brief, quality trimmed (Trimmomatic v.0.36) sequencing data was aligned to the human genome (GRCh37 assembly) using BWA MEM (v. 0.7.17-r1188). The aligned data was further processed by trimming primer sequences (Primerclip, Swift biosciences) and GATK (v.3.6) tools (IndelRealigner and BaseRecalibrator) to prepare analysis ready BAM file. SNP/INDELs were called using LoFreq (v.2.1.3.1) and annotated using snpEff (v.4.3k).
Fluorescence in situ hybridization (FISH)
FISH for analysis of copy number was performed as previously described [22, 23] using bacterial artificial chromosome clones (BAC) for CDKN2A (RP11-149I2) and a clone mapping to the centromeric region of chr. 9p11.2 (RP11-69O9) based on the December 2013 freeze of UCSC Genome Browser (http://genome.ucsc.edu). All BAC clones were obtained from the Children's Hospital Oakland Research Institute. The quality and mapping of all probes were verified by hybridization to normal metaphase spreads in combination with commercially available centromeric probe (Empire Genomic, New York, USA). Z-stacked images were acquired using a Zeiss Axio Image Z2 microscope controlled by AxioVision software (Zeiss, Jena, Germany). At least 40 nuclei from each case were evaluated, and the signals were interpreted according to guidelines described previously [24].
Statistical analysis
All quantified data represent an average of at least triplicate samples or as indicated. Statistical significance was determined using the Student’s t-test or Mann–Whitney U test, and P values < 0.05 were considered significant. Data are represented by the mean with error bars representing standard deviation. In the in vivo anti-tumor study, sample sizes were determined prospectively, using a type I error rate of 0.05 and power of 0.8 to detect differences in mean tumor volume of at least 30%.


留言 (0)