
記住我


In total, 66 of the participants were selected from the previous cohort study [8]. As noted in Methods, among the enrolled participants, 22 were patients reported with most severe long COVID symptoms (LC Group), 22 were participants without long COVID (NLC Group), and the rest were healthy controls (HC Group) with no COVID-19 infection history (Fig. 1a). The first and second sampling time was 6 and 12 months after the COVID-19 patient’s discharge, respectively, and 12 of the LC Group and 12 of the NLC Group attended the second follow-up. Baseline characteristics of enrolled participants showed no significant difference among groups (Table 1). Enrollees had a mean age of 46 years (range 22–69), and 18 (27%) were female (Table 1). Participants in the LC and NLC Groups had asymptomatic or mild COVID-19 during the hospitalization. Besides, in the LC Group, 7 (32%) had chest tightness/chest pain, 17 (77%) had fatigue, and 10 (45%) had cough, and the average scores of the questionnaires were listed in Table 1. Detailed results of the questionnaires were listed in Supplementary Table 7.
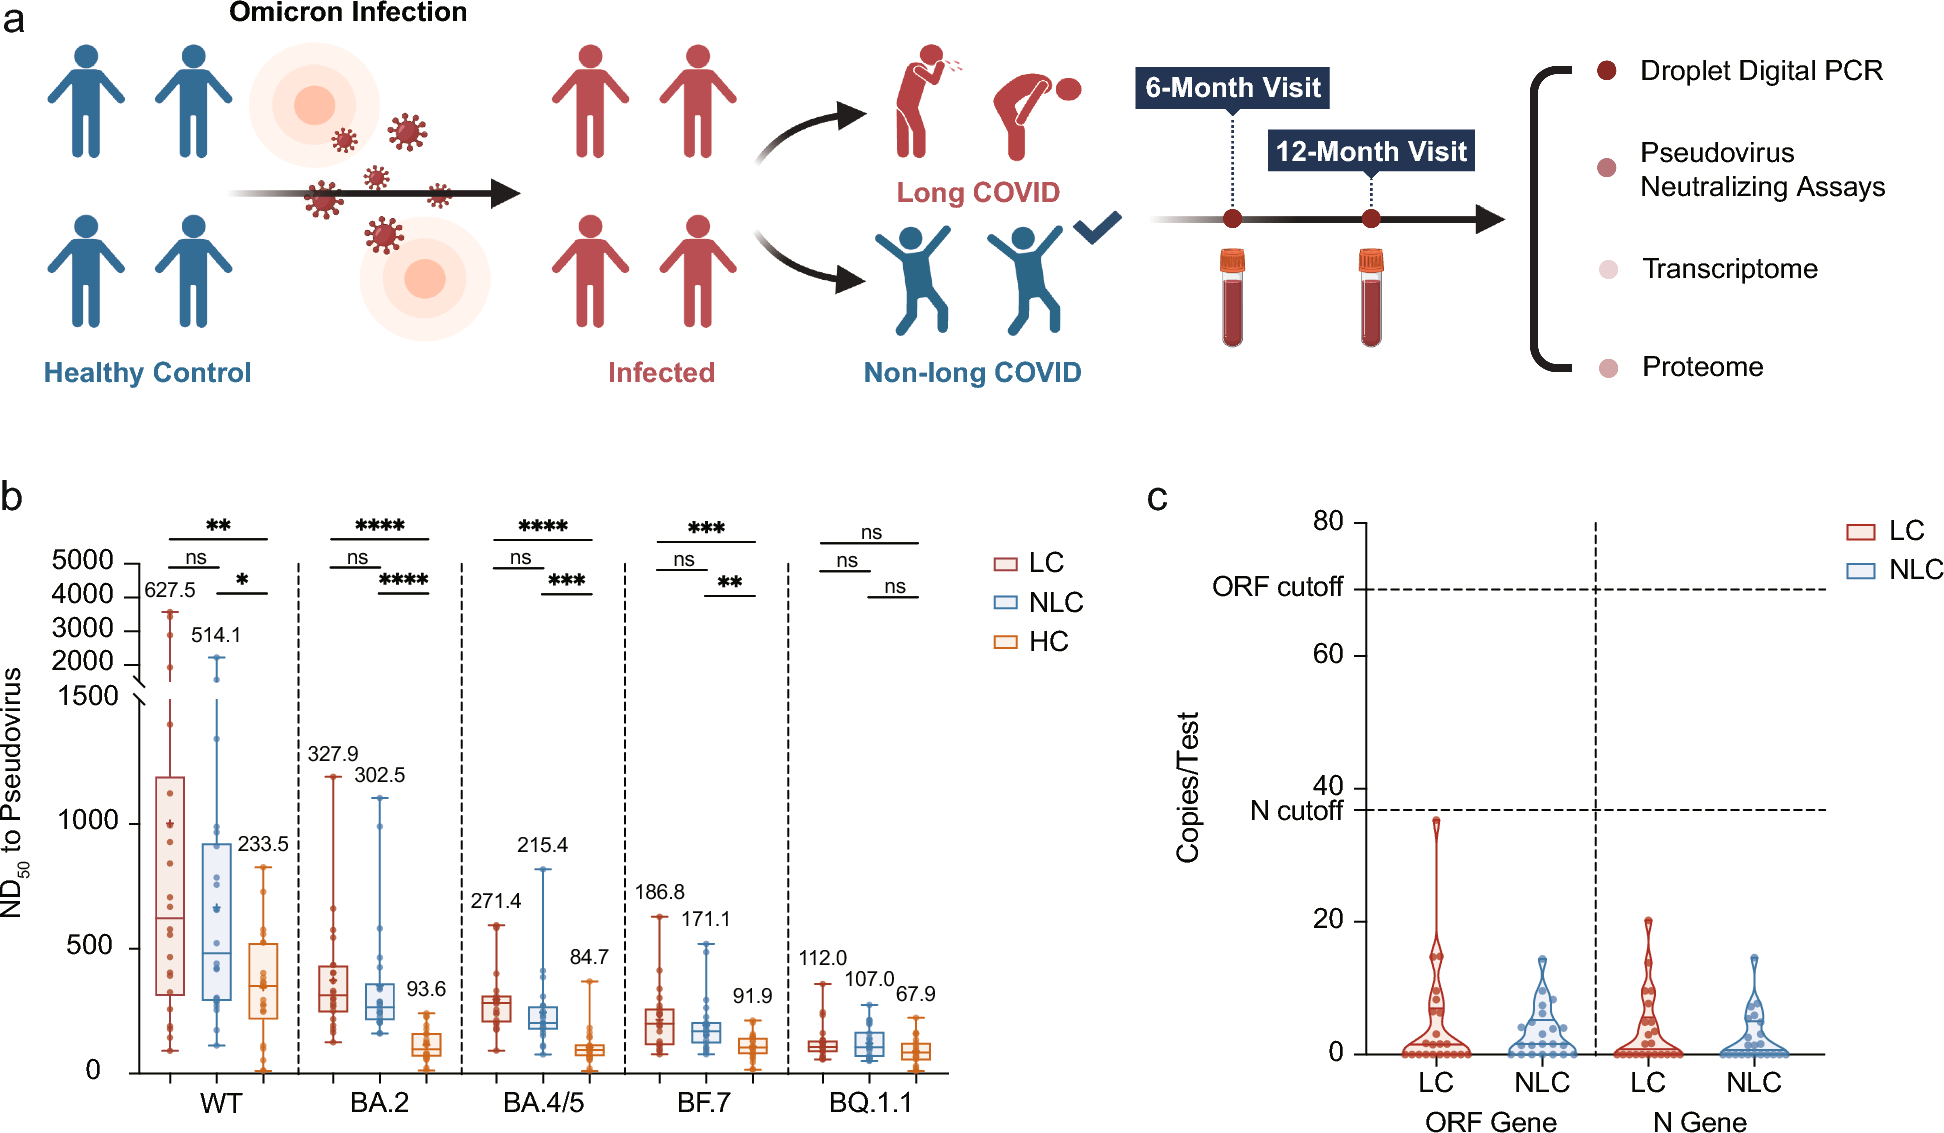
Fig. 1
Study design, and analysis of plasma neutralizing antibody titers and SARS-CoV-2 viral load. a The study population consisted of both healthy individuals and patients infected with Omicron. Among the COVID-19 convalescents, they were categorized into two groups based on the self-reported long COVID symptoms. Clinical data and blood samples were collected at the 6- and 12-month follow-ups. A comparative analysis was performed across the three groups by evaluating plasma viral load, neutralizing antibody titers, proteomics, and whole blood transcriptomics. b Pseudovirus neutralizing test was performed to measure the plasma-neutralizing activity against SARS-CoV-2 prototype and variants. The geometric mean neutralizing antibody titers are shown as box plots. P values were calculated from a paired two-tailed Student’s t-test. ***P < 0.001, **P < 0.01, *P < 0.05. ns: no significant difference. c Violin plots show the copies of SARS-CoV-2 ORF gene and N gene per test detected via droplet digital PCR (ddPCR), indicating the viral load of SARS-CoV-2 in plasma
Table 1 Demographic and clinical characteristic of participantsBlood virus-neutralizing antibody titers and viral load in long COVID populationsAround 6 months after SARS-CoV-2 infection, neutralizing antibody titers of the LC and NLC Groups were significantly higher than that of the healthy donors, excluding antibody against BQ1.1. Although there was no evidence of a clear difference in these neutralizing antibody titers between the LC and NLC Groups, long COVID populations tended to have higher antibody levels (Fig. 1b).
Previous studies revealed that viral persistence and reactivation was one of the potential mechanisms of long COVID [15]. In this study, droplet digital PCR was performed for quantification of residual plasma SARS-CoV-2 among the LC and the NLC Groups. Results turned out to be negative in both LC and NLC Groups, indicating no persistent SARS-CoV-2 remaining in the blood 6 months after infection (Fig. 1c).
Transcriptome atlas suggested suppressive chemokines and interleukins signaling functions 6 months post COVID-19, with upregulated neutrophil activity in the LC GroupTo gain insight into the molecular characteristics of long COVID, the transcriptomic profiles were compared among LC, NLC, and HC Groups. A principal component analysis (PCA) was performed with the host gene expression profiles to examine clustering of the global transcriptomic profiles of all samples. Nevertheless, the separation was not notable among the three groups (Fig. 2a), and the transcriptomic profiles were not significantly different between the LC and NLC Groups (Supplementary Fig. 1a). In the differential gene expression analysis, pairwise comparisons were made among these 3 groups, and differentially expressed genes (DEGs) were visualized by volcano plots (Figs. 2b, c, 4a). The findings revealed significant differential expression of genes, with 117 genes, 288 genes and 286 genes showing notable distinctions (P < 0.05, |log2FoldChange|> 1) between the LC and NLC Groups, the LC and HC Groups, and the NLC and HC Groups, respectively. Furthermore, the results indicated that the transcriptomic differences before and after SARS-CoV-2 infection were greater than the differences between long COVID and non-long COVID.
Fig. 2
Differential transcriptomic profiling across the LC, NLC and HC Groups. a The principal coordinate analysis plot showing the grouping of samples from the three groups based on global gene expression profiles. b The volcano plot of DEGs between the LC and HC Groups. The significant DEGs are highlighted in red (upregulated genes in LC) or blue (downregulated genes in LC). The unsignificant DEGs are marked in grey. The most distinctly expressed genes are labeled. c The volcano plot of DEGs between the NLC and HC Groups. The significant DEGs are highlighted in red (upregulated genes in NLC) or blue (downregulated genes in NLC). The unsignificant DEGs are marked in grey. The most distinctly expressed genes are labeled. d Expression patterns of both DEGs between the LC and HC Groups and DEGs between the NLC and HC Groups, across three groups. e Dot plot showing Reactome terms enriched in each cluster mentioned in Fig. 2d
To analyze distinct expression patterns of the LC, NLC, and HC groups, differential genes were classified into 6 clusters using Mfuzz (Fig. 2d). Genes in cluster 2 were enriched in MAPK-related signaling pathways. Genes in cluster 3, which were significantly higher expressed in the LC Group than the NLC Group and HC Group, were associated with neutrophil degranulation and interleukins (Fig. 2e). Cluster 4 genes were mainly involved in chemokine-related functions (Fig. 2e). Cluster 5 and cluster 6 genes were highly expressed in the heathy individuals compared to those having had a COVID-19 infection, and the genes had an enrichment of chemokine and interleukins signaling pathways (Fig. 2e). Genes in cluster 5 and 6, including FOS, IL1B, CCR5, CCR2, CXCR3, and IL5RA, which represented functions of chemokines and interleukins, recovered to normal levels 12 months after infection (Supplementary Fig. 1b).
Our gene results suggested that, in contrast to the NLC Group, individuals in the LC Group had a stronger neutrophil function at 6 months post SARS-CoV-2 infection. Moreover, there was a decrease of chemokines and interleukins signaling functions in the participants at half a year post-infection, compared to the healthy individuals, and those functions recovered at the 12-month follow-up with the relief of long COVID symptoms.
Proteomic atlas revealed upregulated neutrophil activity in the LC GroupTo analyze alterations in proteins associated with long COVID, proteomics profiles were compared among the LC, NLC, and HC Groups. Consistent with transcriptomic profiles, PCA results suggested that protein profiles were indistinguishable among the 3 groups (Fig. 3a). Pairwise comparisons were made among these 3 groups, in the differential protein expression analysis. The differentially expressed proteins (DEPs) were visualized by volcano diagrams (Figs. 3b, c, 4b), which revealed significant differential expression, with 76 proteins, 397 proteins, and 125 proteins showing notable distinctions (P < 0.05, |log2FoldChange|> 0.25) between the LC and NLC Groups, the LC and HC Groups, and the NLC and HC Groups, respectively. Similar to the transcriptomic profiles, the proteomic data also exhibited that the differences before and after infection were more significant in contrast to those between long COVID and non-long COVID individuals (Supplementary Fig. 2a).
Fig. 3
Differential proteomic profiling across the LC, NLC and HC Groups. a The principal coordinate analysis plot showing the grouping of samples from the three groups based on global protein abundance profiles. b The volcano plot of DEPs between the LC and HC Groups. The significant DEPs are highlighted in red (upregulated genes in LC) or blue (downregulated genes in LC). The unsignificant DEPs are marked in grey. The most distinctly upregulated or downregulated proteins are labeled. c The volcano plot of DEPs between the NLC and HC Groups. The significant DEPs are highlighted in red (upregulated genes in NLC) or blue (downregulated genes in NLC). The unsignificant DEPs are marked in grey. The most distinctly upregulated or downregulated proteins are labeled. d Expression patterns of both DEPs between the LC and HC Groups and DEPs between the NLC and HC Groups, across three groups. e Dot plot showing Reactome terms enriched in each cluster mentioned in Fig. 3d
Fig. 4
Heterogeneity in long COVID patients with elevated neutrophil degranulation. a The volcano plot of DEGs between the LC and NLC Groups. The significant DEGs are highlighted in red (upregulated genes in LC) or blue (downregulated genes in LC). The unsignificant DEGs are marked in grey. Distinctly expressed genes extracted from the core PPI cluster in Fig. 4c are labeled. b The volcano plot of DEPs between the LC and NLC Groups. The significant DEPs are highlighted in red (upregulated genes in LC) or blue (downregulated genes in LC). The unsignificant DEPs are marked in grey. Distinctly upregulated proteins extracted from the core PPI cluster in Fig. 4c are labeled. c Networks generated by String database analysis using DEGs and upregulated DEPs upregulated in the LC Group compared to the NLC Group. The red and blue nodes indicate DEGs, and DEPs inputted for analyses, respectively. d Hierarchical clustering of the long COVID patients (LC Group). Major branches are differentially colored. e The principal coordinate analysis plot showing the grouping of samples from the NU-LC Group and ND-LC Group based on global gene expression profiles. f The principal coordinate analysis plot showing the grouping of samples from the NU-LC Group and ND-LC Group based on global protein abundance profiles. g Bar plots showing top5 enriched Reactome terms of DEGs between the ND-LC and NLC Group. The significant terms are highlighted in orange (terms enriched of upregulated genes in ND-LC) or green (terms enriched of downregulated genes in ND-LC). The unsignificant terms are marked in grey (P value > 0.05 or Gene count < 4). h Bar plots showing top5 enriched Reactome terms of DEPs between the ND-LC and NLC Group. The significant terms are highlighted in orange (terms enriched of upregulated proteins in ND-LC) or green (terms enriched of downregulated proteins in ND-LC). The unsignificant terms are marked in grey (P value > 0.05 or Gene count < 4). i Violin plots show the average of neutrophil counts of the NLC, ND-LC and NU-LC Groups. P values were calculated from a paired two-tailed Student’s t-test. ***P < 0.001, **P < 0.01, *P < 0.05. ns: no significant difference. j Gene set enrichment analysis of DEGs between ND-LC and NU-LC Groups of Reactome Neutrophil Degranulation pathway dataset. Normalized enrichment score (NES) and P values are shown. k Dot plot showing enriched Reactome terms of DEPs between the ND-LC and NU-LC Group
To analyze different expression patterns of the LC, NLC, and HC groups, DEPs were classified into 6 clusters using Mfuzz (Fig. 3d). Proteins in cluster 1 were associated with biological oxidations pathway, which indicated that biological oxidations are more pronounced in the LC group compared to both the NLC and HC groups. This finding aligns with research that reports heightened oxidative stress following COVID-19 infection [28]. Specifically, the more intense oxidative response in the LC group compared to the NLC group suggested that oxidative stress may play a role in the development of long COVID symptoms [29, 30]. Paul and colleagues suggested that imbalances in redox reactions can lead to neurological manifestations and organ damage in long COVID [31]. Both clusters 2 and 3 showed enrichment in pathways related to neutrophil degranulation (Fig. 3e). Proteins in cluster 3, which were significantly higher in the LC Group than the NLC Group and HC Group, were also enriched in pathways of extracellular matrix organization and diseases of metabolism (Fig. 3e). Cluster 4 and cluster 5 proteins were mainly involved in platelet function, suggesting that SARS-CoV-2 continued to have an impact on platelet function 6 months post infection (Fig. 3e). Proteins in cluster 6 had an enrichment of RHO GTPase cycle effectors pathways (Fig. 3e). Our proteins result resembled what we saw in transcriptomic data, which indicated that in contrast to the NLC Group, individuals in the LC Group had stronger neutrophil function at 6 months post SARS-CoV-2 infection.
Distinct neutrophil degranulation activation within long COVID patientsOn the full-transcriptomic and proteomic evaluation, no distinct difference between LC group and NLC group was observed. Further PPI network analysis was performed using both genes and proteins significantly upregulated in the LC group compared to the NLC group (Fig. 4a, b). Remarkably, the largest PPI network cluster was correlated with the innate immune system, especially neutrophil and its degranulation function (Fig. 4c). In the LC group, expression of individual markers within the long COVID cohort was highly heterogeneous based on blood full transcriptome (Fig. 4d), which suggested potential subsets within the long COVID group with heterogeneous innate immunologic activity, especially neutrophil-related immune functions. In accordance with the hypothesis, unsupervised clustering of the long COVID group revealed a clear separation of the two subsets in the overall cohort (Fig. 4e, f). Pathway enrichment analysis of transcriptome profiling in reference to NLC group revealed that neutrophil degranulation biological pathway was positively associated with one of the subsets while negatively associated with the other one (Fig. 4g, h). The neutrophil degranulation upregulated group was hereafter referred as the neutrophil-function upregulated (NU-LC) subset, and the other one with downregulated neutrophil degranulation was named as the neutrophil-function downregulated (ND-LC) subset. Assessment of the neutrophil-related inflammation activity markers such as CXCL2, VWF, IL33, IL23R in the plasma protein sets showed significant abundances in the NU-LC Group compared to the ND-LC Group (Supplementary Fig. 2b).Participants in the NU-LC Group had higher level of neutrophil counts than the ND-LC Group and the NLC Group (Fig. 4i and Table 2). Further GSEA analysis revealed significant differences in the function of neutrophil degranulation between the two subsets (Fig. 4j). Furthermore, the enrichment of DEPs upregulated in the NU-LC compared to the ND-LC also demonstrated elevated neutrophil degranulation activity in the NU-LC Group (Fig. 4k).
Table 2 Demographic and clinical characteristic of long COVID patientsClinical distinctions in NU-LC subsetWe further explored variations in neutrophil-related immune status within the NU-LC subset from 6 to 12 months post-COVID-19 infection. Analysis of gene expression scores associated with neutrophil degranulation indicated that elevated neutrophil activity in the NU-LC group gradually returned to levels similar to the NLC group (Fig. 5a). The distinct neutrophil-related inflammatory signaling in the blood of the NU-LC and ND-LC subsets indicated clinical heterogeneity among long COVID cohorts. The NU-LC group had significantly elevated neutrophil counts compared to the ND-LC and NLC groups, though within normal clinical ranges (Fig. 4i and Table 2). Increases in neutrophil counts were also connected with several broad markers of inflammation including C-reaction protein, procalcitonin (PCT) and erythrocyte sedimentation rate (ESR) (Fig. 5c). These increases also indicated different immune endoenvironments between NU-LC and ND-LC Groups, as patients in the NU-LC Group were potentially in a relatively inflammatory status. Moreover, elevated neutrophil counts were positively associated with psychological questionnaire scale score in the NU-LC group, such as depression and anxiety, which was opposite in the ND-LC group, establishing the implications in neutrophil-related long COVID symptoms (Fig. 5b, c).
Fig. 5
Clinical features of NU-LC subset. a An interval plot with the mean and 95% confidence interval represents dynamic changes of Neutrophil Degranulation Score of NU-LC Group, from the 6-month visit to the 12-month visit, compared to the NLC Group. b Correlogram of ND-LC Group. Spearman rank order correlation values (r) are shown from blue (− 1.0) to red (1.0); r values are indicated by color and circle size. Yellow rectangles denote correlation between neutrophil counts and scores of psychosocial questionnaires. c Correlogram of NU-LC Group. Spearman rank order correlation values (r) are shown from blue (− 1.0) to red (1.0); r values are indicated by color and circle size. Yellow rectangles denote correlation between neutrophil counts and scores of psychosocial questionnaires. Red rectangles denote correlation between neutrophil counts and other inflammatory indexes
Altogether, these findings indicate that while the long COVID questionnaires could help with identifying individuals with ‘long COVID’ symptoms, heterogeneity exists in the long COVID population. There was a group of people who had a relatively stronger neutrophil-related inflammatory response that was positively associated with a worse mental state, and they might be suffered from neutrophil-based immunopathological injury to some extent. The remaining group had a blood ecosystem status more similar to that of the non-long COVID population, suggesting their long COVID symptoms were more likely to be psychology-related without tissue or organ impairment.
Classifying NU-LC through machine learningTo accurately distinguish NU-LC individuals within the long COVID patients, we employed Random Forest (RF) modeling, which effectively classified NU-LC patients from all other long COVID individuals. The resulting predictive model exhibited exceptional robustness. Evaluation based on 10,000 models with randomized training and test set splits yielded an average ROC AUC of 0.95 (SD+/−0.04). This indicates that, unlike the broader long COVID cohort, NU-LC patients could be efficiently identified regardless of the specific patient set used for model training. To this end, we manually curated a list of 5 genes from the most influential NU-LC discriminators, including ABCA13, CEACAM6, CRISP3, CTSG, and BPI (Fig. 6a). Those genes were then used as inputs for a new RF model (Fig. 6b). Despite the limited feature set, leveraging feature potency scores to guide parameter selection resulted in a model that remained effective in distinguishing the NU-LC Group. It achieved an average ROC AUC of 0.9596, underscoring that complete transcriptomic screening is not necessary for identifying these patients.
Fig. 6
Identifying NU-LC with small feature gene sets. a The volcano plot of DEGs between the NU-LC and ND-LC Groups. The significant DEGs are highlighted in red (upregulated genes in NU-LC) or blue (downregulated genes in ND-LC). The unsignificant DEGs are marked in grey. The distinctly expressed genes selected as feature gene sets are labeled. b Receiver-operating characteristic (ROC) plot displaying one model with randomized train/test splits classifying NU-LC from other long COVID patients using the manually curated list of 5 high-potency genes identified in a. c The average expression level of the manually curated 5 genes, identified in a, of the NLC, ND-LC and NU-LC Groups, are shown as box plots. P values were calculated from a paired two-tailed Student’s t-test. ***P < 0.001, **P < 0.01, *P < 0.05. ns: no significant difference
Significant differences in the expression of the five genes were observed between the ND-LC and NU-LC groups, with the NU-LC group showing significantly higher expression than the ND-LC group (Fig. 6c). Furthermore, the expression levels of these five genes are significantly higher in the NU-LC group compared to the NLC group, while the expression levels are similar between the HC and NLC groups (Supplementary Fig. 3). ABCA13 mediates transmembrane lipid transport, including cholesterol and phospholipids [32]. Its aberrant expression can cause lipid dysregulation and is linked to psychiatric disorders [33,34,35]. Research indicates that CEACAM6 facilitates neutrophil adhesion to endothelial cells, which in turn mediates their activation [36]. Moreover, upregulation of CRISP3 can promote leukocyte-mediated migration and neutrophil activation and degranulation and is closely associated with pulmonary fibrosis in COVID-19 patients [37, 38]. CTSG is mainly found in the azurophilic granules of neutrophils, participating in the killing and digestion of phagocytosed pathogens [39], and increased levels of CTSG protein have been observed in the nasopharynx of COVID-19 patients [40]. Furthermore, BPI is primarily located in neutrophil granules and is a critical component of the innate immune system, playing an essential role in protecting the body from bacterial infections [41].
In the future, these genes could be set as specific targets and their expression levels would assist with identifying this specific patient subset among individuals with long COVID. However, the functional roles of these genes in the pathogenesis of long COVID require further investigation in future studies.
留言 (0)