
記住我


The study protocol was approved by all appropriate Institutional Review Boards and was in compliance with material transfer guidelines and data use agreements between Georgia State University and the participating institutes. The study was conducted in accordance with International Ethical Guidelines for Biomedical Research involving human subjects. Written informed consent was obtained from all participants. For MS analysis, serum from 51 breast cancer patients was collected from the Prospective Breast Cancer Biobank (PBCB) project, which enrolled patients at Stavanger University Hospital, Stavanger, Norway and Haukeland University Hospital, Bergen, Norway between 2012 and 2020.
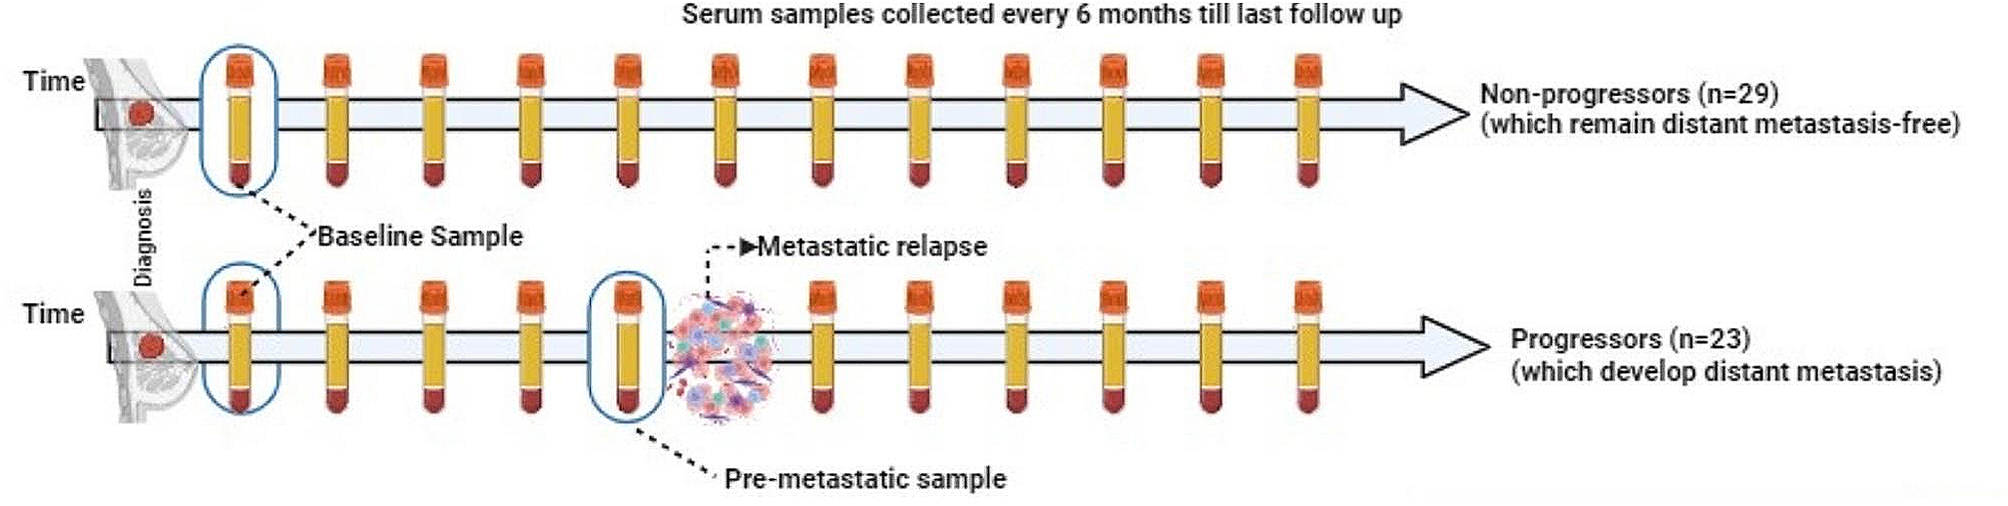
The study design including patient and patient samples is summarized in Fig. 1. Twenty-nine serum samples were obtained from patients with BC who did not progress to metastasis (also referred to as non-progressors), and 42 samples were obtained from 22 patients who were later diagnosed with distant metastases (progressors). For the non-progressors, one sample was collected within one year after diagnosis was analyzed. For each patient with metastasis, we analyzed two samples: one collected within a year after diagnosis (diagnostic serum sample) and the other collected within one year before the development of metastasis (pre-metastatic serum sample). Pre-metastatic sample was missing for two patients with metastasis, however, these patients had duplicate diagnostic samples.
Fig. 1
Prospective Breast Cancer Biobanking (PBCB) study: sampling workflow for proteomics analysis. Three distinct samples were examined in the study. These included diagnostic serum samples collected from non-progressors and progressors, and pre-metastatic samples collected from progressors (all indicated in blue boxes)
Patients without distant metastasis were matched to those with distant metastasis according to tumor site, age (± 5 years), chemotherapy, and hormone receptor status. The median age at diagnosis for non-progressors was 55 years, and the median follow-up time was 73.5 months. The median age at diagnosis for progressors was 54 years, and the median follow-up time was 62 months. The clinicopathological characteristics of the patients are summarized in Table 1. Importantly, patients who developed metastasis and those that did not progress further were matched to the extent possible for their grade and presence of lymph node status, at the time of serum collection. All the non-progressors were alive at the time of last clinical follow up. In contrast, about 50% of the progressors were alive with distant metastasis and the rest were dead during the same follow up period.
Table 1 Clinicopathological characteristics of breast cancer patientsMS-based serum proteomicsThe mass spectrometer-based proteome profiling of serum was carried out as previously described [6]. . Briefly, the serum was thawed at 37oC and 10 µl was incubated with the top 12 abundant serum protein depletion kit (Thermo Scientific Pierce, Cat# 85,164) and digested with trypsin on S-Trap column (ProtiFi, NY). Thereafter, the digested peptides were eluted and vacuum dried. The peptides were then fractionated using the high pH STAGE method [7] into single pools, which was then vacuum dried.
The dried peptide samples were analyzed on an Orbitrap Fusion mass spectrometer (Thermo Fisher Scientific) coupled with an Easy-nLC 1000 nanoflow LC system (Thermo Fisher Scientific). An in-house trap column (2 cm × 100 μm i.d.) and a 5 cm × 150 μm capillary separation column packed with 1.9 μm Reprosil-Pur Basic C18 beads (Dr. Maisch, r119.b9.) were used for nano-HPLC separation in a discontinuous gradient of 4–26% acetonitrile, 0.1% formic acid at a flow rate of 800 nL/min.
The mass spectrometer was operated in a data-dependent mode, acquiring fragmentation spectra of the top 30 strongest ions under the control of Xcalibur software version 4.1 (Thermo Fisher Scientific). The parental ion was acquired in the Orbitrap with a full MS range of 300–1400 m/z at a resolution of 120,000. Higher-energy collisional dissociation (HCD) fragmented MS/MS spectra were acquired in the ion trap with rapid scan mode. The MS/MS spectra were searched against the target-decoy Human RefSeq database (release Jan. 21, 2020, containing 80,872 entries) in Proteome Discoverer 2.1 (Thermo Fisher Scientific) with the Mascot algorithm (Mascot 2.4, Matrix Science). The precursor mass tolerance was 20 ppm, and the fragment mass tolerance was 0.5 Da. Two maximum missed cleavages and dynamic modifications of acetylation of the N-terminus and oxidation of methionine were allowed. Assigned peptides were filtered with a 1% false discovery rate (FDR) using Percolator validation based on q-value.
The MS/MS spectra were searched against the target-decoy Human RefSeq database (release Jan. 21, 2020, containing 80,872 entries) in Proteome Discoverer 2.1 (Thermo Fisher Scientific) with the Mascot algorithm (Mascot 2.4, Matrix Science). The precursor mass tolerance was 20 ppm, and the fragment mass tolerance was 0.5 Da. Two maximum missed cleavages and dynamic modifications of acetylation of the N-terminus and oxidation of methionine were allowed. Assigned peptides were filtered with a 1% false discovery rate (FDR) using Percolator validation based on q-value.
The Peptide Spectrum Matches (PSMs) output from Proteome Discoverer 2.1 was used to group peptides onto the gene level using the ‘gpGrouper’ algorithm (1). An in-house program, gpGrouper, uses a universal peptide grouping logic to accurately allocate and provide MS1-based quantification across multiple gene products. Protein quantification was performed using the label-free, intensity-based absolute quantification (iBAQ) approach and then normalized to FOT (a fraction of the total protein iBAQ amount per experiment). FOT was defined as an individual protein’s iBAQ divided by the total iBAQ of all identified proteins within one experiment.
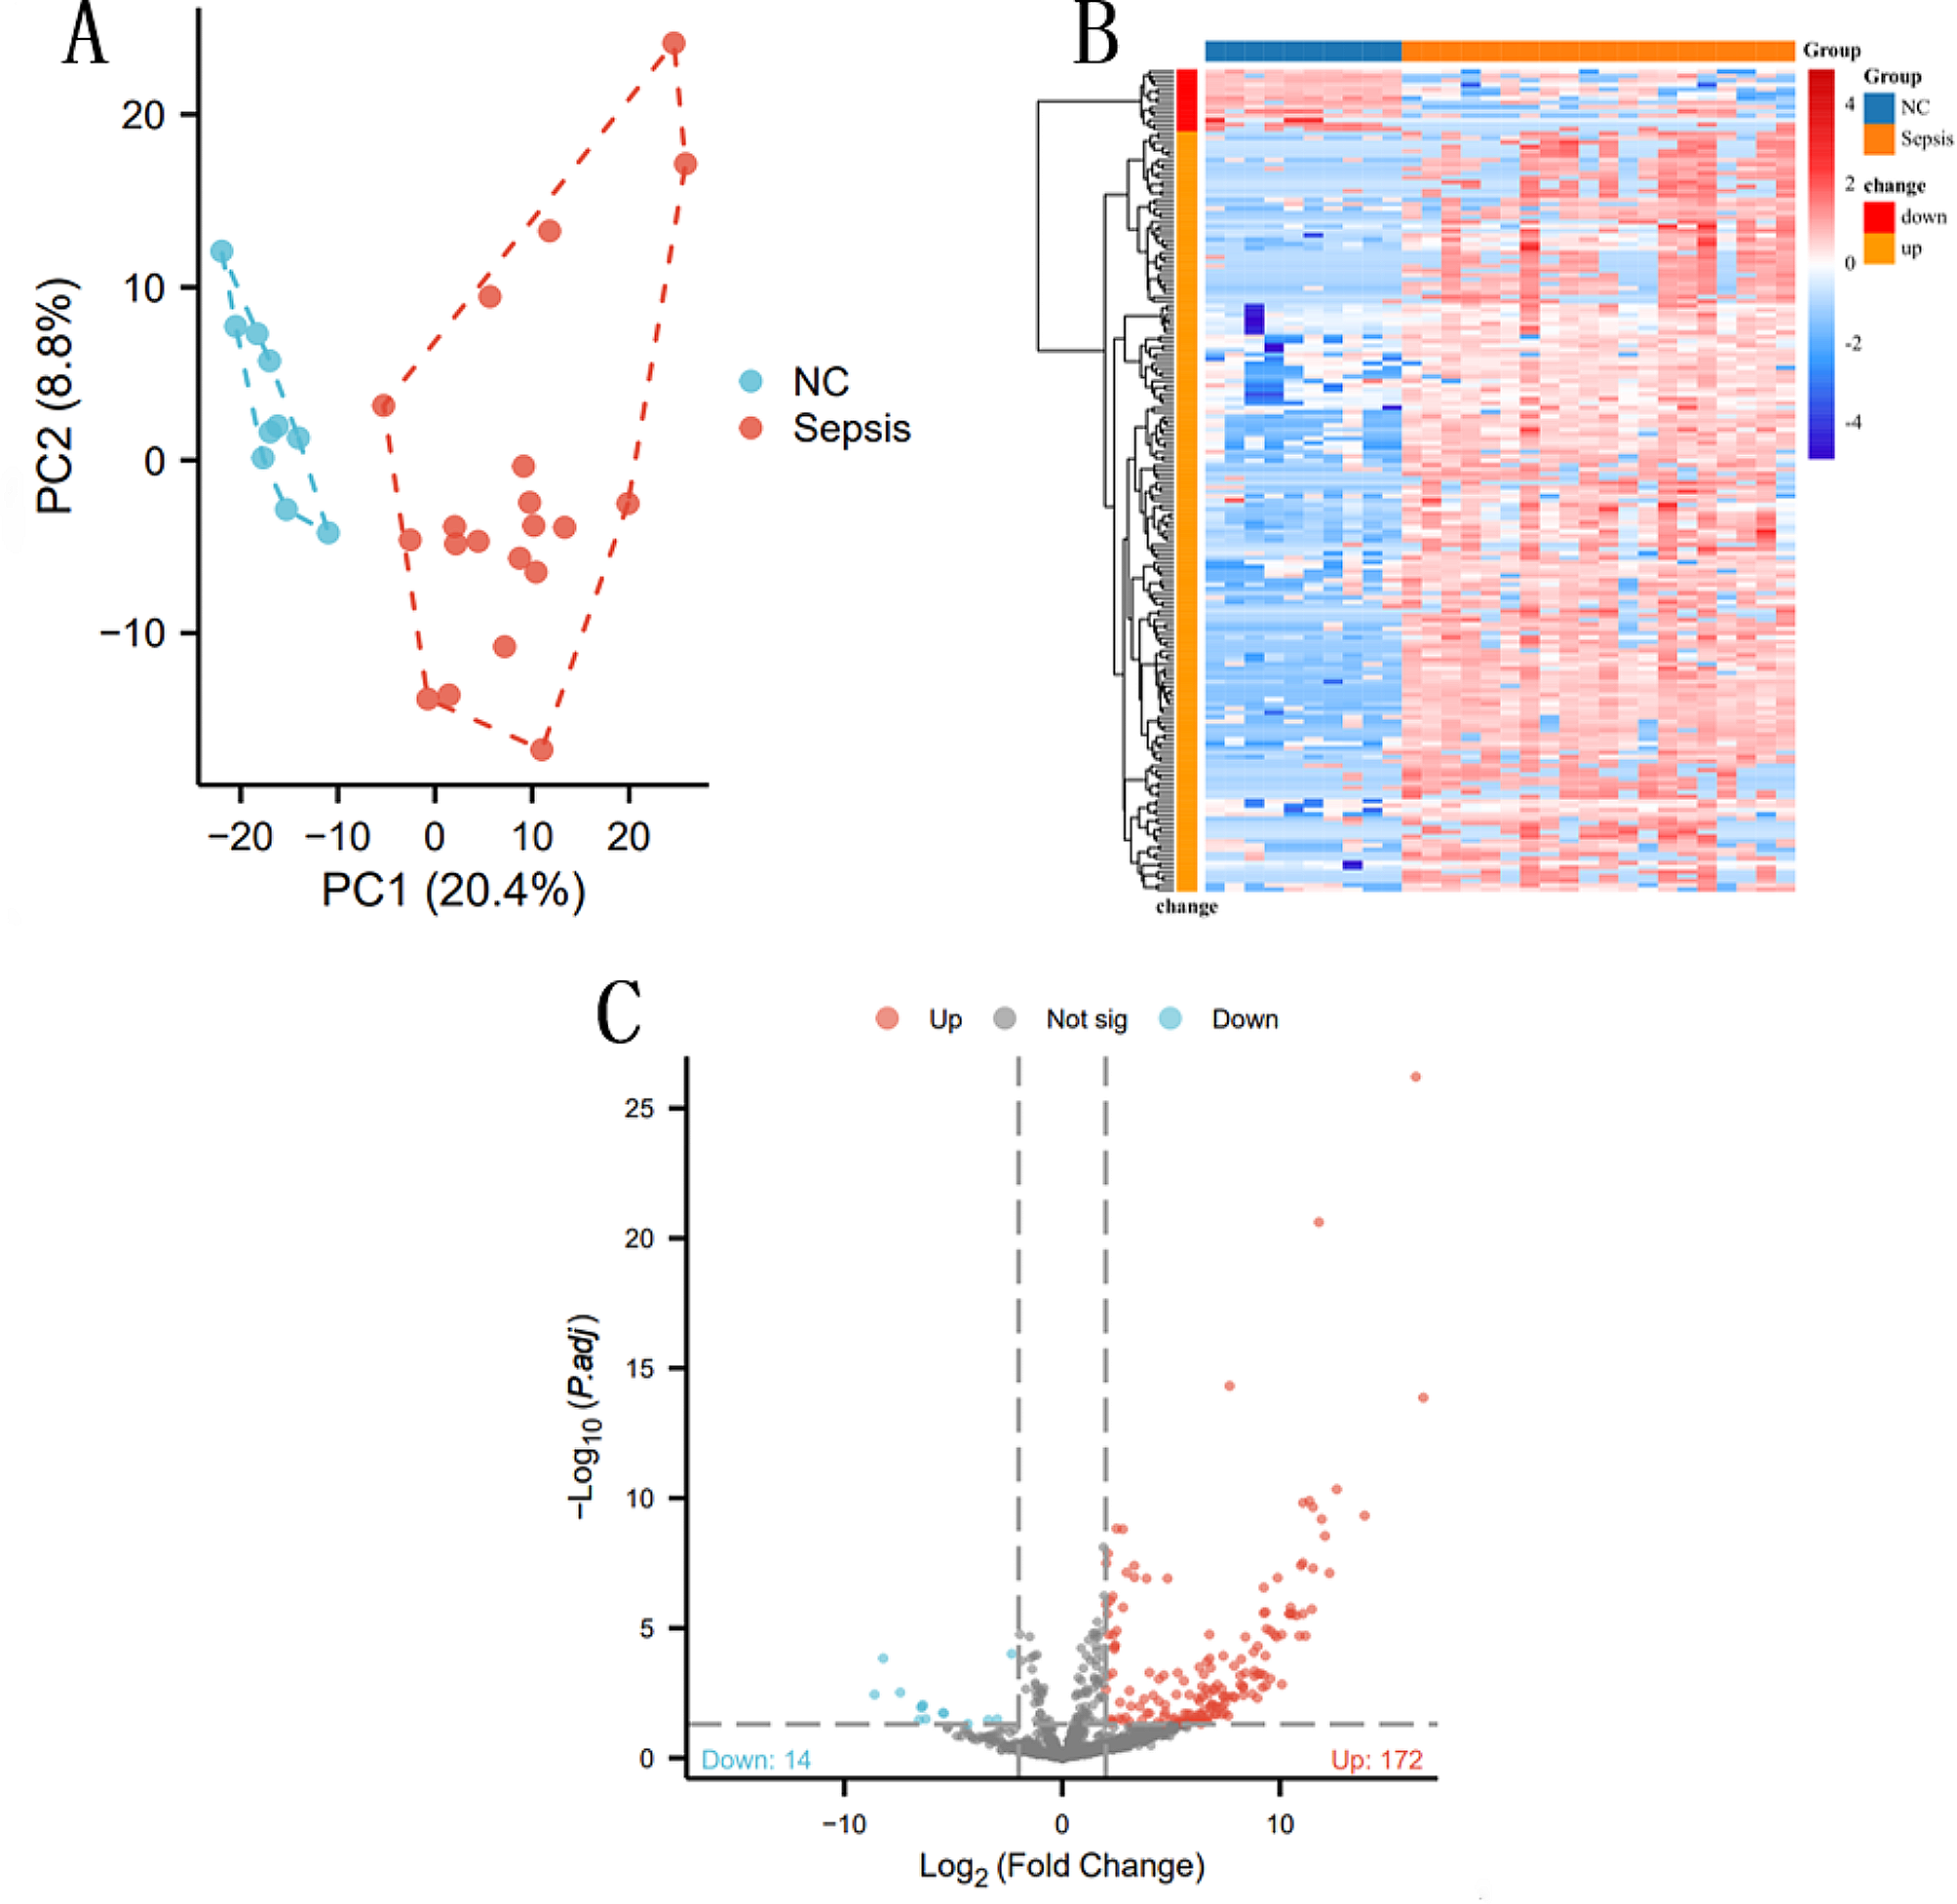
Statistical analysisMissing values in the proteome recovery were replaced with half of the minimally detected value in the entire dataset. After log2 transformation of this dataset, differential analysis (t-test) was performed comparing the proteome of (i) non-progressors and progressors at diagnosis, and (ii) diagnostic and pre-metastatic serum within the progressors. Any protein was deemed to have statistically altered expression if it had a p-value of < 0.05, greater than 1.5 linear fold change, and was detected in over 30% of the samples in any clinical group (differentially expressed proteins or DEPs).
Volcano plots were used to display DEPs (i) at diagnosis by comparing serum samples from patients with BC who did not develop metastasis (non-progressors) vs. patients who eventually developed metastatic progression (progressors) over the period of clinical follow-up and (ii) during progression to metastatic disease by comparing matched serum samples collected at diagnosis with samples collected prior to onset of metastatic disease in the progressors. The latter involved two comparisons: a nested comparison where proteins altered in the diagnostic samples were examined for their expression in the pre-metastatic samples collected from progressors, and a second global comparison that examined for additional proteins that were also altered between the diagnostic and pre-metastatic samples within the progressors. The selected DEPs were analyzed using Advaita Bio’s iPathwayGuide, a systems biology approach for pathway level analysis [8].
Survival analysisTo assess proteins that may be associated with overall survival, we used Kaplan–Meier method and the difference was tested using the log-rank test on the serum samples collected at diagnosis from progressors who later developed distant metastasis. Patients were divided into two groups based on their protein expression level: median high (expression above median) vs. median low (expression below median). Proteins with missing values greater than 10% were excluded. p-values less than 0.05 were considered as significantly different. Clinical variables analyzed with p-value less than 0.05 using single variant analysis were chosen to enter Cox regression multivariate analysis. The SPSS 22.0 software (IBM Corp.) and the R package “survival” were used for survival statistical tests.
Data availabilityThe mass spectrometry data for proteome profiling have been deposited via the MASSIVE repository (MSV000094255) to the Proteome X change Consortium (http://proteomecentral.proteomexchange.org) with the dataset identifier PXD050451).
留言 (0)