
記住我
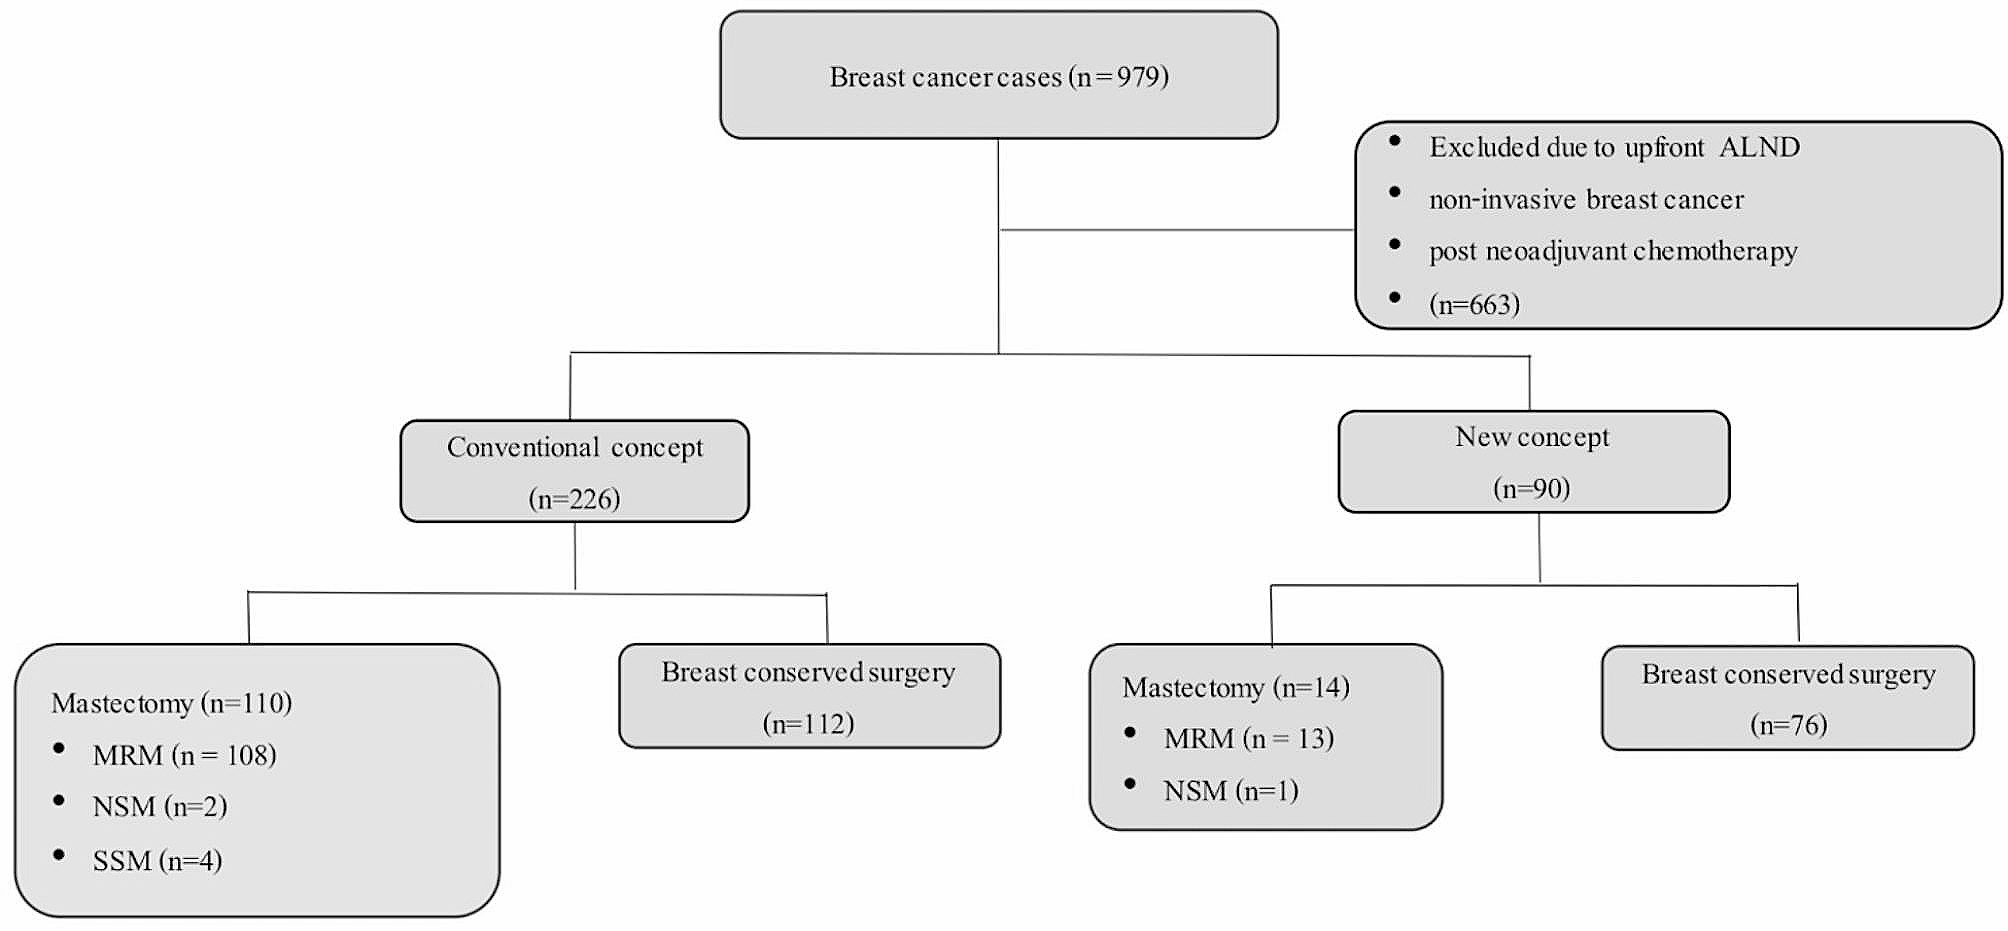
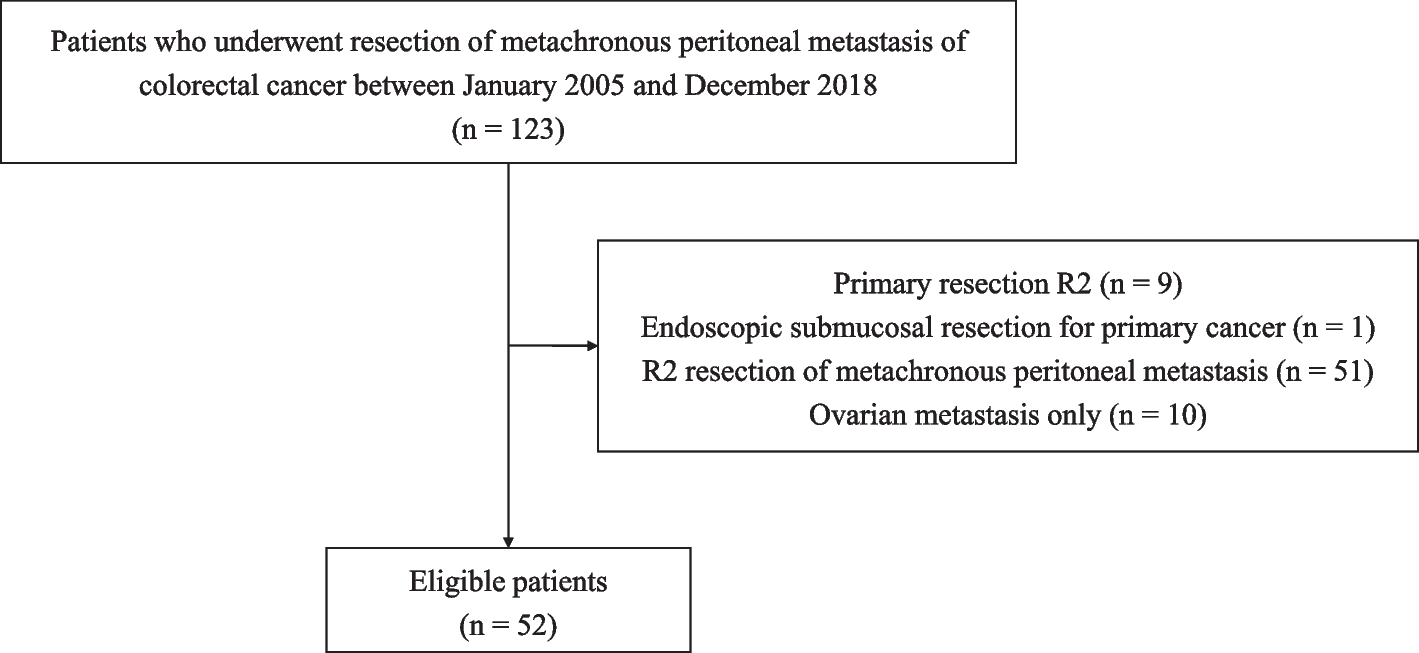

The total number of patients studied was 848. Of these, 632 eligible patients from SYSU cohort were enrolled in this study, which were divided into a training set and an internal validation set on a 7:3 basis. 216 patients from GXMU cohort were regarded as the external validation set. The process of screening patients was shown in Fig. 1. The characteristics of all enrolled patients were illustrated in Fig. 2a and b. More details about patients in different groups were presented in Table 1.
Fig. 1
The flowchart of the study
Fig. 2
Clinical features of the Sun Yat-sen University (SYSU) cohort (a) and Guangxi Medical University (GXMU) cohort (b). The forest plot of the univariate (c) and multivariate logistics analysis (d). The nomogram to predict distant metastasis risk for anemic gastric cancer patients (e)
Table 1 Clinical characteristics of gastric cancer patientsIndependent risk factors of distant metastasisTo identify the risk factors of distant metastasis, 29 preoperative variables were included. The results of the univariate and multivariate logistic regression analysis are presented in Table 2. Age, pyloric obstruction, WBC, NEU, CA125, CA199, tumor location, tumor size, T stage, N stage, and preoperative weight loss were strongly associated with distant metastasis according to univariate logistic regression (Fig. 2c, p < 0.05). Multivariate analysis identified pyloric obstruction, CA125, T stage, N stage, tumor size and preoperative weight loss as the independent predictors of distant metastasis (Fig. 2d, p < 0.05), which were chosen to develop the nomogram.
Table 2 Logistic regression analyses of distant metastasis in gastric cancer patientsConstruction and validation of the nomogram for distant metastasisA nomogram of distant metastasis was constructed by integrating the six independent predictors above (Fig. 2e). The C-index of the nomogram for identifying distant metastasis in the training set was 0.859 [95% confidence interval (95% CI): 0.831–0.887]. In the validation sets, the C-index was 0.843 (95% CI: 0.774–0.912) internal and 0.748 (95% CI: 0.657–0.839) external. The performance of the nomogram was evaluated by calculating AUC of the ROC curve, with the AUC in training set being 0.859 (sensitivity = 0.767, specificity = 0.815, Fig. 3a), 0.843 (sensitivity = 0.805, specificity = 0.789, Fig. 3b) in the internal validation set, and 0.748 (sensitivity = 0.568, specificity = 0.838, Fig. 3c) in the external validation set. Subsequently, we conducted DCA analyses to evaluate the clinical efficacy of the nomogram, which revealed excellent clinical relevance, as demonstrated in Fig. 3d and f. Moreover, the prediction and the actual incidence of distant metastasis were in good agreement, as evidenced by the calibration curve (Fig. 3g and i). The C-index, NRI, and IDI all demonstrated that the nomogram model was more accurate in predicting performance compared to individual factors (Table 3).
Fig. 3
The ROC curve of the training set (a), internal validation set (b) and external validation set (c). The DCA curve of the training set (d), internal validation set (e) and external validation set (f). The calibration curve of the training set (g), internal validation set (h) and external validation set (i). The multiROC curve of the training set (j), internal validation set (k) and external validation set (l). The multiDCA curve of the training set (m), internal validation set (n) and external validation set (o)
Table 3 C-index, NRI, and IDI of the nomogram and predicted factor alone in predicting distant metastasis for gastric cancer patientsComparison of nomogram with individual independent factorsThe predictive effectiveness of the nomogram was further assessed by comparison with individual independent prognostic factors using multiple ROC and DCA curves. The results of the multiple ROC curves in the training set showed that the AUC of the nomogram (AUC = 0.856) was superior to that of the pyloric obstruction (AUC = 0.524), CA125 (AUC = 0.634), T stage (AUC = 0.793), N stage (AUC = 0.730), tumor size (AUC = 0.707), and preoperative weight loss (AUC = 0.587) (Fig. 3j). In the validation sets, the results were consistent with the training set. The AUC values of the multiple ROC curves in the internal validation set were the nomogram (AUC = 0.843), T stage (AUC = 0.78), tumor size (AUC = 0.702), N stage (AUC = 0.685), preoperative weight loss (AUC = 0.568), CA125 (AUC = 0.536), and pyloric obstruction (AUC = 0.51) from high to low, respectively (Fig. 3k). And those in the external validation set were nomogram (AUC = 0.748), pyloric obstruction (AUC = 0.564), CA125 (AUC = 0.541), T stage (AUC = 0.654), N stage (AUC = 0.628), tumor size (AUC = 0.603), and preoperative weight loss (AUC = 0.647) (Fig. 3l). Additionally, multiple DCA curves results indicated that the nomogram model was more reliable than the individual independent prognostic factor in both the training and validation sets (Fig. 3m and o).
Survival analysis of patients in different risk groupsWe reviewed the initial cohort’s survival differences between anemic and non-anemic patients. Patients with anemia exhibited a poorer prognosis than non-anemic patients in both the SYSU cohort (Fig. 4a) and GXMU cohort (Fig. 4b). The results are consistent with the conclusions of previous studies [7, 12]. Subsequently, the risk score of all patients in the training set was computed based on the nomogram information atlas. Using the median risk score of all patients, we separated the patients into low-risk group (risk score < = 113.3) and high-risk group (risk score > 113.3). The Kaplan-Meier curve effectively demonstrated the association between risk stratification and prognosis, with the prognosis of patients in the high-risk group being poorer than that of the low-risk group (Fig. 4c and e). Additionally, the time-ROC revealed that the model had a robust capacity in predicting prognosis, particularly in predicting long-term prognosis, with AUC values reaching 8 (Fig. 4f and h). The risk score was found to be associated with distant metastasis, and it was observed that the high-risk group had a greater probability of distant metastasis in both the SYSU and GXMU cohorts (Fig. 4i), with statistical significance in each cohort (Fig. 4j).
Fig. 4
Kaplan–Meier curve for overall survival in the Sun Yat-sen University cohort (a) and Guangxi Medical University cohort (b) between anemic and non-anemic patients. Kaplan–Meier curve for overall survival in the training set (c), internal validation set (d) and external validation set (e) between low- and high-risk patients. Time-ROC curve for 1-, 3- and 5-year prognosis in the training set (f), internal validation set (g) and external validation set (h). The proportion of metastasis patients in the Sun Yat-sen University cohort and Guangxi Medical University cohort (i). Differences in the number of patients with distant metastasis between low- and high-risk groups in different sets (j)
Relationship between clinical features and risk score of the nomogramClinical features of gastric cancer patients with anemia were also collected, including tumor differentiation, location, signet cell type, and stage. Each patient was assigned a risk score according to the nomogram, and a correlation analysis was carried out with the above clinical features. The results showed that tumor differentiation (Fig. 5a and c), location (Fig. 5d and f), signet cell type (Fig. 5g and i), and tumor stage (Fig. 5j and l) were associated with risk score in various groups, with higher risk score indicating worse differentiation types, and severer tumor staging.
Fig. 5
Boxplot of the relationship between risk score and tumor differentiation in the training set (a), internal validation set (b) and external validation set (c). Boxplot of the relationship between risk score and tumor location in the training set (d), internal validation set (e) and external validation set (f). Boxplot of the relationship between risk score and signet cell type in the training set (g), internal validation set (h) and external validation set (i). Boxplot of the relationship between risk score and tumor TNM stage in the training set (j), internal validation set (k) and external validation set (l)
留言 (0)