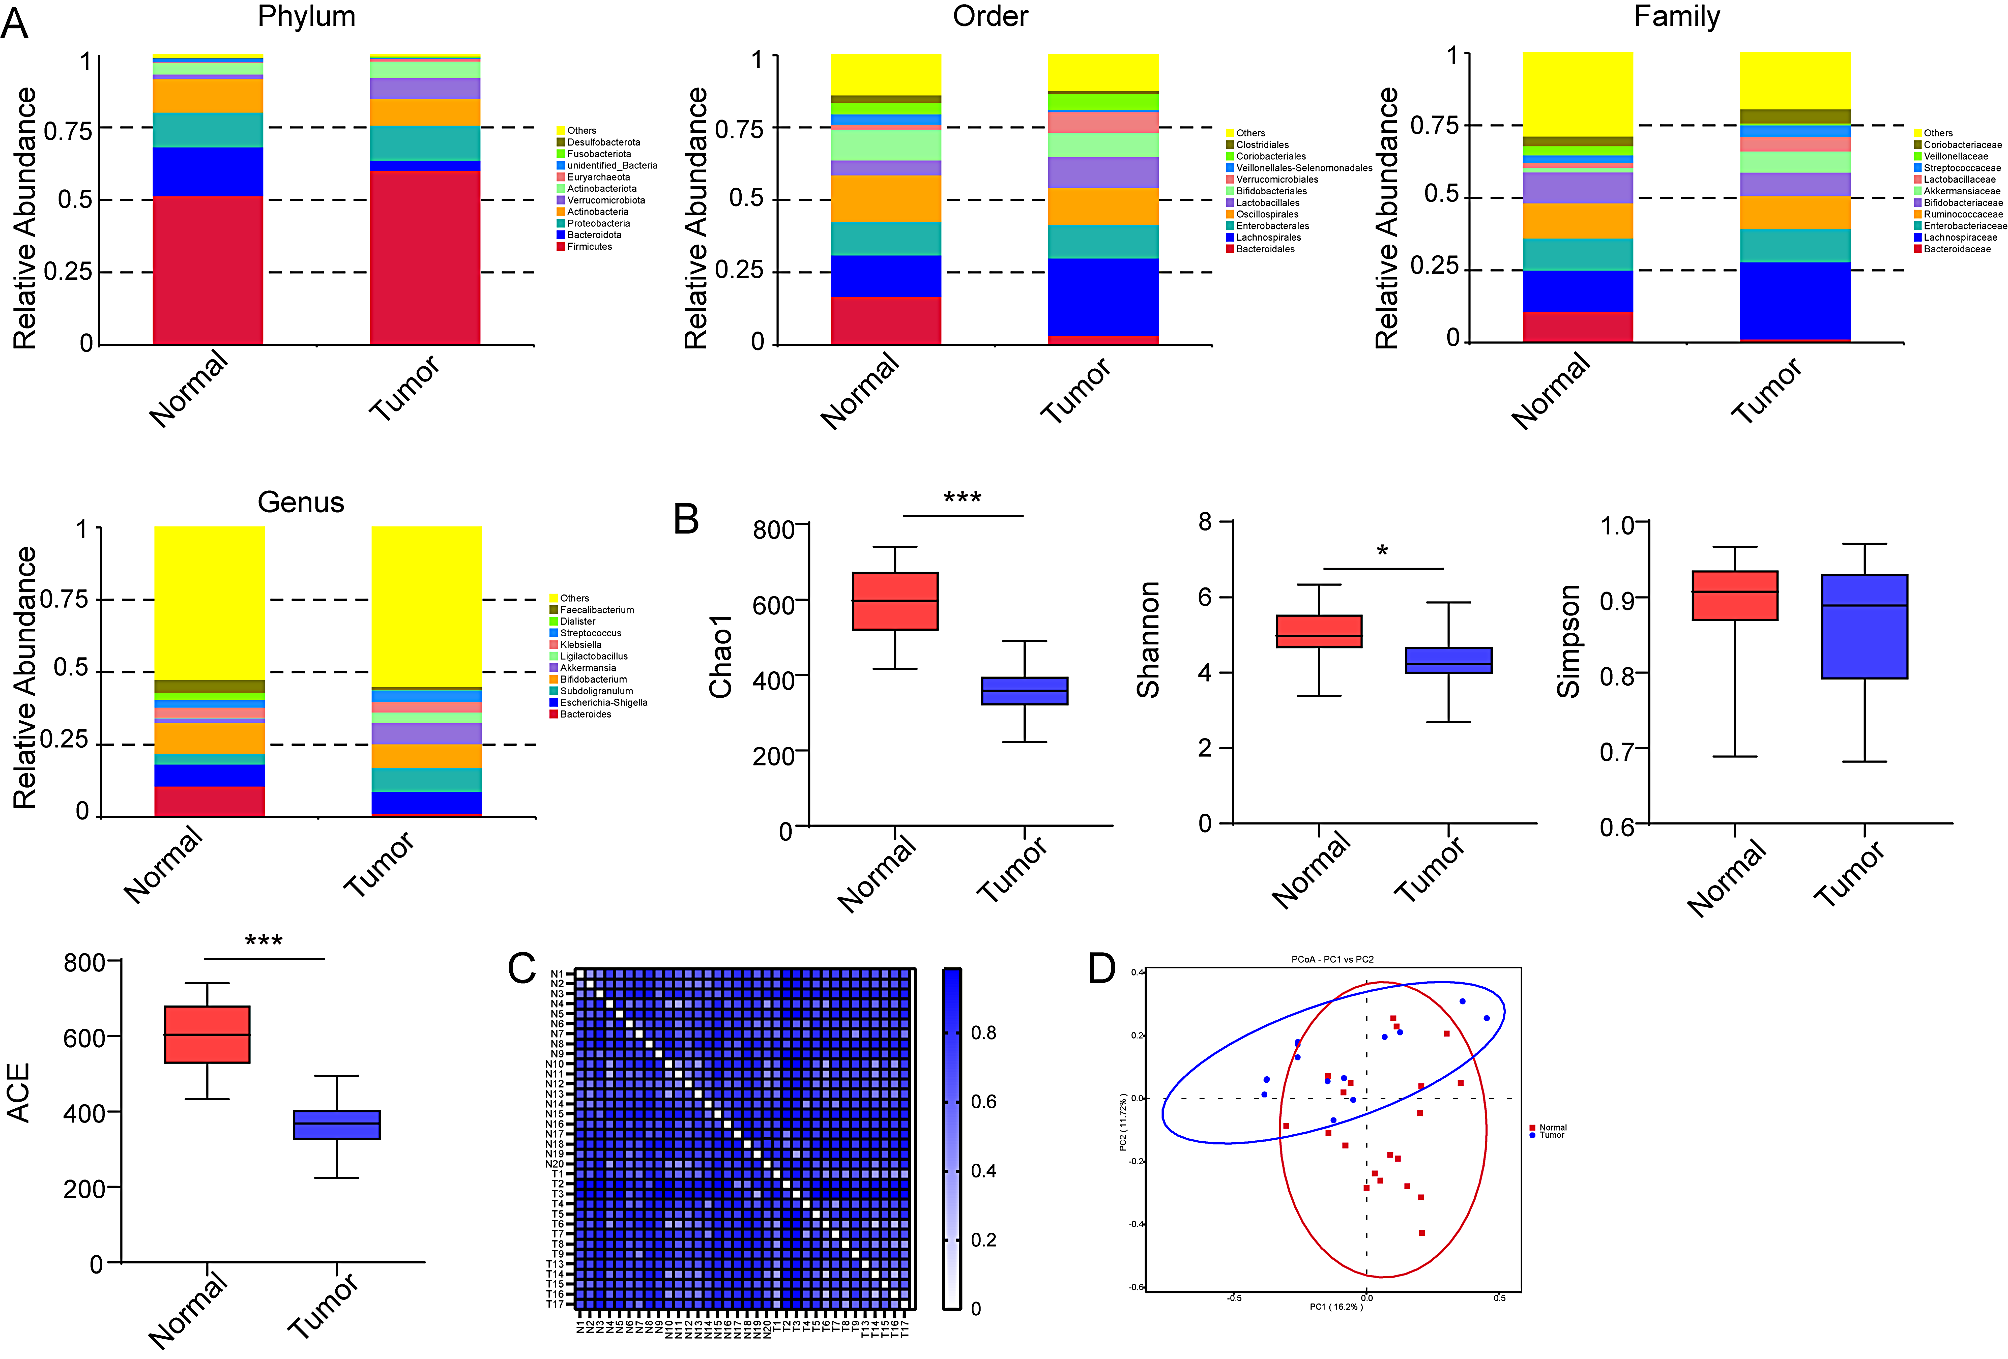
Collection and treatment of clinical tissues and feces of CRC patients
The tumor and adjacent tissue samples of 14 patients with colorectal cancer who were clinically diagnosed and underwent surgical resection in Binzhou People’s Hospital were collected. Tissue samples were stored at -80℃. 20 g fecal samples were collected from 14 CRC patients and 20 healthy volunteers, which were stored at 4℃ before analysis. All the patients and volunteers are Han people in Shandong province, with similar geographical areas and eating habits. Exclusion criteria are as follows: (1) Patients over 80 years old or under 25 years old; (2) Patients with familial colorectal cancer and inflammatory bowel disease (IBD); (3) Have a history of other malignant tumors or are receiving anti-tumor treatment; (4) Antibiotics, probiotics, prebiotics, hormones, steroids or synbiotics were used 6 months before fecal sample collection. All volunteers were between 30 and 70 years old, and the sex ratio was consistent with that of CRC patients. Volunteers had normal defecation habits and no other major diseases. The suspension of feces was homogenized by a homogenizer (FastPrep 24, MP Biomedi, USA). Then, the fecal DNA extraction kit (116,570,200, MP Biomedi, USA) was used to extract DNA from the fecal samples.
Sequencing and analysis of 16 S intestinal flora
16 S rRNA gene (319 F: 5′-ACTCCTACGGGAGGCAGCAG-3′; 806R: 5′-GGACTACHVGGGTWTCTAAT-3′) of bacteria in feces was amplified and sequenced, and the difference of gut microbiota composition was evaluated [19]. Triplicates were pooled, and the PCR amplicons were sequenced using an Illumina HiSeq platform (Illumina MiSeq, USA). The sequencing results were processed by QIIME2 platform (v2021.4). The original data were filtered by using the DADA2 plug-in, and the amplicon sequence variants (ASVs) table was constructed. Then, the VSEARCH plug-in is used to cluster ASVs, and those with more similarity than 97% belong to the same operational classification unit (OTUs). According to the 16 S rRNA reference of RDP, mothur20 was used to classify the representative sequences of each OTUs. Gut microbiota α-diversity was analyzed according to OUT information using QIIME software. β-diversity was estimated using Bray-Curtis dissimilarity and the Jaccard similarity index between samples. Bacterial diversity was expressed by observed ASVs count and Shannon index. Principal co-ordinates analysis (PCoA) and partial least square discriminant analysis (PLS-DA) were utilized to evaluate global microbiota composition (β-diversity) based on Bray-Curtis distances with statistical differences between groups calculated by analysis of similarities (ANOISM) and permutational multivariate analysis of variance (PERMANOVA).
Construction of CRC mouse model
C57BL/6 male mice (6–8 weeks old) were purchased from Hunan SJA (Hunan SJA Laboratory Animal Co., Changsha, China). According to the previous research method [20], mice were intraperitoneally injected with 10 mg/kg of azoxymethane (AOM, A5486-25MG, Sigma-Aldrich, USA) every day for seven days. Then, mice were fed with 2% (weight/volume) dextran sodium sulfate (DSS, PHL 83,846, Sigma-Aldrich) for 7 consecutive days. Subsequently, normal drinking water feeding was resumed for 14 consecutive days. This feeding cycle was repeated twice continuously until the 70th day, and the mice were killed by dislocation of the spine and their tumors were collected. A mixture containing Vancomycin, Neomycin and Ampicillin (1 mg/mL) was administered to antibiotic treatment group [21]. The antibiotic mixture was added to the drinking water at age 10 and 14 weeks. Normal drinking water replaced the antibiotic containing water after 10 days of administration. All animal experiments were approved by the Ethics Approval Centre of Medical Ethics Committee of Binzhou People’s Hospital (2020266).
Western blot
Firstly, the tumor tissue was homogenized by a homogenizer, and then the tumor tissue was lysed by RIPA lysis buffer (#20–188, Merck Millipore, USA). Protein was separated by SDS-polyacrylamide gel, and the blot was transferred to a PVDF membrane (Merck Millipore) and sealed with 5% dehydrated milk. The membrane was incubated with primary antibody at 4℃ overnight. After washing the membrane with TBS for three times, the membrane was incubated with HRP-linked secondary antibody for 1 h at room temperature. β-actin was used as internal control. Finally, the protein bands were treated by enhanced chemiluminescence kit (Millipore, USA). Primary antibodies: anti-cGAS (1:1000, PA5-121188, Thermo Fisher Scientific, China), anti-p-STING (1: 1000, PA5-105674, Thermo Fisher Scientific, China), anti-STING (1:1000, PA5-23381, Thermo Fisher Scientific, China), anti-p-TBK1 (1:1000, PA5-105919, Thermo Fisher Scientific, China), anti-TBK1 (1:5000, ab40676, Abcam, UK), anti-p-IRF3 (1:1000, PA5-38285, Thermo Fisher Scientific, China), anti-IRF3 (1:1000, ab68481, Abcam, UK) and anti-β-actin (1:1000, ab8226,Abcam, UK).
Immunohistochemistry
Mouse colon tumor tissue was fixed with formaldehyde and then embedded in paraffin, and then made into sections. Then, after dewaxing, the slices were antigen-repaired in citrate buffer (pH 6.0). The slices were sealed at room temperature in 0.3% H2O2 and normal goat serum. The primary antibody incubated the slices at 4℃ overnight. Subsequently, the target protein was stained with streptavidin-peroxidase (A9044, Sigma-Aldrich) and labeled with 3,3’-diaminobenzidine (D12384, Sigma-Aldrich). Related protein primary antibody: anti-cGAS (1:1000, PA5-121188, Thermo Fisher Scientific, China), anti-p-STING (1:1000, PA5-105674, Thermo Fisher Scientific, China), Ki67 (1:5000, ab15580, Abcam, UK).
Statistical analysis
All experimental results are expressed as mean standard deviation (SD). Graph Pad Prism 8 was used for statistical analysis. Hierarchical clustering analysis was applied on Pearson distances using PermutMatrix. Two-tailed Student’s t-test was performed and the p-value was adjusted by the Benjamini-Hochberg (BH) correction. The probability level for statistical tests was set at α = 0.05 and was adjusted by the BH correction to allow for a maximum 5% probability (q = 0.05) of false positive detection. ANOVA was used to compare differences among multiple groups, and post hoc analysis was performed by Tukey’s multiple comparisons test. P value < 0.05 indicates statistical significance.


留言 (0)