
記住我
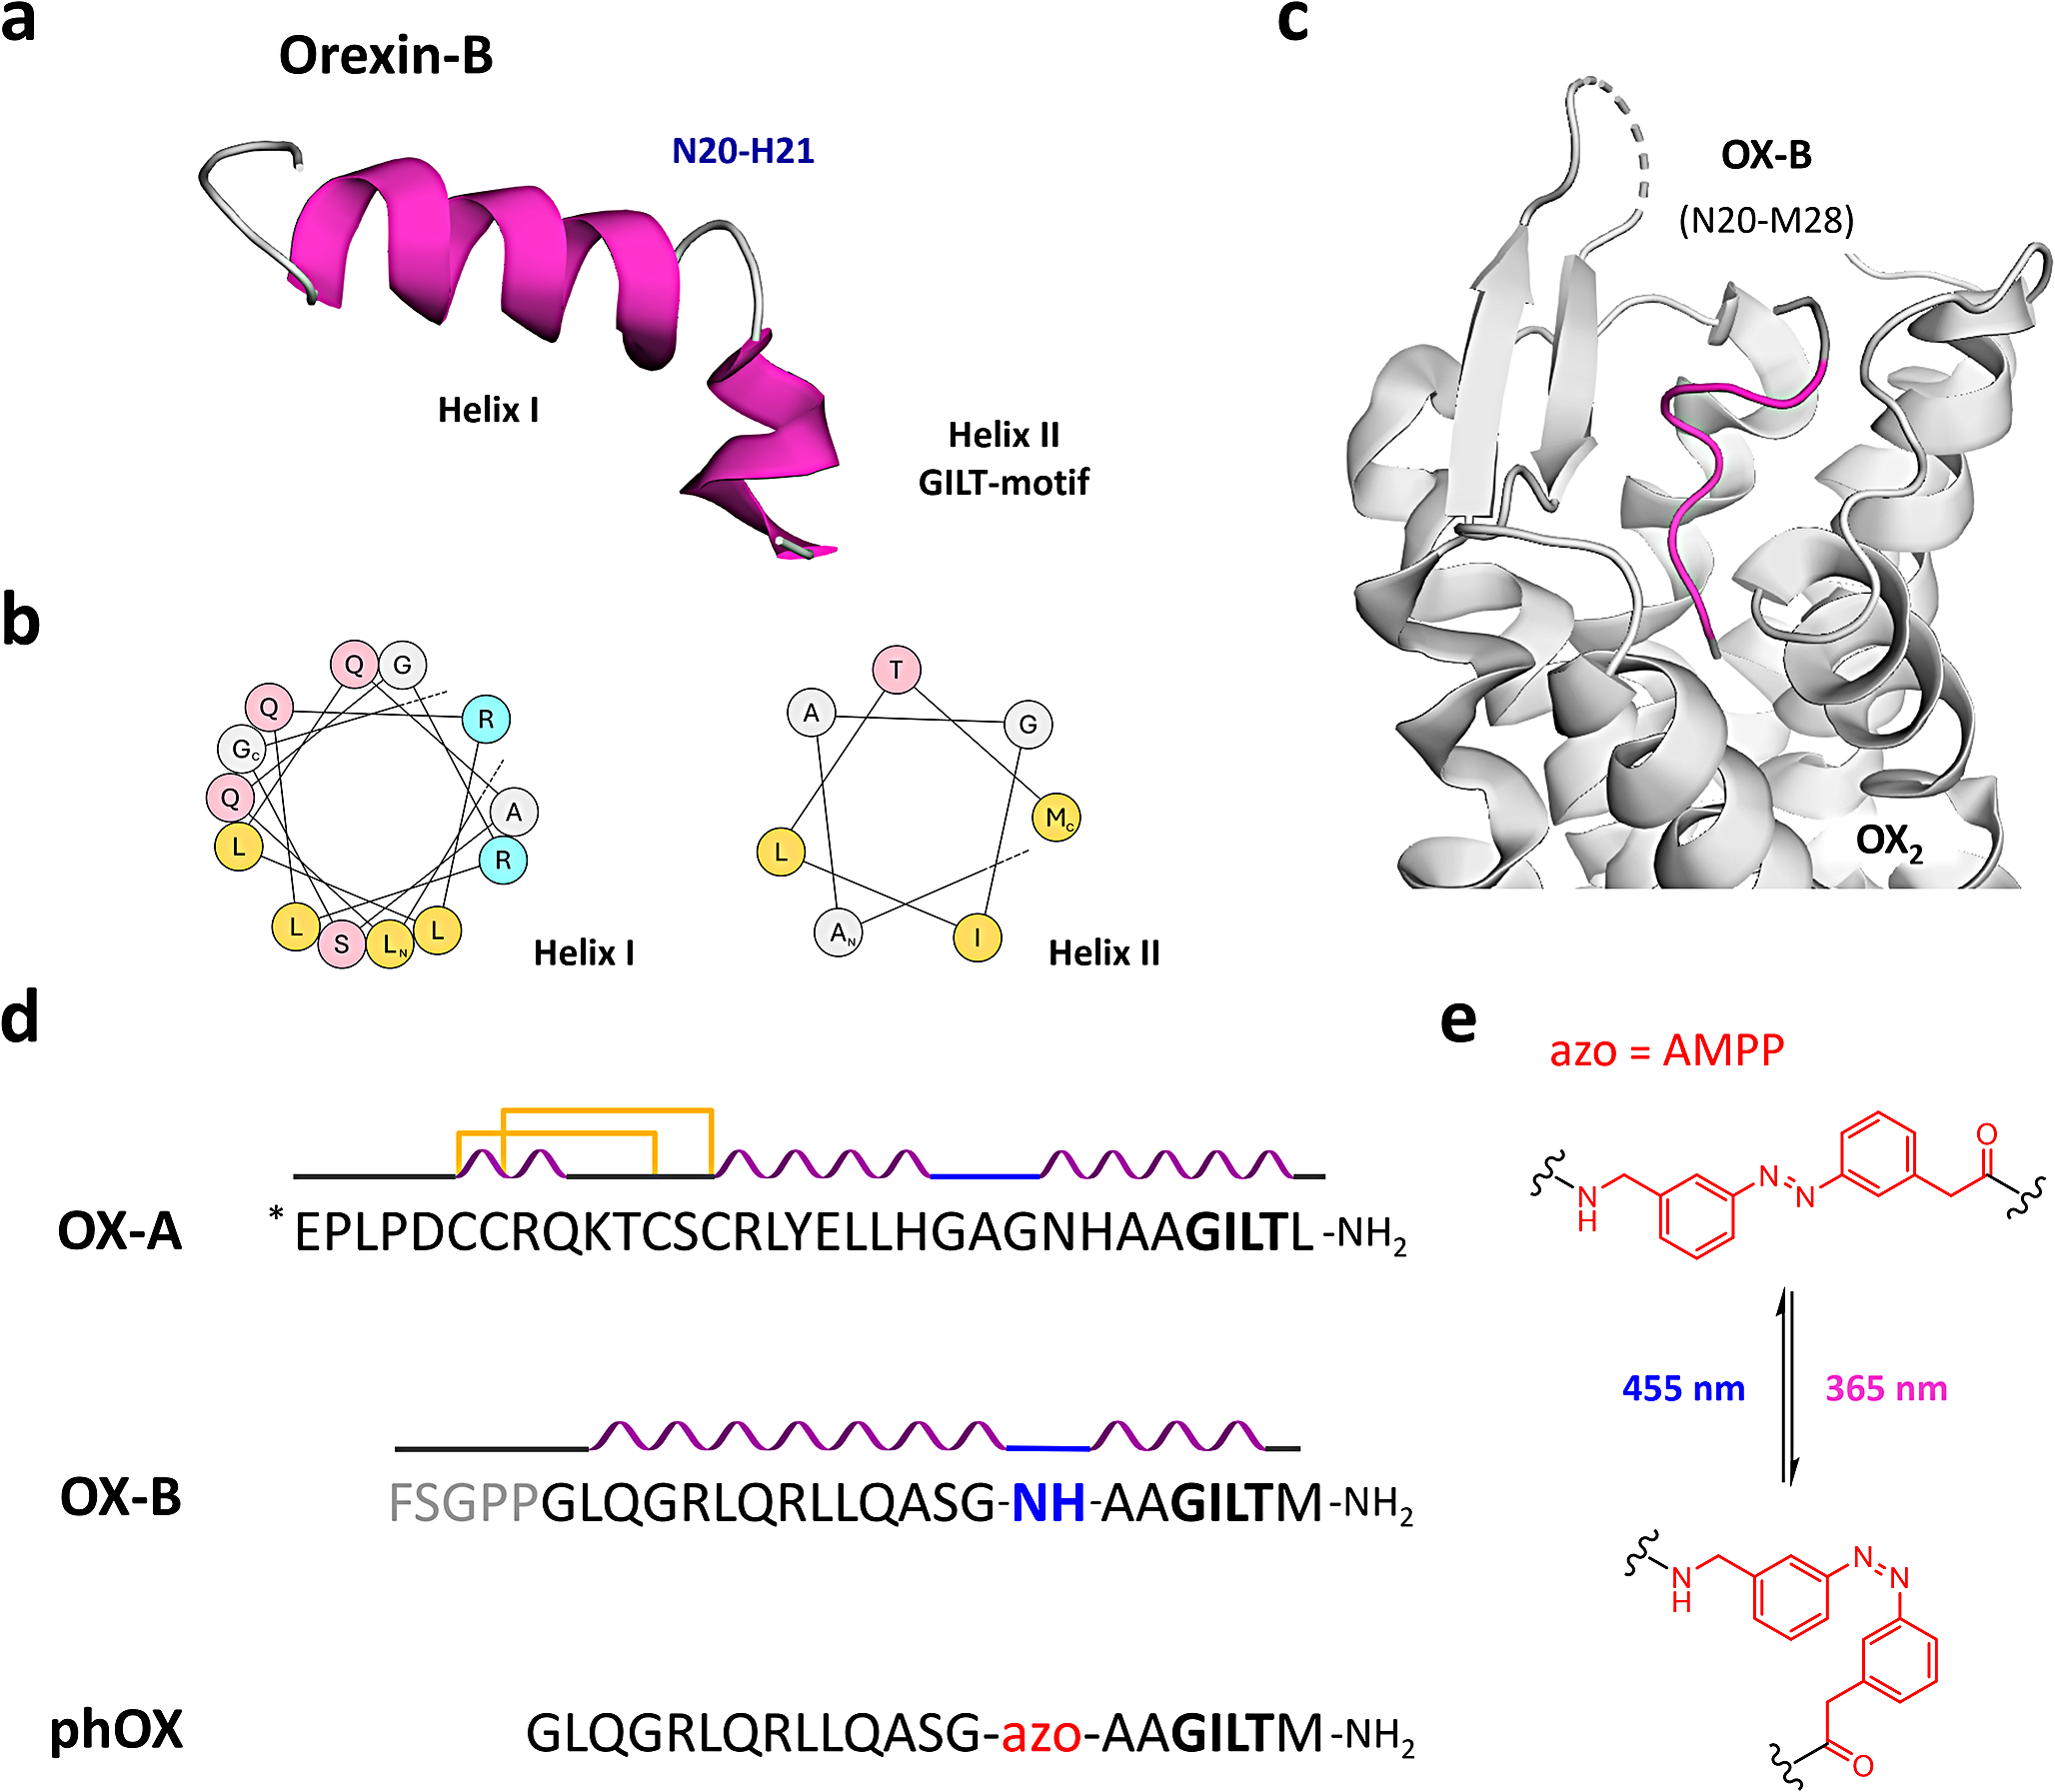


As revealed by two-dimensional nuclear magnetic resonance (2D NMR) spectroscopy, both orexin isoforms present relatively high helical content in their aqueous solution state [32,33,34]. OX-B comprises two α-helices spanning residues Leu7-Gly19 (helix I) and Ala23-Met28 (helix II), respectively. A flexible linker (residues Asn20 and His21) connects them orienting their axis about 60–80° relative to one another (PDB ID:1CQ0) (Fig. 1a-b) [32]. OX-A shows similar structural features to OX-B, however, its N-terminus contains a third helix located between residues Cys6-Gln9 (helix III) and conformationally restrained by two disulfide bridges (PDB ID:1WSO) (Fig. 1d) [34].
So far, stapling with a photoswitchable crosslinker has enabled light-regulation over the secondary structure of helical peptides to control a diversity of cellular processes [35,36,37,38,39,40]. However, this methodology, which relies on the formation of a bisthioether between a photoswitch and two strategically site-mutated Cys residues, is complicated by the presence of disulfide bonds in the peptide sequence [41]. Unfortunately, previous studies show that removing OX-A disulfide bonds by reduction or by isosteric replacement of the Cys residues can lead to a nearly 10-fold loss in agonist activity towards both orexin receptors [42,43,44]. In addition, shortening the OX-A N-terminus also causes a reduction in peptide activity [44, 45]. Thus, based on these considerations, in our proof of concept demonstration we decided to focus on OX-B structure to minimize the structural and synthetic complexity, and the impact of chemical modifications on biological activity.
Recently, Hong et al. determined the activated-state structure of OX2 by cryogenic-electron microscopy (cryo-EM) and demonstrated that OX-B C-terminus (helix II in the aqueous solution structure) is anchored deep into the receptor binding pocket [46]. In contrast, residues corresponding to the flexible linker (Asn20-His21) are exposed towards the receptor extracellular surface (Fig. 1c). The cryo-EM density map also shows a less-defined density feature, whose shape and location suggest that the N-terminus of the peptide interacts via an α-helical structure with the extra-cellular loop (ECL) 2 and N-terminus of OX2. The formation of a similar hydrophobic interface has been described between OX-A and both orexin receptors and its involvement in receptor activation is supported by mutagenesis studies and molecular dynamics (MD) simulations [47, 48]. Surprisingly, Hong and coworkers also found that OX-B C-terminal segment binds to the receptor in an extended conformation rather than adopting a helical structure (Fig. 1c) [46]. Considering both the technical hurdles and the limited impact of photoregulating orexin helicity [49], we reasoned that replacing the flexible hinge of OX-B with a photoswitchable amino acid might allow to reversibly disrupt the overall geometry of the ligand.
Fig. 1
Rational design of photorexin (phOX) (a) NMR-derived aqueous solution structure of the orexin-B peptide (PDB: 1CQ0). A flexible linker (N20 and H21) is located between Helix I (L7-G19) and the biologically active GILT-motif in Helix II (A23-M28). (b) Helical wheel projections of OX-B Helix I (L7-G19, left) and Helix II (A23-M28, right). Aliphatic residues are represented in yellow, polar residues are in pink, positively charged residues are in cyan, and small residues are in grey. The N- and C-termini of each helix are indicated with N or C, respectively. (c) Structure of OX-B (residues N20-M28) bound to OX2 in an extended conformation as determined by single-particle cryo-electron microscopy (PDB: 7L1U). The peptide C-terminus is anchored deep into the receptor binding pocket with flexible residues N20-H21 exposed to the extracellular surface. OX-B GILT-motif is represented in purple, whereas other residues are in grey. (d) Comparison of the amino acid sequences and secondary structures of orexin-A (OX-A), orexin-B (OX-B), and photorexin (phOX). In the latter, the unstructured N-terminus (in grey in OX-B) was removed, while the flexible linker (N20 and H21, in blue in OX-B) was replaced with a photoswitchable amino acid (azo, in red in phOX). *E represents pyroglutamic acid, C-termini are amidated and indicated as -NH2 at the end of the sequences. In the scheme, α-helices are pictured in purple, turns are shown in blue, and intramolecular disulfide bridges as yellow lines. (e) Trans and cis structures of the photoswitchable ω-amino acid [3-(3-aminomethyl)phenylazo]phenylacetic acid (AMPP, in red)
Consequently, we designed a photoswitchable analogue of orexin-B as follows: (i) Asn20 and His21 were replaced by an ω-amino acid containing an azobenzene moiety; (ii) the linear sequence of the peptide was reduced to the minimum required for receptor activation (OX-B6-28) by removing the N-terminus; and (iii) the C-terminal amidation was maintained as beneficial for both peptide activity and stability (Fig. 1d). As molecular switch, we chose [3-(3-aminomethyl)phenylazo]phenylacetic acid (AMPP) (Fig. 1e). This choice took into account the excellent photochromic properties of azobenzene, the possibility of obtaining great alterations in geometry upon photoisomerization, and several successful reports where the switch component had been inserted into β-turns and within α-helices to photoregulate the orientation of the associated secondary structures [28, 50,51,52,53]. In addition, the two methylene bridges adjacent to the azobenzene core could guarantee enough flexibility to the system [54].
Fmoc-protected AMPP was synthesized as reported in the literature and incorporated into the backbone of photorexin combining automated and manual solid-phase peptide synthesis (SPPS) with a standard Fmoc-based strategy [28]. Insertion of the azo-amino acid was confirmed by UV-Vis spectroscopy (Fig. S2.1). Furthermore, taking advantage of the thermal bistability reported for this azobenzene [52], the photochromism of photorexin could be characterized by UPLC analysis. Thus, the percentages of the two isomers were quantified while testing a variety of illumination conditions. In particular, we studied switching kinetics and photostationary states using a UVGI torch light at our disposal as well as 365 and 380 nm UV light for the trans→cis photoisomerization (Fig. 2a); and 455 and 500 nm visible light (blue and green, respectively) for the reverse process (cis→trans) (Fig. 2b).
Trans photorexin could be readily converted to the cis isomer by illuminating between 311 and 365 nm, whereas the extent of photoisomerization was lower at longer wavelengths (e.g. 380 nm). From an initial photostationary state of 13% cis and 87% trans under benchtop conditions, an excellent 20:80 (trans:cis) ratio was achieved after 2 min of illumination at 365 nm (Fig. 2a). In contrast, exposure to blue light for 3 min back-isomerized the compound and reverted the ratio to 74:26 (trans:cis). Similar values could also be reached by illuminating with green light for a longer time (~ 5 min) (Fig. 2b).
We then tested the photochromic stability of our peptide. Photorexin could be readily toggled between 87% cis and 74% trans with alternating cycles of UV and blue light of 3 min each. The process was repeated several times without significant degradation or bleaching (Fig. 2c and Fig. S2.2). Finally, the thermal relaxation of the cis isomer (t1/2 ̴ 38 h at 37 °C) was determined as displayed in Fig. 2d.
It must be noted that although UV wavelengths required to photoswitch our peptide do not penetrate deep into tissue, symmetric azobenzenes like AMPP can also be isomerized with mid-infrared light using three-photon excitation. Multiphoton (two- and three-photon) excitation offers deep penetration and three-dimensional focusing at the microscale [55].
Fig. 2
Photorexin photochromic characterization. (a-b) Isomeric distribution of a phOX sample (50 µM in PBS at pH 7.4 and 25 °C) when photoswitching from trans to cis (a) or from cis to trans (b) after cumulative illumination at different wavelengths. Percentages of the two species were quantitatively determined by UPLC analysis upon resolving the peaks of the two isomers at given illumination times. Data were fitted to a monoexponential decay model. (c) Reversibility and stability of the photochromic behavior of phOX (25 µM in PBS at pH 7.4 and 25 °C) over several cycles (3 min each) of photoinduced isomerization at 365 nm (trans→cis) and 455 nm (cis→trans). Percentages of the two isomers were determined by UPLC analysis after each cycle. (d) Thermal relaxation of phOX at 37 °C in PBS (pH 7.4) as monitored by UV-Vis spectroscopy at 325 nm. Data were fitted to a monoexponential decay model for cis half-life determination (t1/2 = 38 h)
Photorexin pharmacodynamics were then examined to understand: (i) how replacement of the flexible hinge with the photoswitchable AMPP amino acid affected both potency and maximal efficacy of the peptide; and (ii) to which extent these properties could be photoregulated. Given the convenient bistability of the two isomers, pre-illuminated samples were tested using an in vitro functional assay that monitors real-time intracellular calcium responses through a Fluorometric Imaging Plate Reader (FLIPR Tetra®).
The activity was evaluated either in CHO-K1 cells stably transfected with the human OX1 receptor or in PFSK-1 cells. The latter is a human neuroectodermal cell line, derived from a brain tumor, that innately expresses the hOX2 receptor [56]. Both orexin-B and our photoswitchable analogue increased calcium release in a concentration-dependent manner, unambiguously indicating agonist activity (Fig. S3.2). The potency of the native peptide was consistent with the reported values [12, 44]. Promisingly, photorexin displayed almost the same efficacy as OX-B and high nanomolar potency towards both receptor subtypes. The EC50 of dark-adapted photorexin (trans-enriched) at hOX2 was only 4-fold shifted to the right compared to the dose-response curve of the endogenous peptide. This reduction in potency was slightly higher at hOX1, where trans-enriched photorexin displayed a 9-fold decrease in activity (Table S3.1).
Despite modest light-induced changes, dark-adapted photorexin consistently exhibited statistically significant higher potency compared to the cis-enriched peptide (1.4-fold and 2.0-fold at OX1 and OX2, respectively). As the calcium-sensitive dye used in the assay requires 470–495 nm excitation, blue light was likely to back-isomerize pre-illuminated photorexin (cis-enriched) to mainly trans, thereby reducing any difference in activity between the two samples. To overcome this limitation, we decided to assess intracellular calcium responses in a different system.
Calcium fluorescence imaging also allows the quantification of real-time changes in cytosolic calcium concentration but with single-cell or subcellular resolution. These experiments were performed in a line of transformed human kidney cells - tsA201 - expressing either OX1 or OX2 along with R-GECO1, a genetically encoded calcium indicator sensitive to green light excitation (λex = 562 nm). In addition to overcoming the aforementioned limitations of blue light excitation, R-GECO1 red-shifted absorption spectrum offered the possibility of photoisomerizing the peptide in situ, which proved advantageous compared to testing only pre-irradiated samples.
Photorexin was first applied as a control to tsA201 cells transfected only with the calcium indicator. The absence of response to the compound and concomitant UV or blue illumination ruled out light-induced artifacts due to non-specific R-GECO1 stimulation (Fig. S3.3). Subsequently, 100 nM photorexin was applied to cells co-transfected with R-GECO1 and GFP-labelled hOX2. The peptide evoked a sharp transient response in the dark, displaying oscillations with a period of 1–3 min depending on each cell. Illumination with UV light terminated these responses in a few seconds, and oscillatory activity was resumed upon exposure to blue light (Fig. 3a-b). Similar patterns of calcium signals could be reproduced in at least two cycles of alternating UV and visible light as well as at lower doses (30 nM, Fig. S3.4), thus demonstrating that photorexin can robustly and reversibly regulate the activity of orexin receptors with light and that it behaves as a trans-active agonist with nanomolar potency. The dynamic photocontrol of orexin receptor activity enabled by photorexin is in contrast to the irreversible photorelease of caged OX-B demonstrated in vitro [27]. In hOX1-expressing cells, the dark-adapted peptide also produced an increase in calcium influx, although smaller in magnitude than in tsA201-hOX2. UV- and blue-light illumination (365 and 455 nm, respectively) elicited no effect (Fig. 3c and Fig. S3.5).
Calcium traces from different cells were then integrated to quantify the observed responses. Noticeably, UV-illuminated photorexin (cis-enriched) retained only 6% of the dark-adapted peptide activity towards hOX2. While illumination with blue light rapidly restored calcium mobilization, recovery was partial (52% of the initial responses) probably owing to receptor desensitization after prolonged agonist exposure (Fig. 3d). In the dose-response curves, dark-adapted photorexin displayed significantly lower potency towards hOX1. In contrast, both the UV- and blue-light illuminated forms evoked no response on this receptor, thus demonstrating selectivity towards hOX2 (Fig. S3.5 and Fig. 3e). In light of the promising results obtained through calcium fluorescence, we moved on to test photorexin activity in vivo.
Fig. 3
Photorexin pharmacodynamics (a) Representative single-cell calcium traces (n = 12) in tsA201 cells transiently expressing GFP-hOX2 and R-GECO1. Upon application of 100 nM photorexin (green bar) in its dark-adapted state (trans, white area) cells gave sharp responses. Calcium oscillations were then abolished upon exposure to cycles of UV light (365 nm, cis-enriched state in pink) and recovered with blue illumination (455 nm, trans-enriched state in blue). (b) Real-time intracellular calcium recordings (averaged traces, black line, n = 20) from tsA201 cells co-expressing hOX2 and R-GECO1 upon application of 100 nM photorexin (green bar). Traces were recorded in the dark (white area) and under cycles of illumination with UV (365 nm, pink) and blue (455 nm, blue) light. Grey area represents ± SEM. (c) Real-time calcium imaging responses (averaged traces, black line, n = 20 cells) from tsA201 cells co-expressing hOX1 and R-GECO1. Application of photorexin (100 nM, green bar) evokes mild responses in the dark and under blue light. Grey area represent ± SEM. (d) Efficacy of phOX (100 nM) on tsA201-hOX2 quantified in the dark (green bar) and after subsequent illumination with 365 nm UV light (pink bar, cis enriched) and back-isomerization to trans with 455 nm blue light (blue bar). Responses were quantified as Area Under the Curve (AUC) and normalized to those obtained with dark-adapted phOX. Data represent means ± SEM (n = 20 cells). Statistical differences were determined by one-way ANOVA with Tukey’s multiple comparison test (***, p-value ≤ 0.001; ****, p-value ≤ 0.0001). (e) Selectivity of phOX (100 nM) over tsA201-hOX2 (full-colored bars) and tsA201-hOX1 (dashed bars) compared after illumination with 365 nm UV light (cis enriched, in pink) and after back-isomerization to trans with 455 nm blue light (in blue). Data represent amplitude means ± SEM (n = 20 cells). Statistical differences were determined by one-way ANOVA with paired-sample Wilcoxon signed-rank test (ns, not significant; ****, p-value ≤ 0.0001)
The orexin neural network in zebrafish has been studied in detail and, as in mammals, it is involved in many physiological functions including sleep/wake cycles, homeostasis, feeding, and locomotor activity [57,58,59,60,61,62]. Between 16 and 60 neurons compose the zebrafish’s network with a similar gene to mammals encoding for two orexins neuropeptides (OX-A/-B) [61]. Only one orexin receptor has been found in zebrafish, closely related to mammalian OX2 (70%). Its binding pocket is highly conserved throughout species [15, 61]. The simplicity of the network in zebrafish and its close resemblance to higher mammals, along with the advantages of using an established neuropharmacological [63,64,65,66] and photopharmacological [7, 67] animal model, allowed us to investigate the effects of photorexin on locomotor activities of wildtype larvae.
Individual larvae were placed in separate wells of a 96-well plate, each containing increasing concentrations of photorexin. Each individual was tracked and monitored over 68 min under different illumination conditions, alternating between 365 nm, 455 nm, and dark periods (respectively indicated by pink, blue, and no background in Fig. 4a). The time courses of 12 larvae per concentration group integrated every minute are shown in Fig. 4a. All applied concentrations are shown in Fig. 4b (0–10 µM).
High doses of photorexin (1 and 10 µM) significantly enhanced locomotion (distance swum over 1-min integration intervals) under 365 nm light compared to non-treated larvae, for all UV-illuminated periods (three 1-min bouts at 20, 22, 24 min; three 2-min bouts at 26, 30, 34, and one 4-min bout at 38 min). This increase in activity was sharply reverted under visible blue light and all treated larvae swam distances similar to non-treated individuals (three 1-min bouts at 21, 23, 25 min; three 2-min bouts at 28, 32, 36, and one 4-min bout at 42 min). Interestingly, the successive induction reflex (i.e., the fast increase and slow decrease in locomotion observed upon switching off visible light) [68, 69] is significantly reduced for all photorexin-treated groups in comparison to controls as observed at t = 49 min (Fig. 4a). These preliminary findings are consistent with sleep behaviors in zebrafish after exposure to orexin agonists, which elicit lower responsiveness upon light-to-dark changes [60]. Several photoswitchable small molecules with µM-mM potencies [70,71,72,73] and photoswitchable peptides with 1-100 µM potencies [74] are active in zebrafish by simple addition in water. Therefore, it is not surprising that photorexin, which displays low-nM potencies in vitro, readily enables photocontrol of behavior at sub-µM concentrations (500 nM, Fig. 4b) in vivo. Photoswitchable small molecules targeting the CNS are absorbed by the skin, gills, and pumping system, and produce behavioral effects in about 20 min [70,71,72,73]. While OX-A has been shown to penetrate the blood-brain barrier by simple diffusion after intravenous administration or blood-free perfusion in mammals [75,76,77], OX-B is not as lipophilic and is readily metabolized [75]. Shortening a peptide sequence and replacing polar residues with a hydrophobic moiety could generally benefit permeability, however, the chemical modifications introduced into the structure of photorexin are unlikely to alter significantly the overall physicochemical properties of the molecule compared to the parent compound. Thus, the effects observed in zebrafish might originate from intranasal delivery to the CNS [78,79,80] and/or result from the activation of peripheral orexin receptors expressed in the gastrointestinal tract [81,82,83,84].
It must be noted that rodents have been the model of choice for developing hypnotics and psychostimulants despite their different sleep patterns from humans. As an alternative, zebrafish larvae show peak daytime activity and rest at night, are cost-effective, and are amenable to high-throughput screening as shown in Fig. 4. Thus, photorexin is an in vivo neuroactive photoswitchable peptide that holds high relevance to study physiology and to develop future phototherapies.
Fig. 4
Photorexin in vivo activity in wildtype zebrafish (a) Fast-swimming distances (faster than 6 mm·s− 1) are plotted for larvae treated with different doses of phOX (vehicle – black, 10 nM – yellow, 100 nM – green, 1 µM – blue, and 10 µM – red traces). Distances were integrated over 1-min intervals. UV illumination periods increased the swimming activity of larvae exposed to high phOX doses (1 and 10 µM), while blue light reversed activity to levels of non-treated larvae. This different behavior was maintained over several light cycles. After the last illumination interval (5 min at 455 nm), all treated larvae showed a weaker induction response (i.e., the fast increase and slow decrease in locomotion observed upon switching off visible light). Patterned areas represent ± SEM (n = 12 larvae per condition). (b) Dose-response curves (distance swum in mm) in zebrafish larvae of cis (365 nm, in purple) and trans (455 nm, in blue) phOX upon integrating the 3 consecutive 1-min illumination intervals between minutes 20 and 26 for each wavelength (365 nm and 455 nm, purple and blue traces respectively). Data at 0 nM corresponds to the vehicle under both illumination conditions. Error bars represent ± SD (n = 12 larvae per treatment group). Solid traces are fitted to a log(agonist) vs. response model. Statistical differences were determined by two-way ANOVA with Tukey’s multiple comparison test (**, p-value ≤ 0.01; ***, p-value ≤ 0.001)
Overall, both in vitro and in vivo results validate the rationale behind our photoswitchable peptide ligand design. While interventions at the flexible hinge are compatible with preserving the functional activity of the peptide, peptide ligands require proper orientation of the axis to ensure receptor agonism and intracellular signaling. This achievement offers the ability to control endogenous orexin receptors remotely and in the different regions of the brain that receive orexinergic projections, and allows reversible and repeatable activation of orexin receptors at high temporal resolution to investigate gating mechanisms. To examine this question, we further studied photorexin structures associated with the observed differences in receptor activity.
In order to correlate the functional potencies of the trans and cis isomers with their respective conformations, we performed circular dichroism (CD) studies and molecular dynamics calculations. Photorexin CD spectra in phosphate buffer saline displayed a strong positive band at 195 nm and a negative one at 218 nm (Fig. S4.1A). This behavior suggests the presence of a β-strand conformation. The measurements were then repeated in the presence of trifluoroethanol (TFE), a cosolvent that creates a more hydrophobic environment and promotes helicogenic intramolecular interactions. Similarly to what had been reported for the native OX-B, the addition of 30% TFE enhanced the peptide helicity (40%) as indicated by a negative band at 207 nm and a shoulder at 220 nm (Fig. S4.1B) [32, 43]. These results confirmed that the replacement of the flexible linker with a photoswitchable moiety did not prevent the peptide from adopting a helical conformation. Interestingly, while in 30% TFE photorexin helicity was not affected by light-induced photoisomerization of AMPP, the CD spectrum recorded in PBS displayed a loss in secondary structure after exposure to UV light. Despite the variation being mild, we investigated if the detected structural changes were restricted to photorexin helix I or helix II and could partially account for the loss of potency of the cis isomer.
We thus performed replica exchange with solute tempering (REST) molecular dynamics simulations in explicit water to analyze the secondary structures of trans and cis photorexin and to relate them to their closest non-photoswitchable analogue (truncated OX-B, residues 6–28, with no amino acid replacement at the flexible hinge). Atom coordinates were extracted from the solution structure reported by Lee et al. (PDB ID: 1CQ0) [32] and we manually modified them to truncate the N-terminus and, in the case of our analogues, insert those of NMR-solved trans and cis AMPP (PDB ID: 2H4B) [85]. As an indicator of helicity, the average number of backbone H-bonds formed during the simulations was plotted for helix I (Gly6-Gly19) and helix II (Ala23-Met28) and compared between the three analogues (Fig. S4.2). Additionally, dihedral angles of residues at helix I and helix II were analyzed for the 300 K trajectory as a complementary indication of secondary structure (Fig. S4.3A-B). Surprisingly, no significant variations in helicity content and/or in the conformational preferences of the residues were observed among the three analogues. Thus, the difference in activity observed between trans and cis photorexin cannot be directly attributed to partial losses in secondary structure.
As photoisomerization was expected to affect the spatial arrangement of the two helices, we moved on to study the
留言 (0)