Cell culture
Y79 cells were cultured in RPMI 1640 medium supplemented with 15% fetal bovine serum. Human embryonic stem cell line H9 (kindly provided by Professor Qinghuai Liu, Nanjing Medical University) was cultured in Essential 8 (E8) medium (Invitrogen) on Vitronectin (VTN-N)-coated plates. Mesenchymal progenitor cells (MPCs) were derived from the human embryonic stem cell line H9 (hESC H9) using the STEMdiff™ Mesenchymal Progenitor Kit (Stemcell, 05240) both of cell lines were incubated at 37 °C with 5% CO2.
Three-dimensional (3D) retinal organoid differentiation from hESCs
The differentiation of human 3D retinal organoids was based on the differentiation protocol reported by the research of Sasai and David Gamm and further optimized [17, 18].
Retinal organoids were derived from the human embryonic stem cells (hESCs). Initially, hESCs were maintained on Vitronectin (VTN-N) matrix with E8 medium. When the confluence of hESCs reached 70%, Dispase (2 mg/mL) was used to dissociate to harvest embryoid bodies (EBs). And within the next four days, the culture medium was gradually transitioned from E8 medium to neural induction medium (NIM: DMEM/F12, [1:1], 1% N2 supplement, 1% MEM non-essential amino acids, and 2 mg/mL heparin sulfate). On the sixth day, 50 ng/mL BMP4 recombinant protein was introduced to the NIM medium. Subsequently, on the seventh day, NIM medium supplemented with 10% FBS was employed to facilitate the adherent growth of EBs. After 24 h, the medium was refreshed and subsequently half-replaced regularly. On the sixteenth day, EBs were lifted to obtain retinal organoids and retinal differentiation medium (RDM: DMEM/F12[3:1], 2% B27 supplement, 1% MEM non-essential amino acids, 1% penicillin-streptomycin) was employed for further culture. Starting from day 30, the RDM medium was enriched with 10% FBS, 100 μM taurine, 2 mM GlutaMAX, and 0.5 μM retinoic acid (abbreviated as RDM+3) for the long-term culture of retinal organoids.
Lentiviral transfection
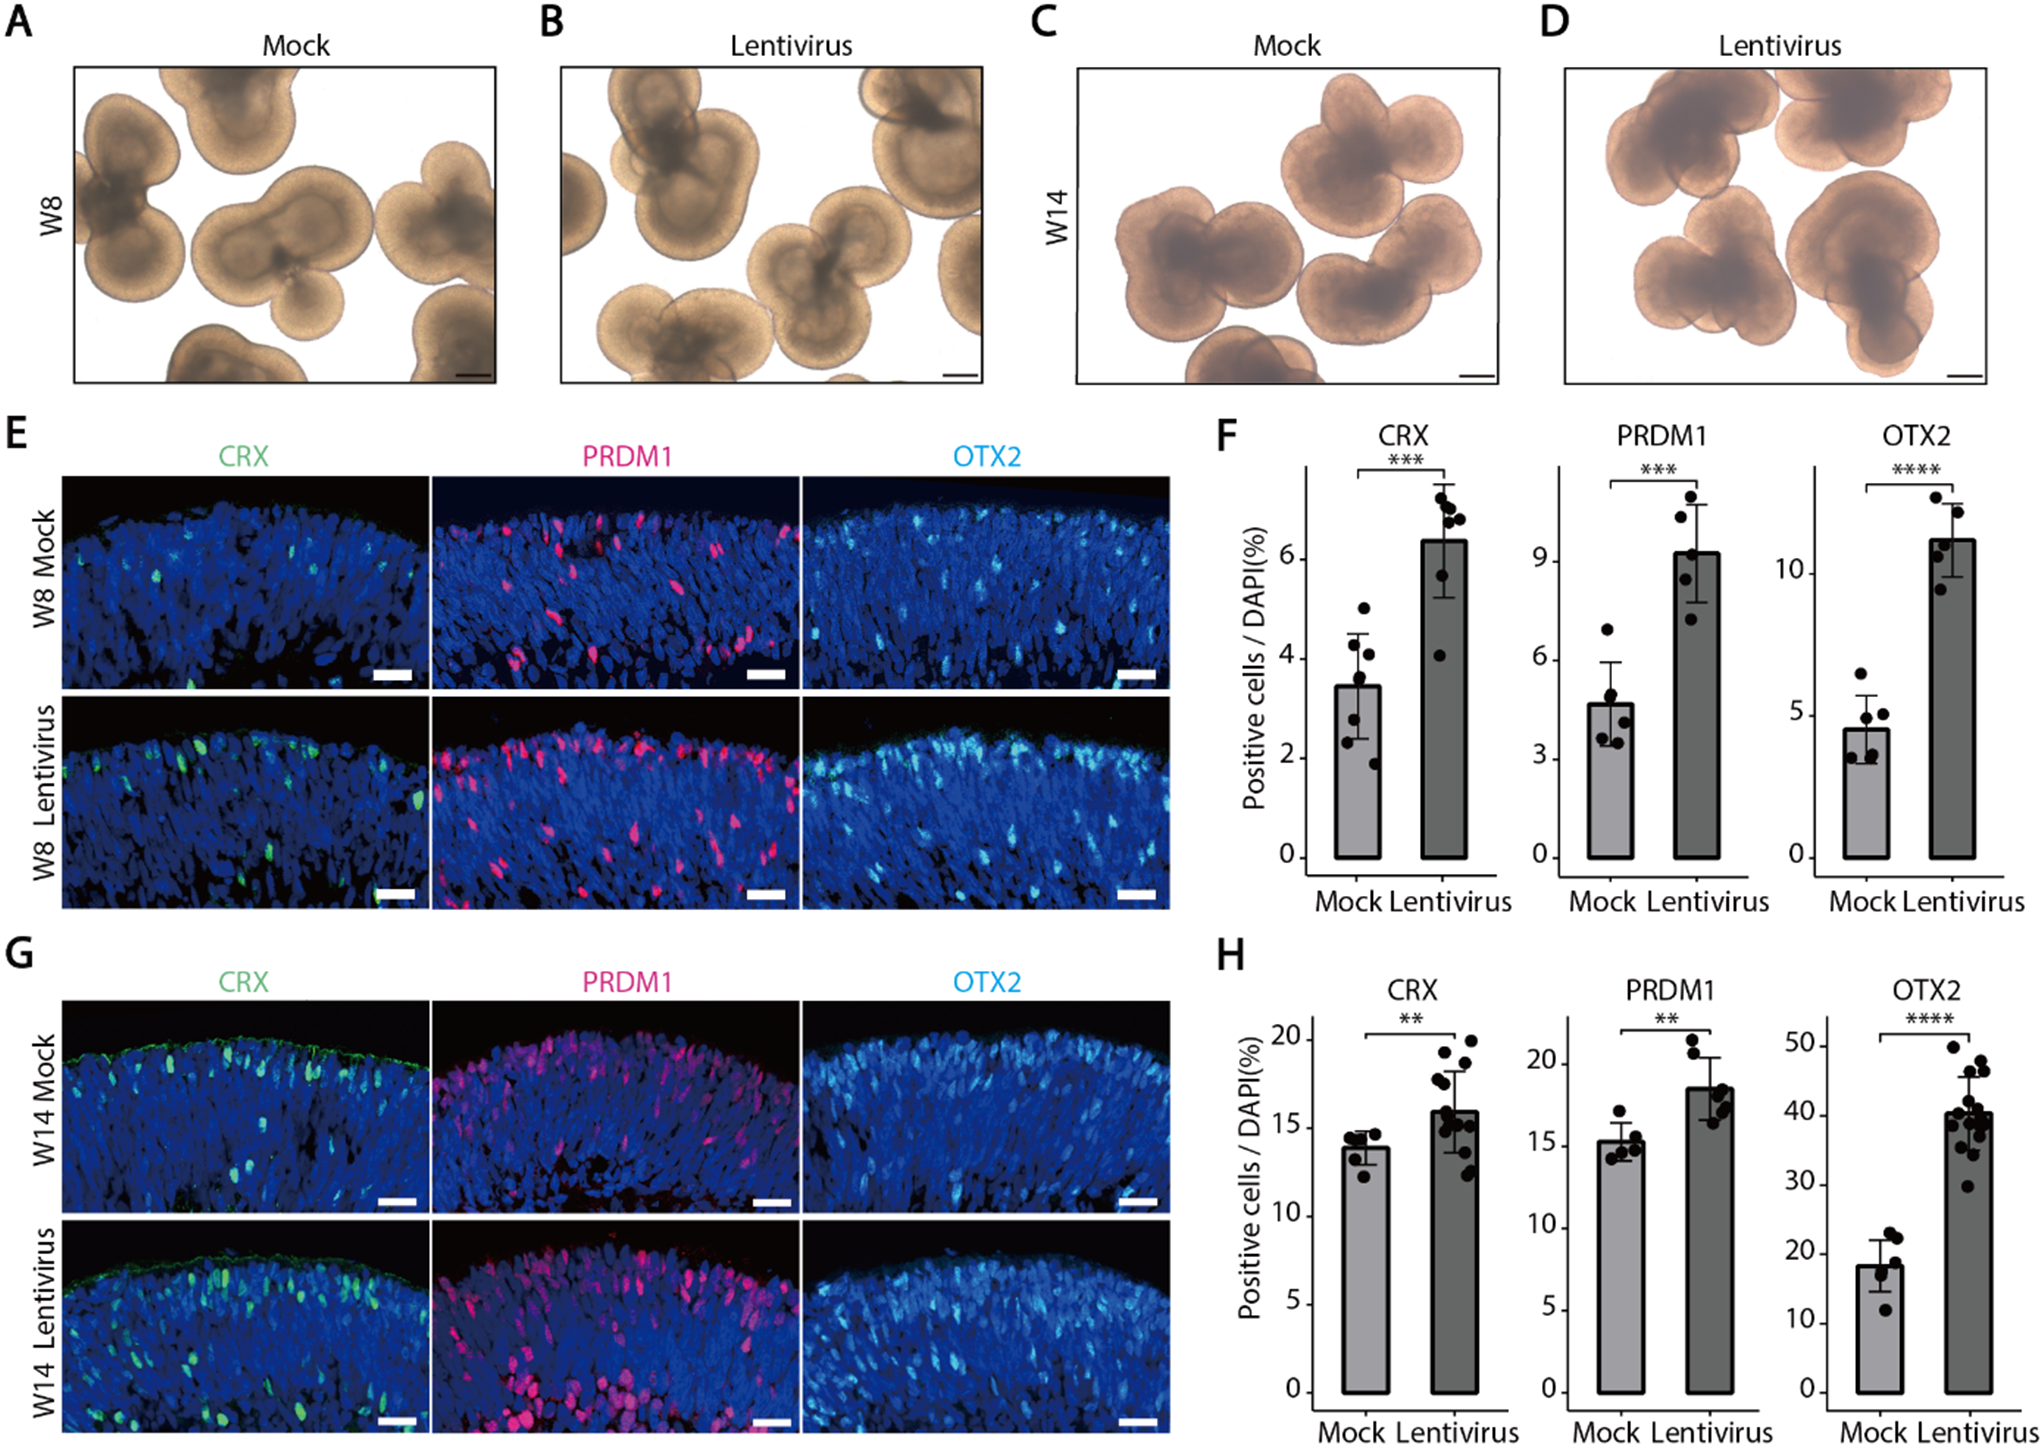
We employed two kinds of third-generation lentiviral vectors, a non-targeting human genome and another targeting hPHLDA1 knockdown, to infect developing retinal organoids. The maps of lentiviral vectors are provided in Supplementary Fig. 1. Human retinal organoids with similar sizes and morphological structures were selected and randomly divided into groups of 4–5. Each retinal organoid was transfected with 1 × 10⁶ viral transduction units in RDM + 3 medium supplemented with 5 µg/ml polybrene. After 24 h, the virus-containing medium was removed, and the organoids were maintained under normal culture conditions for 1 week before evaluation. Additionally, Y79 cells from the RB cell line were seeded into a six-well plate at a density of 2 × 10⁶ cells per well, and the lentivirus was diluted to 2 × 10⁷ viral transduction units per milliliter in RPMI 1640 medium. Following a 24-hour transfection period, the virus-containing medium was removed, and the cells were cultured under normal conditions. The cells were harvested 3 days post-infection, and the knockdown of target genes was evaluated by RT-qPCR and Western blot analysis.
Immunofluorescence and imaging
Human retinal organoids were fixed in 4% paraformaldehyde for 30 min at 4 °C, washed with PBS, dehydrated in sucrose concentrations of gradients 6.25-12.5%-25% overnight at 4 °C, embedded in OCT, and sectioned (5 μm thickness) for storage at -80 °C. The entire immunofluorescence staining is performed at room temperature. Sections were incubated with blocking buffer(0.5% Triton X-100/PBS, 1% BSA)for 1 h, incubated with primary and secondary antibodies for 2 h for each, counterstained with DAPI(1:1000)washed, and finally mounted.
Antibody details are in Appendix Table-2. Confocal images were quantified using FIJI-ImageJ, comparing immunostaining intensity to DAPI values.
RT-qPCR
Total RNA was extracted using TRIzol™ Reagent (Invitrogen, 15,596,026), and 1 µg was reverse-transcribed to cDNA using HiScript III RT SuperMix for qPCR (Vazyme, R323-01). Use NCBI-Primer-BLAST to design RT-qPCR primers, and use the two-step method of AceQ Universal SYBR qPCR Master Mix (Vazyme, Q511-03) for RT-qPCR detection to obtain the Ct value. Relative gene expression was calculated using 2−△△Ct method, normalized against β-actin.
Western blot
Cells were lysed using RIPA lysis buffer (50 mM Tris (pH 7.4), 0.1% SDS) and boiled for 10 min at 105 ℃. Whole cell lysates were quantified via BCA kit (Thermo Fisher Scientific, 23,252) before mixing with 5×SDS loading buffer. The prepared samples were separated by SDS-PAGE, and the electrophoretically separated bands were transferred from the gel to PVDF membrane (Millipore, IPVH00010). Membranes were then blocked with 5% skim milk (Biofroxx, 1172GR500) at room temperature for 1 h and incubated with primary antibody at 4 °C overnight. After TBST washing, the membranes were incubated with horseradish peroxidase (HRP)-labeled secondary antibody at room temperature for 1 h. ECL luminescence solution (Millipore, WBKLS0100) and Tanon5200 fully automated chemiluminescence image analysis system was used to obtain bands and ImageJ was used for quantitative analysis.
TUNEL staining
The presence of DNA strand breaks was detected using fluorescent terminal dUTP nick end labeling (TUNEL; Serologals Corporation, Norcross, GA, USA) in the retinal organoids’ sections according to the manufacturer’s instructions. The number of apoptotic cells was counted by FIJI-ImageJ.
CUT&Tag
The Hyperactive Universal CUT&Tag Assay Kit for Illumina (Vazyme Biotech, TD903) was used for CUT&Tag analysis. The raw reads of CUT&Tag were trimmed to 40 bp, and low-quality reads were removed using Trimmomatic v0.32. Paired reads were aligned to the human genome (version hg38) using Bowtie2 v2.3.4.2 with the parameters: “-X 2000 -no-discordant –no-contain”. Reads with a mapping quality (MAPQ) below 10 and PCR duplicated reads were filtered out using Samtools and Picard. SCEAR was used to call CUT&Tag peaks with the parameters: “--broad --broad-cutoff 0.1 -B –SPMR”. The fold enrichment for the peaks compared to a random Poisson distribution (with lambda) had to be greater than 10. The normalized signals of CUT&Tag were represented as the fold change of the treatment over the lambda control (whole genome) using macs2 bdgcmp and converted to BigWig format using bedGraphToBigWig. Peaks were annotated using chipseeker.
RNA-seq analysis
The paired-end clean reads were aligned to the reference genome using STAR. The read counts for each gene were quantified using featureCounts. DESeq2 was employed for differential expression analysis, and the resulting p-values were adjusted using the Benjamini and Hochberg’s approach to control the false discovery rate. Genes with |log2 (Fold Change) | > 1 & adjusted P value < 0.05 were assigned as differentially expressed. GO and KEGG enrichment analysis of differentially expressed gene sets were implemented by the topG.
Retinal organoid cell dissociation for scRNA-seq
We selected 4–5 retinal organoids with similar structural layering for experiments at the rod development time point, treated with Accutase for 30 min at 37 °C to dissociate into single-cell suspensions, and then filtered through a 40 μm cell strainer, and finally resuspend the cells in PBS containing 0.04% bovine serum albumin. ScRNA-seq libraries were prepared using the Single Cell Gene Expression 3’V2 Kit (10×Genomics, Pleasanton, CA, USA) following the manufacturer’s protocol. Briefly, single cells were distributed onto latex gel beads (GEM) within a Chromium instrument, followed by cell lysis, reverse transcription, cDNA amplification, and library construction. All libraries were sequenced on the Illumina HiSeq 2500 platform.
ScRNA-seq analysisPreprocessing of scRNA-seq data
We demultiplexed and aligned the raw scRNA-seq data to the human reference genome (GRCh38) using Cell Ranger (version 3.1) with default parameters. The expression level of each transcript was determined using UMI and transcripts were assigned to cells based on barcode. The genes filtered by the software were then used for subsequent analyses.
Processing and cell-type annotation of human retinal organoids scRNA-seq data
Briefly, different cell markers were used to annotate cell types. Principal component analysis (PCA) was performed on the integrated data to reduce dimensionality, and a k-nearest neighbor graph (k = 30) was constructed based on Euclidean distance in the salient PC space. Different cell clusters were identified using a Louvain-Jaccard graph-based method and labeled based on marker genes and cell type annotation from a previous study [16].
Identification of differentially expressed genes in scRNA-seq data sets
Model-based single-cell transcriptomics (MAST) [19]analysis was used to identify DEGs for each cell type. The identified DEGs were then tested against the asymptotic chi-square null distribution. Genes with FDR correct P < 0.05 were considered to be differentially expressed.
Gene ontology analysis of DEGs
Gene ontology (GO) analysis was performed using clusterProfiler (version 4.0) [20]and visualized using the ggplot2 R package (https://github.com/tidyverse/ggplot2). GO terms or pathways were considered enriched at adjusted P < 0.05.
Statistical analysis
All experiments were performed at least three times. Statistical analysis of data between different groups used GraphPad Prism 8 software for two-tailed unpaired t-test. Data were presented as mean ± SEM. An unpaired two-tailed Student’s t-test was used to determine significance, denoted by ns, not significant; *p < 0.05; ***p < 0.001 and ****p < 0.0001.


留言 (0)