
記住我


Demographic and pathological characteristics of the study participants are shown in Table 1. There were no significant disparities in the age of the subjects when comparing mPTC to PTC, mPTC to MNG, and PTC to MNG cohorts. However, a significant age discrepancy was observed in the mPTC vs. Healthy (P = 0.0208), PTC vs. Healthy (P = 0.0049), and MNG vs. Healthy (P = 0.0009) groups. No significant variations in gender were found within any of the cohorts.
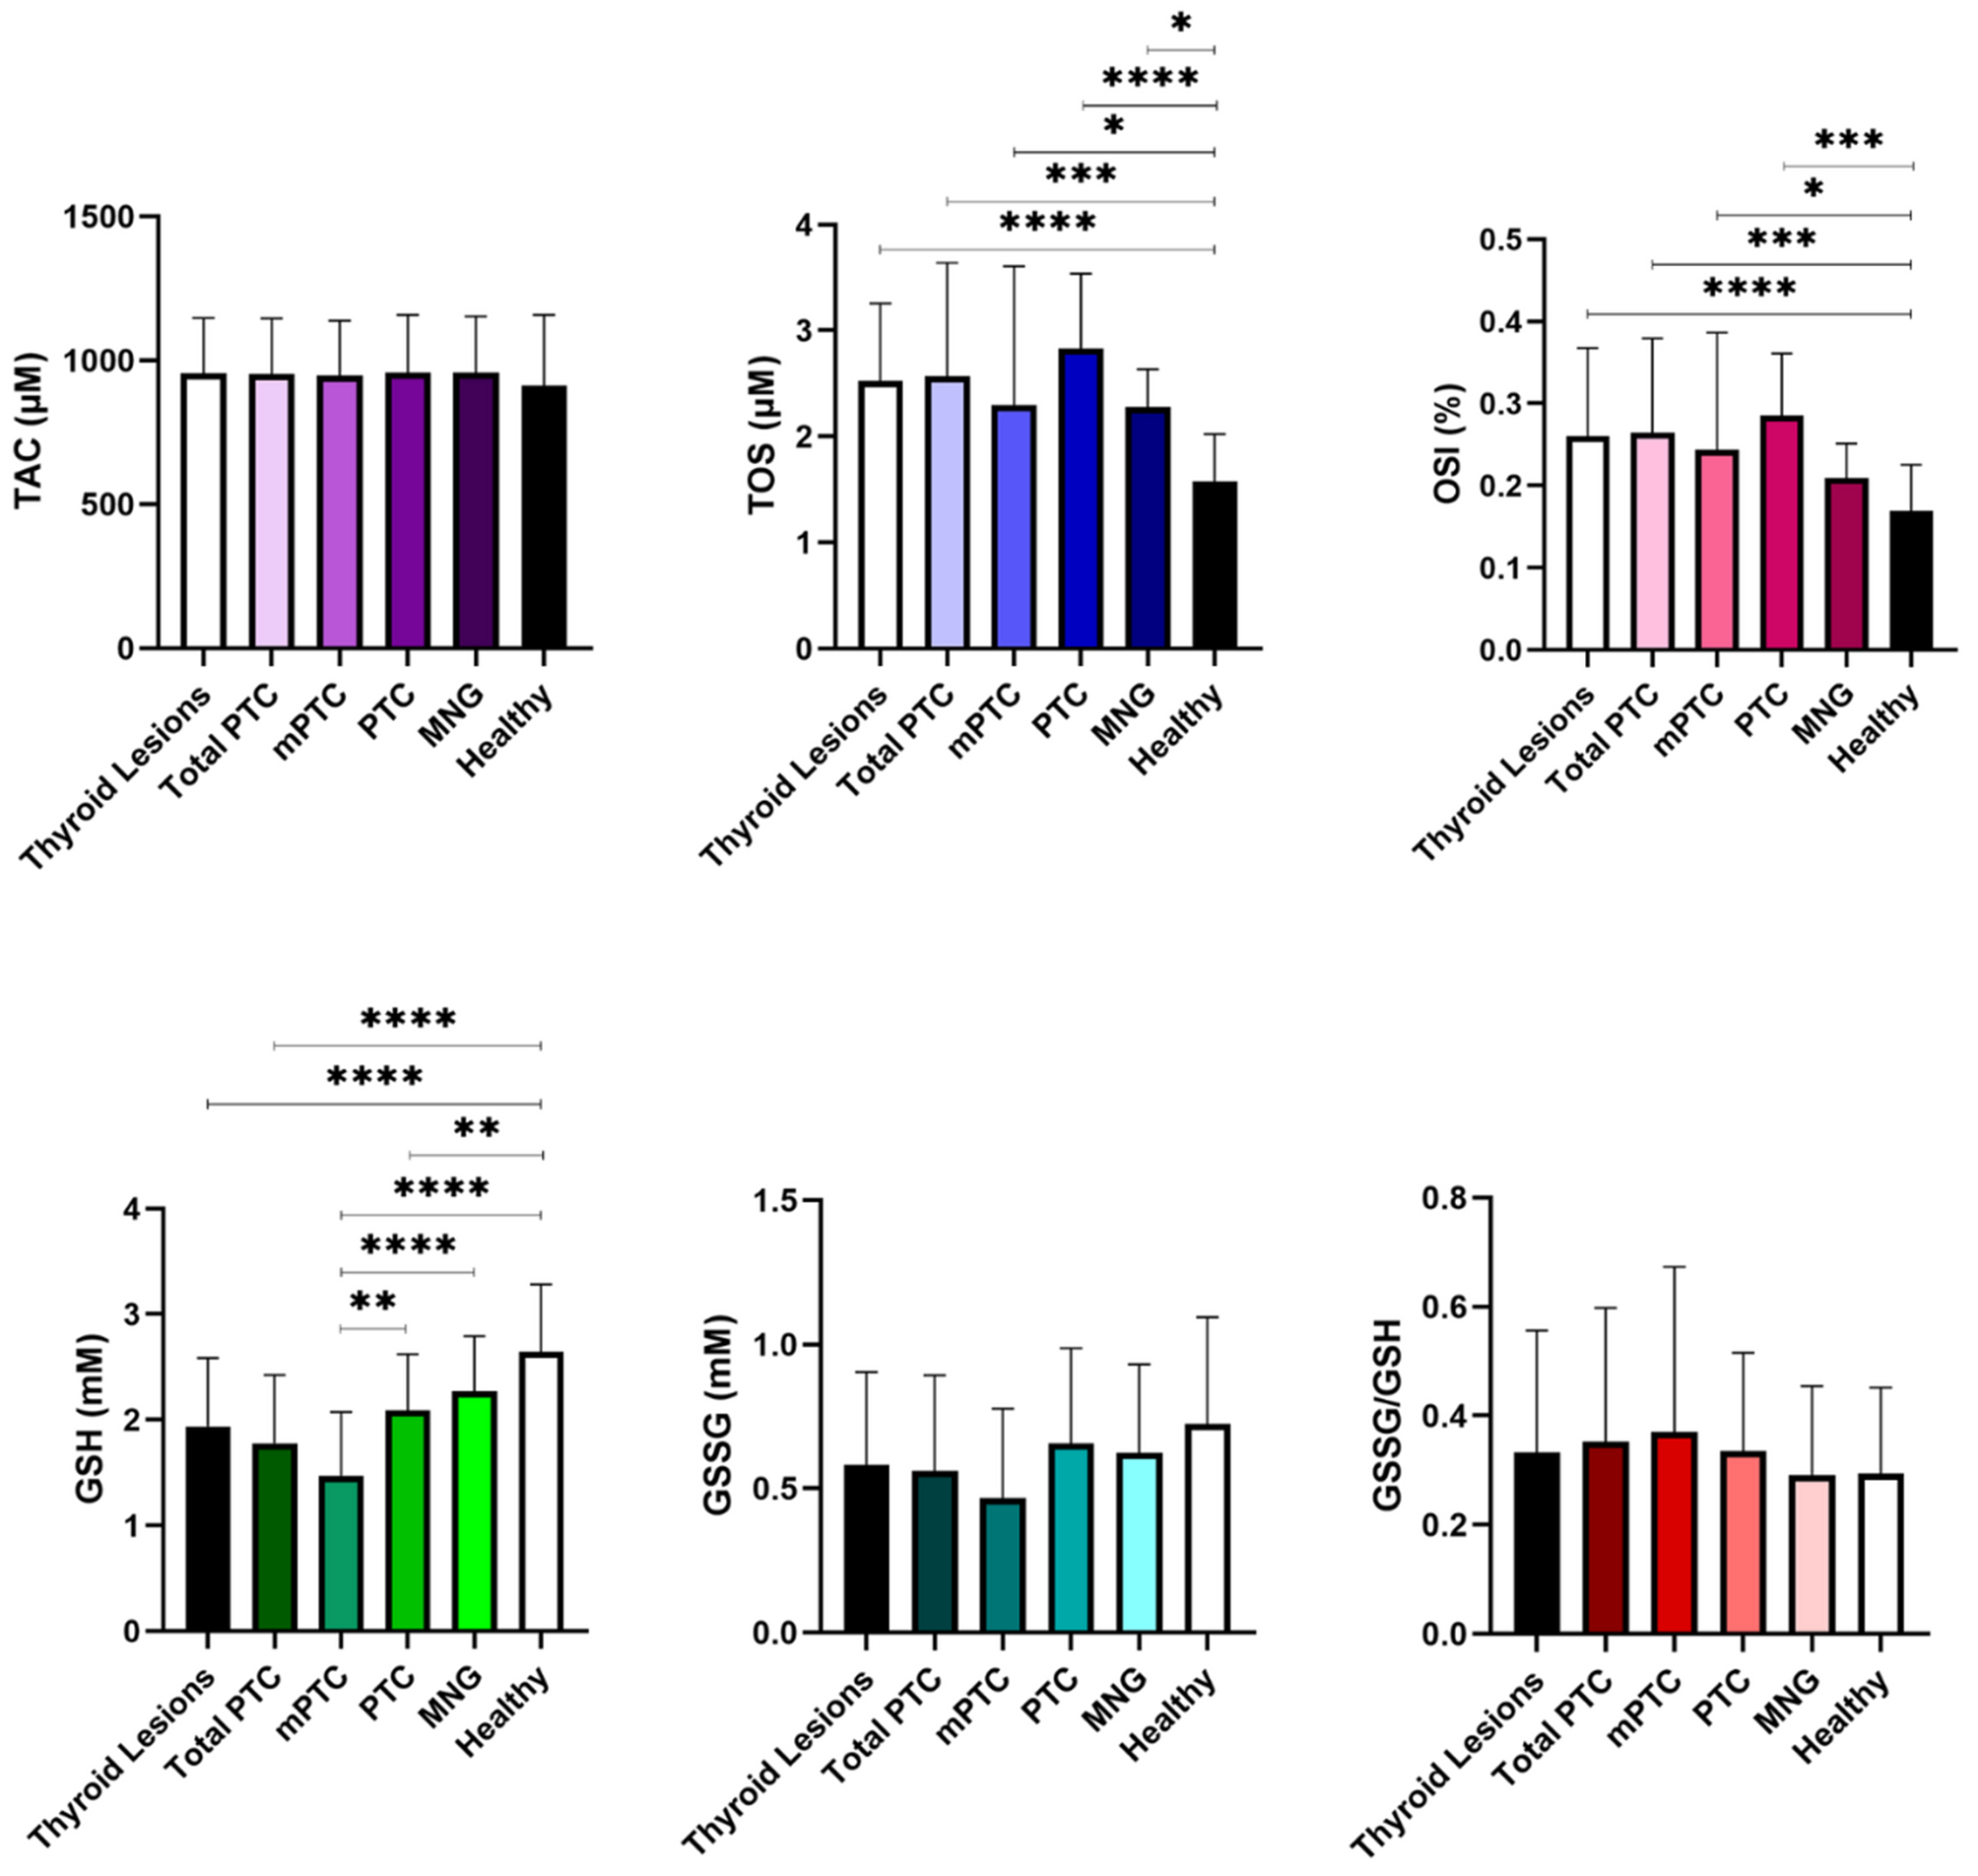
Table 1 Demographic and pathological characteristics of the study participantsPlasma levels of TAC, TOS, and OSI in studied groupsThe concentration of TAC in the patients group was as follows: (i) Thyroid Lesions (mPTC + PTC + MNG) = 954.37 ± 192.74 µM, (ii) Total PTC (mPTC + PTC) = 952.84 ± 193.29 µM, (iii) mPTC = 948.22 ± 190.11 µM, (iv) PTC = 957.67 ± 200.91 µM, (v) MNG = 957.35 ± 195.97 µM, and (vi) Healthy = 912.89 ± 245.01 µM. TAC did not show any significant variation among the studied groups (Fig. 1; Table 2).
Fig. 1
Plasma levels of TAC, TOS, OSI, GSH, GSSG, and GSSG/GSH ratio in patients and Healthy subjects. The p-value < 0.05 is flagged with one star (*), the p-value < 0.01 is flagged with 2 stars (**), the p-value < 0.001 is flagged with three stars (***), and the p-value < 0.0001 is flagged with 4 stars (****)
Table 2 Comparison of plasma levels of TAC, TOS, and OSI in the study populationThe plasma concentration of TOS was: (i) Thyroid Lesions (mPTC + PTC + MNG) = 2.48 ± 0.93 µM, (ii) Total PTC (mPTC + PTC) = 2.57 ± 1.07 µM, (iii) mPTC = 2.30 ± 1.31 µM, (iv) PTC = 2.83 ± 0.70 µM, (v) MNG = 2.28 ± 0.36 µM, and (vi) Healthy = 1.58 ± 0.45 µM. The levels of TOS in all three thyroid lesions (mPTC, PTC, MNG) exhibited significant differences when compared to the Healthy group (Fig. 1; Table 2).
The index of OSI (%) in the plasma was: (i) Thyroid Lesions (mPTC + PTC + MNG) = 0.25 ± 0.10, (ii) Total PTC (mPTC + PTC) = 0.26 ± 0.11, (iii) mPTC = 0.24 ± 0.14, (iv) PTC = 0.29 ± 0.08, (v) MNG = 0.21 ± 0.04, and (vi) Healthy = 0.17 ± 0.06. The OSI in mPTC and PTC patients demonstrated significant disparities in comparison to the Healthy group (Fig. 1; Table 2).
Plasma levels of GSH, GSSG, and GSSG/GSH ratio in studied groupsThe patients group showcased distinct concentrations of GSH as follows: (i) Thyroid Lesions (mPTC + PTC + MNG) = 1.94 ± 0.65 mM, (ii) Total PTC (mPTC + PTC) = 1.78 ± 0.64 mM, (iii) mPTC = 1.47 ± 0.61 mM, (iv) PTC = 2.09 ± 0.53 mM, (v) MNG = 2.27 ± 0.52 mM, and (vi) Healthy = 2.64 ± 0.64 mM. The studied groups, which encompassed Thyroid Lesions vs. Healthy, Total PTC vs. Healthy, mPTC vs. Healthy, and PTC vs. Healthy, exhibited significant disparities in the levels of GSH. Furthermore, the differing levels of GSH were observed not only between mPTC vs. PTC but also between mPTC vs. MNG, indicating their statistical significance (Fig. 1; Table 3).
Table 3 Comparison of plasma levels of GSH, GSSG, and GSSG/GSH ratio in the study populationThe plasma concentration of GSSG quantified the following values: (i) Thyroid Lesions (mPTC + PTC + MNG) = 0.58 ± 0.32 mM, (ii) Total PTC (mPTC + PTC) = 0.56 ± 0.33 mM, (iii) mPTC = 0.47 ± 0.31 mM, (iv) PTC = 0.66 ± 0.33 mM, (v) MNG = 0.62 ± 0.31 mM, and (vi) Healthy = 0.72 ± 0.37 mM. The levels of GSSG were not significantly different in any of the investigated groups (Fig. 1; Table 3).
The plasma exhibited a GSSG/GSH ratio of: (i) Thyroid Lesions (mPTC + PTC + MNG) = 0.33 ± 0.22, (ii) Total PTC (mPTC + PTC) = 0.38 ± 0.32, (iii) mPTC = 0.37 ± 0.30, (iv) PTC = 0.34 ± 0.18, iv) MNG = 0.29 ± 0.16, and vi) Healthy = 0.29 ± 0.16. The GSSG/GSH values were not significantly different among the studied groups (Fig. 1; Table 3).
Oxidative stress parameters in PTC subgroupsOxidative stress parameters (TAC, TOS, OSI, GSH, GSSG, GSSG/GSH) in the Total PTC group were evaluated with respect to demographic and pathological features with adequate sample sizes. The findings from this analysis indicated the absence of any statistically significant differences among the demographic and pathological subgroups. A comprehensive account of this analysis can be found in Table 4.
Table 4 Comparison of plasma levels of oxidative stress parameters in the Total PTC subgroupsDiagnostic value of GSHThe diagnostic value of GSH was determined using the ROC curve analysis. GSH exhibited the capability to diagnose Thyroid Lesions, Total PTC, PTC, and mPTC in comparison to Healthy samples. However, the best results were obtained for the diagnosis of mPTC from Healthy subjects. On the other hand, this marker had the ability to distinguish mPTC from PTC as well as mPTC from MNG (Fig. 2). The ROC curve was also utilized to evaluate the diagnostic significance of TOS and OSI markers (Fig. 3). TOS and OSI showed the ability to distinguish Thyroid Lesions, Total PTC, PTC, and mPTC from Healthy individuals; however, the best result was obtained for distinguishing PTC from Healthy subjects (TOS: AUC = 0.94, P < 0.0001, Cut off > 2.36, Sensitivity = 73.91, Specificity = 100.00 and OSI: AUC = 0.90, P < 0.0001, Cut off > 0.22, Sensitivity = 81.82, Specificity = 85.00).
Fig. 2
The ROC curve analyses of GSH marker for distinguishing mPTC from PTC, MNG, and Healthy subjects
Fig. 3
The ROC curve analyses of TOS, OSI, and GSH markers for distinguishing thyroid patients groups from Healthy subjects
Risk factor value of GSHLogistic regression analysis employed as a statistical method to explore the potential relationship between reduced levels of GSH and the occurrence of mPTC or PTC. The findings revealed that a decrease in the concentration of GSH is linked to an elevated likelihood of developing mPTC and PTC in comparison to Healthy individuals. The logistic regression outputs are illustrated in Table 5.
Table 5 Logistic regression analysis of GSH in mPTC and PTC groups compared to the Healthy controls
留言 (0)