Data and participants
The data used in this study were obtained via a web-based cross-sectional survey conducted in China from May to June 2022. The research team collaborated with a patient association (Meier Advocacy & Support Centre for SMA) to recruit individuals with SMA. The parents of pediatric patients with SMA were invited to join the survey. The parents were included if (1) they perceived themselves as a primary caregiver; (2) their child was aged from 5 to 12 years at the time of the study; (3) they had no cognitive problems; and (4) they were able to provide informed consent. Information regarding the study was sent to all of the eligible parents via the patient organization’s internal social network. Thereafter, all interested members were invited to join an online chat group, and a link to introductory information about the study and the questionnaire was shared with the group. Participants could participate in the formal survey by clicking on the link provided. All of the participants were required to complete the EQ-5D-Y-3 L, PROMIS-25, and PedsQL 4.0 questionnaires. Additional information about their sociodemographic and health status was also collected. The Institutional Review Board of the Chinese University of Hong Kong approved the study protocol and the informed consent form (Ref no.: SBRE-18-268). All of the participants provided written informed consent.
MeasuresEQ-5D-Y-3 L
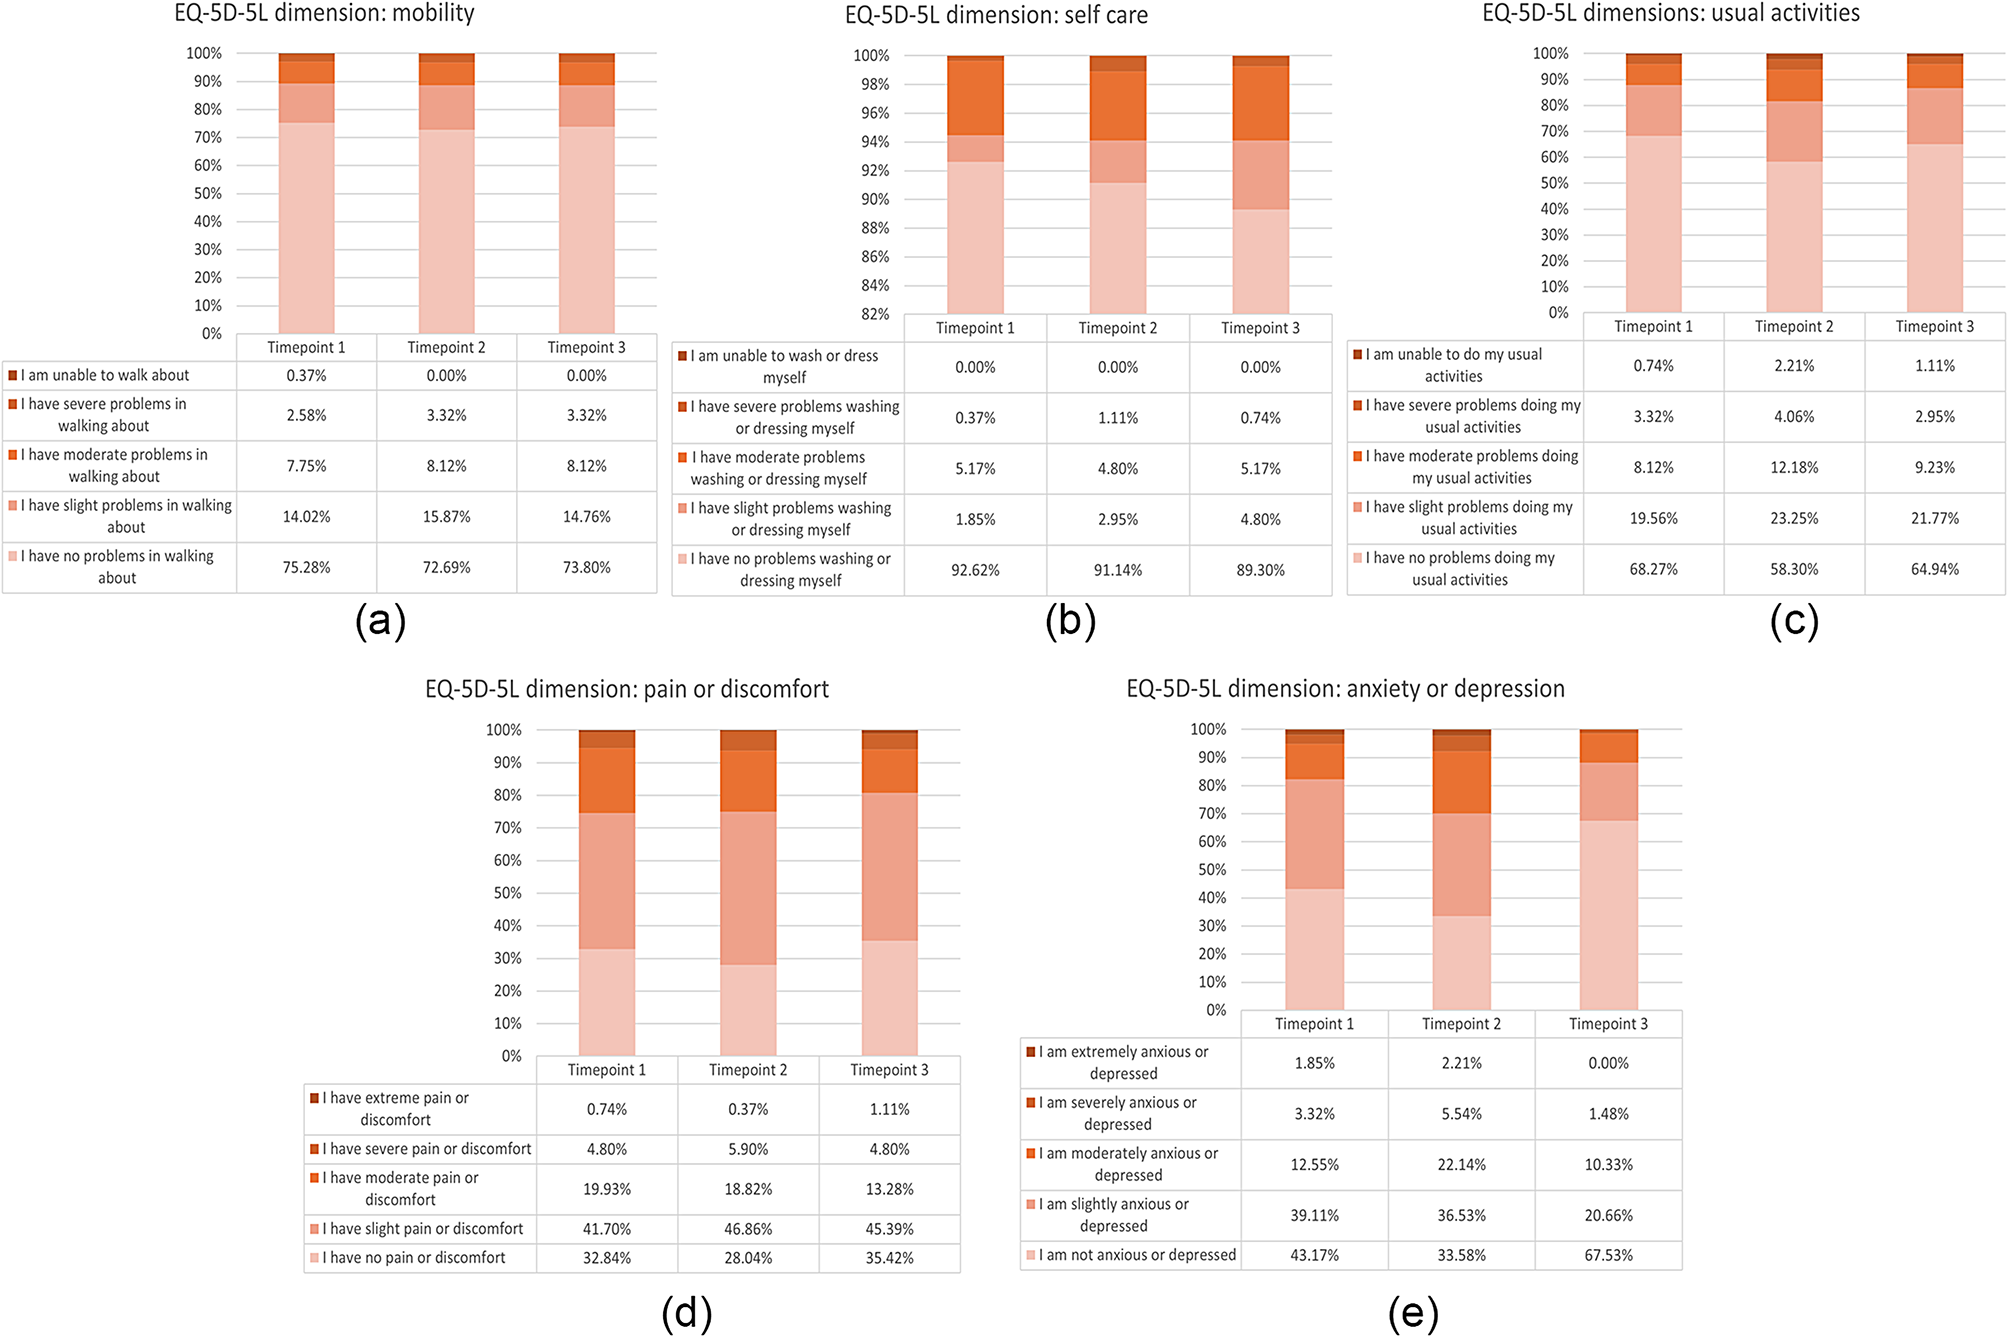
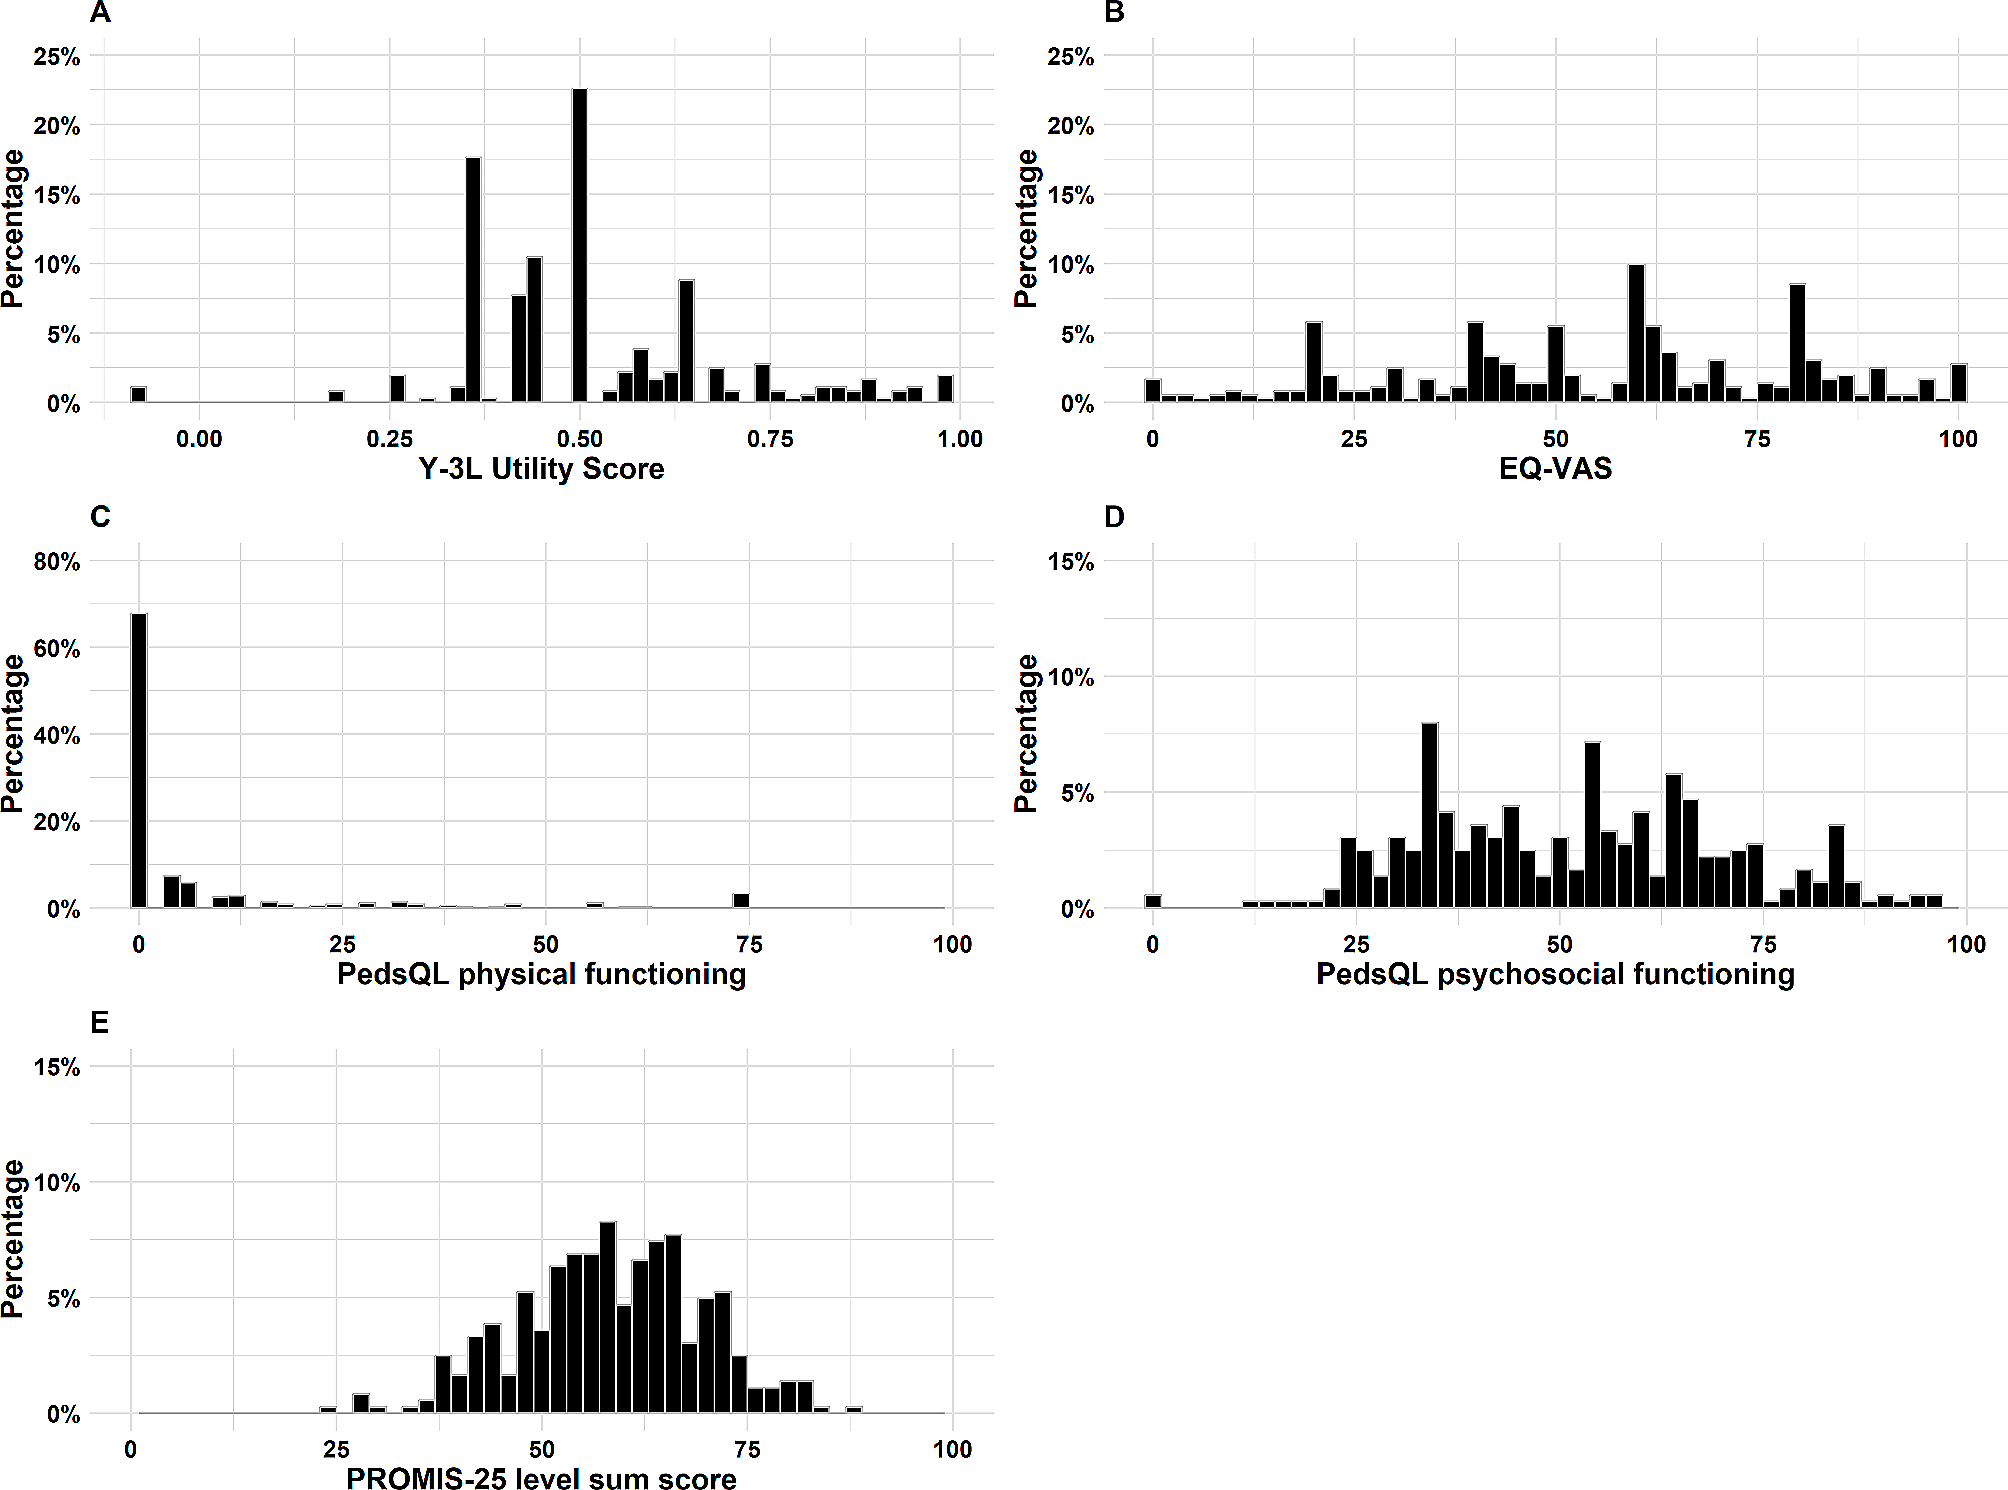
The patient-proxy version of EQ-5D-Y-3 L was used in this study [15]. Its descriptive system has five items (walking about, looking after myself, doing usual activities, having pain or discomfort, and feeling worried, sad, or unhappy). Each item has three option levels (no problems, some problems, and a lot of problems). EQ-5D-Y-3 L also includes a visual analog scale (EQ VAS), where the respondent rates their overall health status on a scale from 0 to 100, with 0 representing the worst and 100 the best health state they can imagine. In this study, the index value of EQ-5D-Y-3 L was estimated using the Chinese value set [16], where higher scores indicate better HRQoL. The psychometric properties of EQ-5D-Y-3 L in Chinese children and adolescents have been confirmed by Wang et al. [17].
PROMIS-25
The patient-proxy version of the PROMIS-25 was used in this study. It consists of six HRQoL domains (mobility, anxiety, depressive symptoms, fatigue, peer relationships, and pain interference) with four questions per domain. The 25th item is a 0-to-10 numerical rating scale item for pain intensity. All other items, except for this one, are rated on a 5-point Likert scale, and the raw item scores are summed and converted to a T-score metric using the scoring manual [18], with higher T-scores indicating better HRQoL. The psychometric properties of the PROMIS-25 in the Chinese population have been reported by Li et al. [19].
PedsQL 4.0
The 23-item patient-proxy versions of the PedsQL 4.0 Generic Core Scale for age groups 5–7 (young child) and 8–12 (child) were used in this study [20]. It includes four domains: physical functioning (8 items), emotional functioning (5 items), social functioning (5 items), and school functioning (5 items). A 5-point response scale was used and each version having essentially identical items. The items were reverse-scored and transformed to a 0-to-100 scale, with higher scores indicating better HRQoL. The psychometric properties of the PedsQL 4.0 in the general Chinese population have been reported by Hao et al. [21].
Statistical analysis
R software was used to perform all of the analyses [22], and the significance level was set at p ≤ 0.05. Descriptive analysis was used to describe the patients’ background characteristics, health status, and profile (e.g., mean, standard deviation [SD], and median) of three measures.
Floor and ceiling effects
The percentage of participants with the highest or lowest possible scores for each dimension of the EQ-5D-Y-3 L, PROMIS-25, and PedsQL 4.0 measures and their overall score were calculated to examine the floor and ceiling effects. Ceiling and floor effects were defined as the number and percentage of patients with the best (ceiling) and worst (floor) level of health in each dimension and across all dimensions (e.g., for EQ-5D-Y-3 L, “11111” and “33333” health states, respectively) [23]. According to the suggestion by Terwee et al. [24], ceiling and floor effects were considered problematic if 15% or more of the sample was at the ceiling or floor of the overall score.
Factorial structure and reliability
As the items of EQ-5D-Y-3 L were designed to be independent of each other, factor analysis and the assessment of internal consistency were not appropriate for this measure. Therefore, the factorial structure and reliability were only assessed for the PROMIS-25 and PedsQL 4.0. For factor analysis, we first used confirmatory factor analysis (CFA) to assess the factorial structure of the two measures. We tested a four-factor structure for the PedsQL 4.0 and a six-factor structure for the PROMIS-25. The fit of the model was evaluated by checking the comparative fit index (CFI, > 0.9), the Tucker–Lewis index (TLI, > 0.9), the root mean square error of approximation (RMSEA, < 0.08), and the factor loading (> 0.3). If the CFA results did not support the model, we used exploratory factor analysis (EFA) to explore the factorial structure of the measures. Bartlett’s test of sphericity (p < 0.05, accept) and the Kaiser–Meyer–Olkin (KMO) test (> 0.6, accept) were used to validate the assumptions of the EFA. The optimal number of factors was determined through factor diagnostics, which included an eigenvalue greater than 1, a very simple structure, and parallel analysis. EFA was conducted on the polychoric correlation matrix using a promax rotation.
The internal consistency of the PROMIS-25 and PedsQL 4.0 was evaluated using Cronbach’s alpha. An alpha value greater than 0.7 was considered acceptable, a value greater than 0.8 was good, and a value greater than 0.9 was excellent [25].
Convergent validity
Convergent validity was assessed by hypothesis testing. We assumed several correlations between the EQ-5D-Y-3 L, PROMIS-25, and PedsQL 4.0 similar domains. For example, we assumed that there is a moderate-to-strong correlation between the EQ-5D-Y-3 L dimension “walking about” and the PROMIS-25 dimension “mobility” and between the EQ-5D-Y-3 L dimension “feeling worried, sad, or unhappy” and the PedsQL 4.0 subscale “emotional functioning.” Spearman’s correlation coefficient (ρ) was used to assess the strength of the dimension-leveled correlation (≤ 0.19, very weak; 0.2–0.39, weak; 0.4–0.59, moderate; 0.6–0.79, strong; and ≥ 0.8, very strong) [26]. Pearson’s correlation coefficient (r) was used to examine the correlations between the EQ-5D-Y-3 L index values and the EQ VAS, PedsQL 4.0, and PROMIS-25 subscale scores, (r ≤ 0.29, weak; r ≤ 0.49 moderate; and r > 0.49 strong) [26].
Known-group validity
The discriminatory ability of the EQ-5D-Y-3 L index value, PedsQL 4.0 overall score, and PROMIS-25 level sum score was examined using analysis of variance (ANOVA) based on the respondents’ reported clinical conditions (e.g., use of airway cleaning, scoliosis, and ability to hold up the head without support). These conditions were confirmed based on our literature review and discussions with an expert team from the patient association. We hypothesized that individuals showing clinical symptoms/conditions would likely report worse scores on HRQoL measures: lower scores on both EQ-5D-Y3L and PedsQL, while showing higher level sum score on the PROMIS-25. The F-statistic, Cohen’s D value (< 0.5 are considered small, < 0.8 moderate, and ≥ 0.8 large [27]), and/or the eta squared value (used for multi-group comparisons; small > 0.01, medium > 0.06, and large > 0.14 [28]) were used to evaluate the efficiency of the measures at differentiating patients with various clinical conditions or physical functioning.


留言 (0)