
記住我

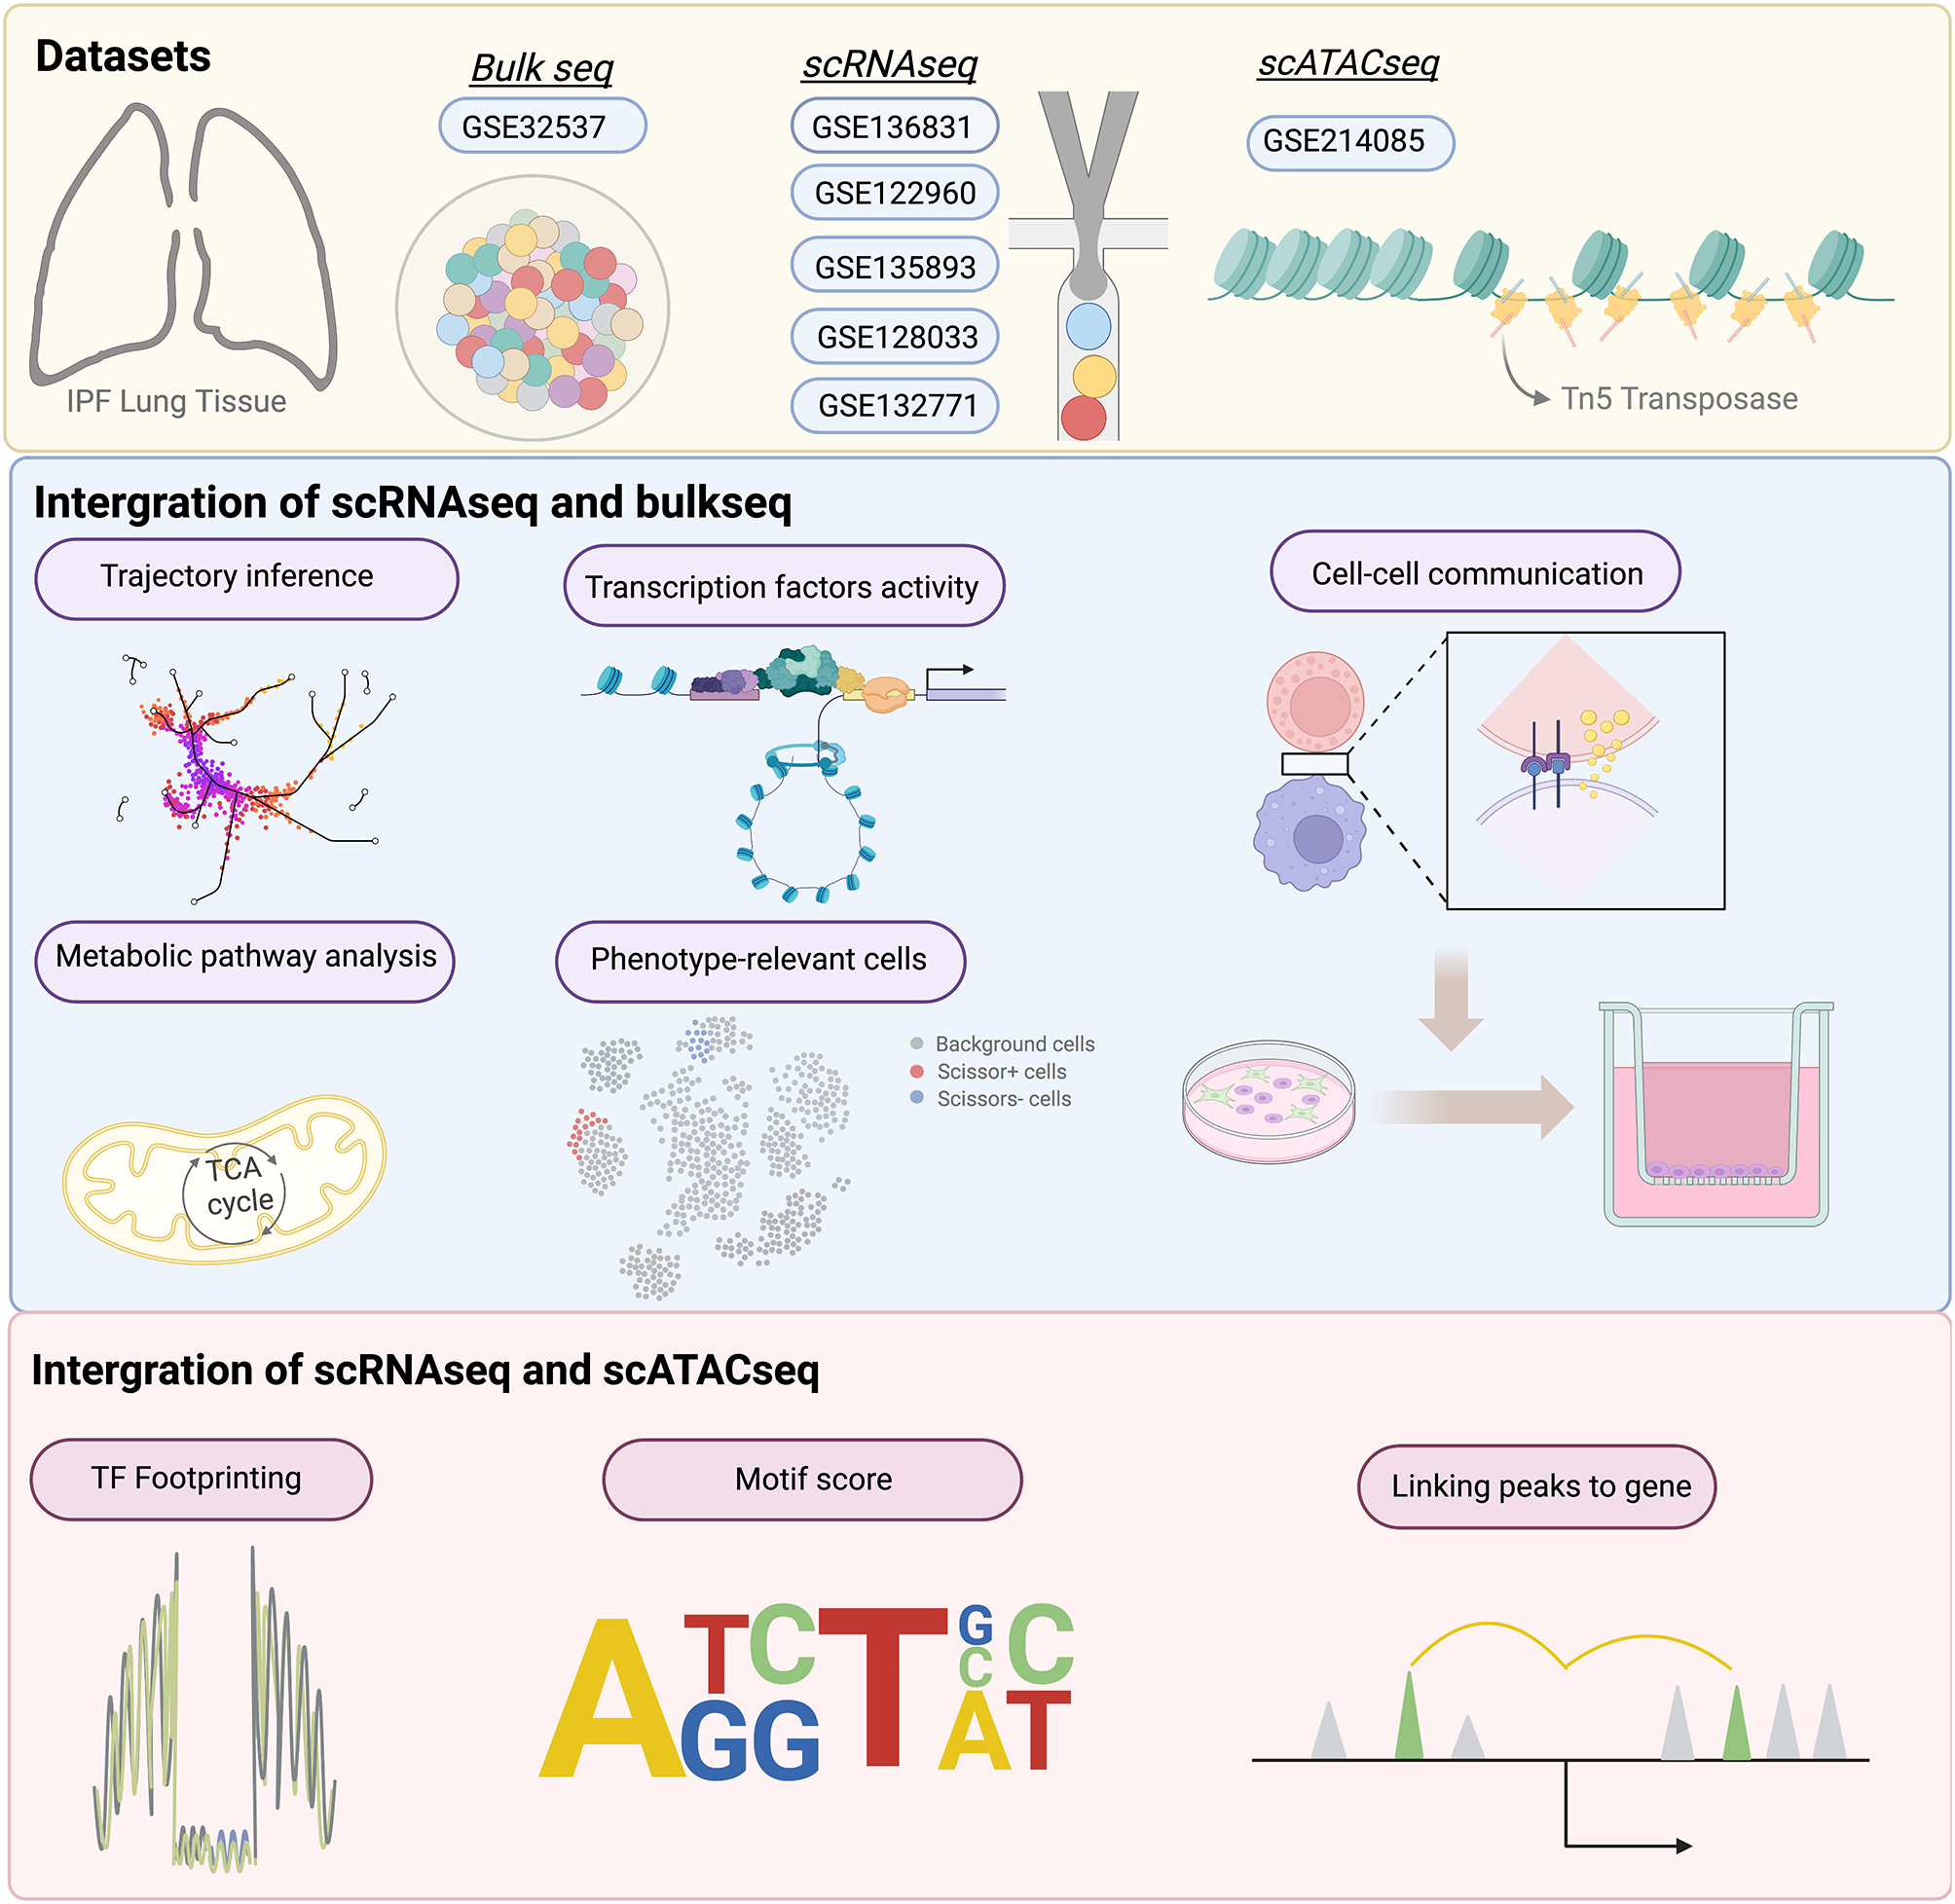


Five single-cell RNA sequencing (scRNAseq) datasets of lung tissue from patients with IPF and control cohorts were obtained from the Gene Expression Omnibus database: GSE 136831, GSE 122960, GSE 135893, GSE 128033, and GSE 132771 [11,12,13,14,15]. Additionally, one scATATCseq dataset was directly extracted from GSE 214085 [16]. Furthermore, we also downloaded the bulk RNA-sequencing dataset GSE 32537, which is the public largest IPF lung tissue bulkseq dataset with the data of lung function test [17]. All patients enrolled in this study were being diagnosed as IPF. Patients with diagnosis of lung cancer, COPD, asthma and other interstitial lung disease were be excluded in this study.
Data preprocessing and cell doublets removalEach sample underwent processing using the Seurat package (version 4.11) in RStudio (version 4.12) [18]. The same quality control and normalization were performed on all five datasets. To ensure data quality, cells that expressed less than 300 genes and with over 20% mitochondrial genes were excluded from the analysis. For normalization purposes, gene expressions were scaled by multiplying by a scale factor of 10,000 and subsequently log-transformed. A subset of 3,000 highly variable genes were then selected. Principal component analysis (PCA) and uniform manifold approximation and projection (UMAP) dimensional reduction were applied prior to the removal of doublets. The Doubletfinder package (V3 version) was employed to predict doublets in every sample [19]. To determine an optimal pK value, BCmvn was used, with a PN value set to 0.25 and nExp to 0.08 × nCells2/10,000.
Batch effect correction, unsupervised clustering analysis, dimensional reduction, and cell type annotationAll cohorts were integrated using an orthogonal approach in Seurat, applying the FindIntegrationAnchors and IntergrateData functions. Following the established workflow of the Anchors integration approach, the integrated data were scaled and PCA analysis was performed. The optimal number of principal components was determined via the ElbowPlot function. Clustering was carried out by applying the FindNeighbors function with dimensions 1–25 and the FindClusters function with resolution 0.1–2. The resulting clusters were then visualized using 2D UMAP. A similar pipeline was applied for the subsequent subclustering analysis. To annotate cell types, differentially expressed genes (DEGs) among different groups were identified using the FindAllmarkers function with the Wilcox test approach. The parameters used for this analysis were as follows: only.pos = TRUE, min.pct = 0.2, logfc.threshold = 0.25.
Trajectory inference and pseudotime analysisThree methods were employed together to assess the pseudotemporal ordering of Mo_AMs, including the Slingshot package (version 2.40), Monocle 2 and Monocle 3 (version 1.2.9) [20,21,22]. The top 20 genes that exhibited significant changes during the trajectory were identified with the graph_test function and Moran I test in Monocle 3. To calculate the velocity from fibroblasts to myofibroblast, the scVelo package (version 0.2.5) was applied in Python with the dynamic model by importing loom files [23].
Intercellular communication evaluated with CellChat packageTo elucidate the cellular interaction and potential mechanisms between Mo_AMs, epithelial cells, and fibroblasts, we employed the CellChat package (version 1.5.0) [24]. Briefly, the createCellchat function was first used to generate a CellChat object. Subsequently, the CellchatDB database, which includes not only ligand-receptor interaction data but also pathway information, was imported for the next analysis. Finally, the functions computeCommunProbPathway and aggregateNet were used to infer the potential pathways and cellular communication across distinct clusters.
Score of metabolism, transcription factor activity, tissue repair and phagocytosisThe activity of PPARγ and PU.1 (SPI1) TFs was investigated using the DorothEA database (version 1.8.0), which includes 1,541 human TF-target interactions and uses collated chipseq data to improve accuracy [25]. To compare the metabolic levels among Mo_AMs and TRMs, the scMetablism package was applied (version 0.2.1), which integrates metabolic-related gene sets from both the KEGG and the REACTOME databases [26]. The sc.metabolism.Seurat function was used to quantify the metabolism in scMetabolism package. We applied the REACTOME database and selected representative lipid and energetic metabolic pathways which were most associated with the biological function of macrophages. The tissue repair score and phagocytosis score were inferred by AddModuleScore function. And the gene sets were listed in Table_S2.
Integration of bulkseq and scRNAseqTo determine the clinical subtype of Mo_AMs associated with fibrosis level, the R package Scissor was used [27]. Based on the official tutorial for the Scissor function, which involves the Gaussian distribution and Lasso regression for continuous variables, we computed the proportion of Scissor + cells that exhibited a positive correlation with FVC%pred, while Scissor − cells displayed a negative correlation with FVC%pred. The function reliability.test was employed to assess the significant differences.
Cell culture and flow cytometryIn present study, THP1, the human monocytic leukaemia cell line was used to generate macrophages. HELF, the human embryonic lung fibroblast was applied to build the fibrosis model. Besides, HELF (#CL0676, Fenghui) cells were cultured in DMEM (#12491-015, Gibco) in the presence of 10%FBS (# 10099-141, Gibco). THP1 cells (#CL-0233, Pricella) were grown in RPMI 1640 medium (#PM150110, procell) containing 10% FBS (# 10099-141, Gibco). Passages ranging from 2 to 6 were used for all experimental procedures. To investigate the effect of TGFß on fibroblasts and establish a fibrosis cell model, as previously described, HELF cells were treated with 5 ng/ml TGFß1 (HZ-1011, Proteintech) for a duration of 24 h. To generate anti-inflammatory and profibrotic M2 macrophages, THP1 cells were differentiated into macrophages via priming with 150 nM PMA for 24 h. M2 macrophages were obtained by incubating with IL4 (20 ng/ml) and IL13 (20 ng/ml) for an additional 72 h. To assess the M2 phenotype, the expression of the classic M2 marker CD206 was examined. Briefly, the cells were suspended in the mouse antihuman CD206 antibody for cell labelling (BD Pharmingen, #555,954) and incubated in the dark for 30 min. The conjugated fluorescence was detected using FACScalibur, and the data were analysed using flowJo 10 (version 8.1). For transwell coculture of active fibroblasts and M2 (Fig. 6E), Corning transwell inserts with 0.4 μm pores were used (polycarbonate transwell inserts). M2 (1 × 10⁵) cells were plated in the inner insert, while fibroblasts (1 × 10⁵) were plated in the well bottom. The coculture system was treated with the presence or absence of AMD1300 (#HY-10,046, MCE), pirfenidone (#HY-B0673, MCE), U0126 (#HY-12,031, MCE), PD98059 (#HY-12,028, MCE) and NUCC-390 (#HY-111,793,MCE) for 24 h (See Fig. 1).
Fig. 1
Schematic diagram of the overall study concept
Western blot (WB), quantitative polymerase chain reaction (qPCR), immunofluorescence staining and ELISAWB experiments were conducted following the previously described procedure. Briefly, for protein extraction, cells were lysed in ice-cold RIPA buffer. The protein concentration was determined using the BCA assay. Protein samples were resolved and separated using 10% SDS-PAGE and subsequently transferred into a PVDF membrane. After blocking with 5% BSA for 1 h, the membranes were subjected to overnight incubation at 4℃ with primary antibodies targeting CXCL12 (Rabbit, #17042-1-AP, 1:3000, proteintech), CXCR4 (Mouse, #60042-1-Ig,1:2000, proteintech), p-MEK (Rabbit,#28930-1-AP,1:2000, proteintech), MEK (Rabbit, #11049-1-AP, 1:10000, proteintech), p-ERK (Rabbit, #28733-1-AP, 1:5000, proteintech), ERK (Rabbit, #51068-1-AP,1:10000, proteintech), α-SMA (Rabbit, #67735-1-Ig, proteintech), and collagen type 1α (Mouse,1:10000,#67288-1-Ig, proteintech), followed by a 1 h incubation with secondary antibodies (Rabbit, #SA00001-2, proteintech; Mouse,# SA00001-2, proteintech). Additionally, to investigate the impact of CXCL12 on the MEK/ERK pathway of M2 macrophages, M2 macrophages were stimulated with the different time points (0 h, 4 h, 8 h) and different concentrations (10 ng/ml and 50 ng/ml) of CXCL12. To further explore the potential role of the CXCX12/CXCR4 axis on the fibrosis model, we cocultured the activated HELF cells with M2 macrophages and M2 macrophages were stimulated with agonist (NUCC-390) and inhibitors of the ERK pathway (U0126 and PD98059). All proteins in the immunoblots were visualized and quantified using ECL. Densitometry analysis was performed in the ImageJ software.
For qPCR, total RNA extraction was carried out using an RNA extraction kit (# G3640-50T, Servicebio). The concentration and purity of the RNA were assessed spectrophotometrically at 260 nm and 280 nm. The cDNA was synthesized using a cDNA synthesis kit (#G3333-50, Servicebio), followed by PCR amplification using SYBR Green PCR master mix (#G3326-01, Servicebio) on the Bio-Rad Real-time PCR instrument. The relative expression was then calculated using the comparative ΔΔCT method. GAPDH or β-actin was utilized a reference gene to normalize relative gene expression levels. The primer sequences were designed using Primer-5 software and synthesized by Invitrogen. The primer pairs can be found in Table S3.
For immunofluorescence staining, cells (1 × 10⁵) were seeded onto glass coverslips. The cells were then fixed with 4% PFA at room temperature for 2 h and gently washed three times with PBS. Cells were incubated with α-SMA (Mouse, #14395-1-AP, 1:500, proteintech) and Collagen type I (Rabbit, 1:400, #67288-1-Ig, proteintech) at room temperature for 1 h. Following multiple washing steps, the cells were labelled with the antirabbit antibody for 30 min at room temperature (Mouse, 1:100,#SA00009-1, proteintech; Rabbit, 1:100,#SA00009-2, proteintech). The fluorescence images were acquired using an epifluorescence microscope (Olympus, BX60).
For ELISA experiments, the supernatants of THP1, M0 macrophages and M2 macrophages were harvested for the measurements of IL10, CCL18 and CCL22 by human ELISA kits (Human IL-10 Elisa Kit, #EH10245S, biotech, shanghai; Human CCL18/PARC Elisa Kit, #EH10070M, biotech, shanghai; Human MCP-1/CCL2 Elisa Kit, #EH10335S, biotech, shanghai) according to the manufacturers’ instructions.
Interference transfection and transwell migration assaysCXCR4 knockdown was conducted followed by M2 macrophages seeded into 6-well plates at cell densities of 60-70%. M2 macrophages were transfected with siRNA via applying Lipofectamine 3000 (#L3000015, Thermos). The CXCR4 siRNA sequence (GGCAAUGGAUUGGUCAUCCUGGUCA) and the control sequence (GGCGGUUUAUGGUACUCCGGAAUCA). WB analysis was performed to validate the siRNA knockdown.
Transwell migration assays were conducted in 24-well transwell inserts with 8 μm pore size (Corning) (Fig. 6B). To obtain the media from the fibrosis model, HELF cells of logarithmic growth phase cells were seeded into 10 cm dishes and the media were collected until the density was 70–80% confluence. M2 macrophages (5 × 10⁵) were introduced into the upper chamber, while the conditional media from the fibrosis model with or without AMD3100 and CXCR4 siRNA were seeded into the lower chambers. Following incubation of the transwell plates at 37 °C with 5% CO2 for 24 h, the migrated cells using crystal violet solution (1%) and visualized through immunofluorescence. Image-Pro Plus software (Media Cybernetics Corporation, USA) was used for counting cell numbers.
scATATCseq processing and integration with scRNAseqThe scATATCseq analysis was conducted using ArchrR (version 1.02), with five fragments used as input for subsequent processing [28]. Fragments exhibiting transcription start site enrichment below 4 and number of unique fragments (log10) below 3 were excluded. After excluding doublets using the filterDoublts function, we employed iterative LSI reduction (addIterativeLSI function) to eliminate batch effects. We then aligned the scATATCseq with our scRNAseq, which had been annotated using the addGeneIntegrationMatrix function derived from the CCA method in Seurat. Subsequently, we generated pseudobulk replicates to calculate motif enrichment analysis and used MACS to call peaks. Following this, we compared comparisons of peaks and TFs between Mo_AMs and TRMs. The AddPeak2GeneLinks function was invoked to determine the regulatory association between peak accessibility and gene expression. For the Mo_AMs analysis, we constructed a differentiation trajectory similar to the scRNA analysis using the addtrajectory function. Lastly, to identify TF drivers along the trajectory, we employed the correlateTrajectories function to integrate gene expression and motif accessibility. These regulatory drivers were visualized through heatmaps.
Statistical analysesStatistical analysis was conducted by Graphad Prism 9 and R (version 4.2.0) via t test or one-way ANOVA. P < 0.05 was considered significant (*p < 0.05; **0.05 < p < 0.01; ***p < 0.001).
留言 (0)