
記住我

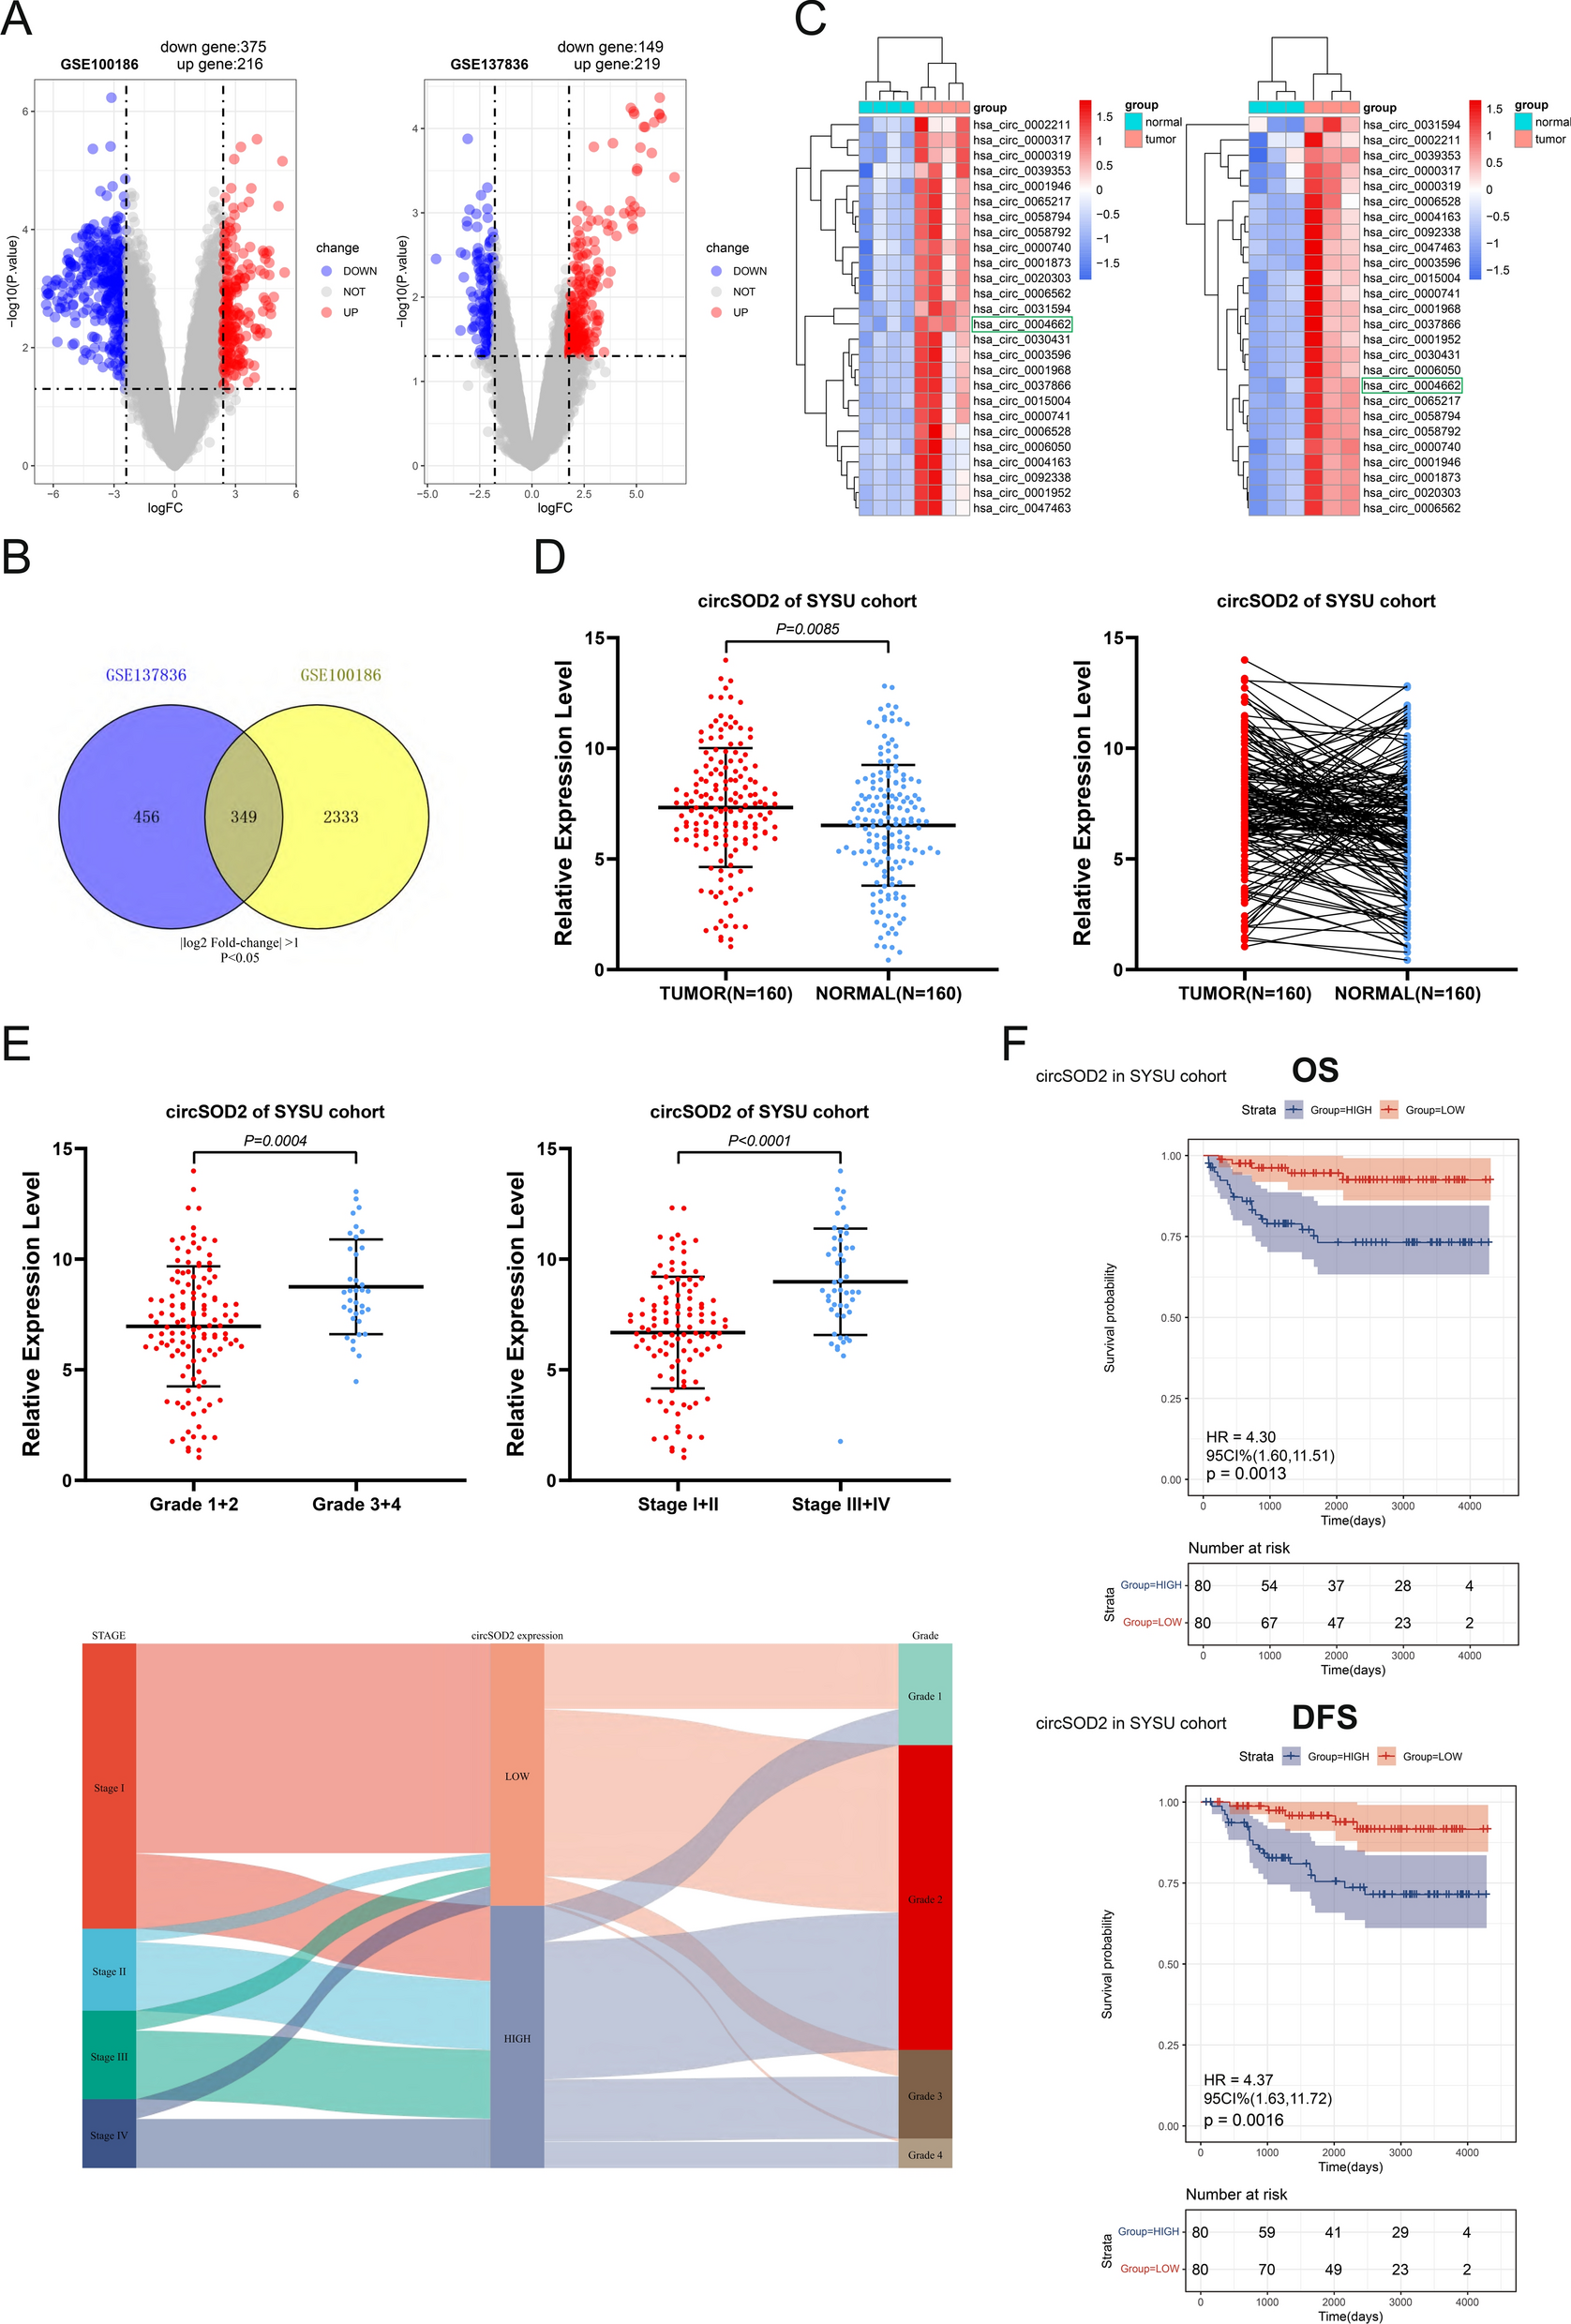


Two circRNA microarray expression profiles of RCC were downloaded from the GEO database for subsequent analysis: GSE137836 (consisting of three primary tumor tissues and their matched three metastatic tumor tissues) and GSE100186 (comprising four tumor tissues and their paired four adjacent normal tissues). By applying the cut-off criteria of |log2 fold-change |> 1 and P < 0.05, we identified 591 differentially expressed circRNAs (DEcircRNAs) in GSE100186, and 368 DEcircRNAs in GSE137836 (Fig. 1A). To narrow down the selection, we took the intersection of these two clusters, resulting in a subset of 349 candidate circRNAs (Fig. 1B) for downstream experiments. To further narrow down the intersection screening scope, the condition was restricted to |log2 fold-change |> 3, resulting in the identification of 26 conclusively DEcircRNAs (Additional file 2: Table S2). Two heatmaps were generated to visually represent the expression differences of these circRNAs in the two datasets (Fig. 1C).
Fig. 1
Identification of circSOD2 in ccRCC tissues. A Volcano plot of GSE100186 and GSE137836. Compared to the adjacent normal tissue (GSE100186) and the primary tumors (GSE137836), Red dots indicate significantly up-regulated circRNAs and blue dots indicate significantly down-regulated circRNAs. B Venn diagram of the intersection of differentially expressed circRNAs in two datasets. C The heat map shows the comparison of the top 26 genes with the most significant expression differences between the two circRNA microarrays. D In the SYSU-FAH patient cohort (160 pairs), circSOD2 expression was higher in tumor tissue, evaluated using qRT-PCR. E In the SYSU-FAH patient cohort, the more advanced the tumor grade and stage, the higher the circSOD2 expression level. F Kaplan–Meier analysis in the SYSU-FAH cohort demonstrated that patients with lower circSOD2 expression had a significantly better prognosis in DFS (the one at the top, P = 0.0013) and OS (the one at the bottom, P = 0.0016)
Association between CircSOD2 expression and prognosis of ccRCC patientsTo validate the screening results obtained from bioinformatic analyses using clinical samples, qRT-PCR to assess the baseline expression level of these circRNAs in the FAH-SYSU patient cohort, consisting of 160 pairs was conducted. Compared to adjacent normal kidney tissues, a significant increase in circSOD2 expression in ccRCC tissues was observed (Fig. 1D). Then, the relationship between circSOD2 expression and clinicopathological features in the patient cohort was analyzed. Our finding indicated that higher expression level of circSOD2 is correlated with more advanced tumor stage and grade (Fig. 1E). Moreover, Kaplan–Meier analysis revealed that patients with lower circSOD2 expression exhibited a significantly better prognosis (Fig. 1F). Results from the chi-square test indicated a positive correlation between circSOD2 expression and the stage and grade of ccRCC, although no significant correlations with other clinical parameters (Table 1). Furthermore, after adjusting for clinical prognostic factors (age, TNM stage, and Fuhrman grade), the expression of circSOD2 remained an independent biomarker in the FAH-SYSU cohort. This suggested that higher circSOD2 expression may be associated with worse survival outcomes, including OS and DFS (Table 2).
Table 1 Correlations between circSOD2 expression levels and clinicopathological characteristics in 160 ccRCC patientsTable 2 Univariate and multivariate Cox regression analyses of different parameters on overall survival (OS) and disease-free survival (DFS)Receiver operating characteristic (ROC) analysis was conducted to assess the predictive accuracy of circSOD2 expression for OS in ccRCC patients. also showed that the expression level of circSOD2 can predict the OS of ccRCC patients with high accuracy, with higher accuracy when combined it with other clinical parameters. By analyzing the values of the area under the curve (AUC), it was found that AUCcircSOD2+SSIGN (= 0.898) was significantly higher than AUCcircSOD2 (= 0.759) and AUCSSIGN (= 0.828) (Additional file 3: Figure S1A,C). Similarly, curves in the DFS analysis of ccRCC patients also support this conclusion (Additional file 3: Figure S1B,D).
Authentication and characteristics of circSOD2 in RCCCircSOD2 is the result of back-splicing of exons 5, 6, and 7, consisting of 462 base pairs, which were derived from the SOD2 gene locus on chromosome 6 (Fig. 2A). Sanger sequencing was performed to confirm the back-splicing junctions of circSOD2, and the results were consistent with those of circBase (Fig. 2A). To verify the expression level of circSOD2 in different cell lines, qRT-PCR was conducted, and the results confirmed that circSOD2 was significantly enriched in RCC cells (769P, 786-O, A498, ACHN, and Caki-1), compared to human renal cortical proximal convoluted tubule epithelial cells (HK2) (Fig. 2B). Random primers or oligo dT primers were used to detect reverse transcription products, and circSOD2 could hardly be detected by oligo dT primers, indicating that circSOD2 did not have a 3’ polyadenylated tail (Fig. 2C). To characterize the circular form of circSOD2, two types of primers were carefully designed: convergent and divergent primers. The results of PCR amplification with different primers and electrophoresis with the product showed that only cDNA with divergent primers could amplify circSOD2, while neither the convergent primers nor gDNA could amplify the desired product of PCR (Fig. 2D). Subcellular localization analysis (Fig. 2E) and FISH assays (Fig. 2F) further demonstrated that circSOD2 was mainly located in the cytoplasm of ccRCC cells. In addition, Actinomycin D and RNase R treatments were used to explore the stability of circSOD2, showing that circSOD2 has a longer half-life (Fig. 2G) and stronger resistance to degradation (Fig. 2H) than linear SOD2 mRNA.
Fig. 2
Authentication and characteristics of circSOD2 in RCC. A circSOD2 was verified by Sanger sequencing. The arrow indicates the back-splicing site of circ SOD2. CircSOD2 is derived by reverse splicing of exons 5, 6 and 7 of the SOD2 gene. B The expression of circSOD2 in RCC cells (769P, 786-O, A498, ACHN, and Caki-1) and human renal cortical proximal convoluted tubule epithelial cells (HK2). C qRT-PCR analysis of circSOD2 in the reverse transcription products using random primers or oligo dT primers. D The presence of circSOD2 was detected in 786-O and Caki-1 cells by qRT-PCR with convergent or divergent primers and validated by gel electrophoresis. GAPDH served as a control. E Comparison of circSOD2 expression in the nucleus and cytoplasm. F FISH analysis confirmed that circSOD2 was predominantly located in the cytoplasm. The nuclei were stained with DAPI. U6, 18S, and circSOD2 were labelled with Cy3. G Stability of circSOD2 and linear SOD2 was assessed by Actinomycin D treatment, followed by qRT-PCR at different time points. H Stability of circSOD2 and linear SOD2 was assessed by RNase treatment, followed by qRT-PCR. (NS, nonsignificant; *P < 0.05; **P < 0.01; ***P < 0.001; ****P < 0.0001)
CircSOD2 promotes the progression of renal cell carcinoma in vitro and vivoTo facilitate with exploring the biological function of circSOD2 and ro regulate the expression of circSOD2, shRNAs targeting the unique back-splicing junction region of circSOD2 were designed and constructed (Fig. 3A). After the introduction of shRNAs, the expression of circSOD2 was significantly knocked down in 786-O and Caki-1 cells, which contained relatively high levels of endogenous circSOD2, whereas the expression of linear SOD2 mRNA was not affected (Fig. 3B). Subsequently, the CCK-8 assay was performed to assess the proliferative capacity in 786-O and Caki-1 cells with circSOD2 downregulation, and was turned out that downregulation of circSOD2 would inhibit cell proliferation (Fig. 3C). Additionally, results of Transwell and Matrigel invasion assays indicated that decrease of circSOD2 can significant inhibit the migration and invasion capacities in 786-O and Caki-1 (Fig. 3D). Moreover, according to the flow cytometry results, downregulation of circSOD2 expression promoted apoptosis of 786-O and Caki-1 cells (Fig. 3E). In addition, a circSOD2-overexpressing lentivirus plasmid was synthesized to further study its function, and significant upregulation of circSOD2 was observed in ACHN and 769P cells, which had relatively low circSOD2 expression among the RCC cell lines (Fig. 3F). Consistent with the findings found in knockdown experiments, circSOD2-overexpressed cells showed increased proliferation (Fig. 3G), migration, and invasion (Fig. 3H) abilities, and decreased apoptosis levels (Fig. 3I). Comprehensively, these results suggested that circSOD2 potentially enhances the proliferation, migration and invasion of ccRCC cells.
Fig. 3
CircSOD2 promotes the progression of renal cell carcinoma in vitro. A Target sites of shRNAs used in the knockdown experiment. Both shRNAs target back-splice junction of circSOD2. B The circSOD2 knockout efficiency of 786-O and Caki-1 cells was measured by qRT-PCR. C CCK8 assays demonstrated that cell proliferation was inhibited after circSOD2 knockdown. D Transwell assays demonstrated that cell migratory and invasive capacity was inhibited after circSOD2 knockdown. E FACS assays demonstrated that cell apoptosis was enhanced after circSOD2 knockdown. F The circSOD2 over-expressed efficiency of 786-O and Caki-1 cells was measured by qRT-PCR. G CCK8 assays demonstrated that cell proliferation was enhanced after circSOD2 over-expressed. H Transwell assays demonstrated that cell migratory and invasive capacity was enhanced after circSOD2 over-expressed. I FACS assays demonstrated that cell apoptosis was inhibited after circSOD2 over-expressed. (NS, nonsignificant; *P < 0.05; **P < 0.01; ***P < 0.001; ****P < 0.0001)
To confirm the tumorigenic effect of circSOD2 on tumor progression in vivo, BALB/c nude mice were used to develop an orthotopic xenograft tumor. In specific, 786-O cells with stable circSOD2 knockout or control were injected into the right renal subcapsule of mice in different groups. Based on the monitor of tumor growth status, we found that mice injected with circSOD2 knockdown cells showed a lower degree of cachexia than controls (Fig. 4A). Furthermore, four weeks after administering the injection, knockdown of circSOD2 significantly inhibited the growth of 786-O cells, which was reflected both in terms of volume and weight of the tumors, compared to those injected with control cells (Fig. 4B–D).
Fig. 4
CircSOD2 promotes the progression of renal cell carcinoma in vivo. A Weekly mice body weight change in the orthotopic xenograft experiment. About 1 × 10⁶ circSOD2-silenced 786-O-luc cells or controlled 786-O-luc cells were injected into subcapsular interspace of the right kidneys. B The picture of the gross tumors in dissected from orthotopic xenograft model (right kidneys). C The mass of the gross tissue of the right kidneys. D Bioluminescence of the tumor tissue of kidney was detected by an in vivo bioluminescence imaging system. E Representative images of gross and microscopic HE stain of the tumor-infiltrated lung. F The metastatic foci in each mouse from two groups were counted under microscope and summarized. G Bioluminescence of the lung metastatic nodules was detected by an in vivo bioluminescence imaging system. (NS, nonsignificant; *P < 0.05; **P < 0.01; ***P < 0.001; ****P < 0.0001)
Next, to explore the metastatic potential of circSOD2 in vivo with a pulmonary metastasis model, 786-O cells were injected into male mice via the tail vein with stable circSOD2 knockdown or control vector. Four weeks after injection, indicated by in vivo imaging system and lung lesion measurement, the significant difference in numbers and volumes of metastatic nodules in the lungs had demonstrated that knockdown of circSOD2 inhibited the metastatic ability of 786-O cells in comparison with control cells. Previous studies had showed that more than 30% of RCC patients would develop metastatic tumor in lung [28,29,30]. Moreover, androgen receptor (AR) was demonstrated to be involved in RCC initiation and progression, leading to higher risk to lung metastasis [31,32,33,34]. Combined with the finding that circSOD2 can motivate the malignant advancement of non-small cell lung cancer [35], we decided to mainly focus on lung metastasis for the assessment of circSOD2’s capacity for distant metastasis. The mice were then sacrificed under anesthesia and their lungs were anatomized for further examination. Hematoxylin–eosin (H&E) staining showed a typical pattern of lung metastasis, and the number of metastatic nodules was significantly lower in the circSOD2 knockdown group than in the control group. This suggested that downregulation of circSOD2 inhibited lung metastasis of ccRCC in vivo (Fig. 4E–G).
MiR-532-3p serves as specific targets of circSOD2 in ccRCC cellsIt is widely known that circRNAs in the cytoplasm may play a part in miRNA inhibition as sponges [15]. Therefore, based on the subcellular localization of circSOD2, we attempted to identify the potential pathway of circSOD2 as a miRNA sponge. To identify the candidate downstream miRNA targets of circSOD2, the sh- and NC-samples of 786-O were used for high-throughput sequencing of miRNAs (refer to GSE199053 for specific results) (Fig. 5A, B). We strictly restricted the thresholds for screening to |log2 fold-change|> 5 and P < 1 × 10⁻¹⁰, and identified nine candidate miRNAs (Additional file 4: Table S3). Then, qRT-PCR was conducted to verify their expression patterns in treated HK2 cells, and five candidate miRNAs (hsa-miR-362-5p, hsa-miR-188-3p, hsa-miR-532-3p, hsa-miR-125b-5p, and hsa-miR-26a-1-3p) with significant differential expression were considered as potential targets of circSOD2 (Fig. 5C).
Fig. 5
miR-532-3p is one of the targets of circSOD2 in ccRCC cells. A, B Heat map and volcano plot showed the difference of miRNA expression with or without circSOD2 knockdown. C The expression of candidate miRNAs were verified in circSOD2 overexpressed HK2 cells and negative control cells by qRT-PCR. D, E Relative expression detected by qRT-PCR and gel electrophoresis of circSOD2 in ACHN and 769P lysates after RNA pull down with circSDHC specific probe or oligo probe. Expression levels were normalized to oligo probe. GAPDH was used as negative control. F Relative levels of candidate miRNAs were detected by qRT-PCR after being pull down by circSOD2 probe or oligo probe. G Relative levels of circSOD2 in ACHN and 769P lysates captured by biotinylated wild-type miRNA-532-3p or mutant miRNA-532-3p. H Schematic diagram model showed the putative binding sites of miRNA-532-3p associated with circSOD2. I Schematic diagram of circSOD2 wild-type (wt) and mutant (mut) luciferase reporter vectors. J Luciferase reporter assay in HEK293T with vector, circSOD2 wild-type sequence and circSOD2 mutant sequence transfected with miR-532-3p mimics. Vector group was utilized as normalization control. K Cellular localization of circSOD2 (Cy3) and miRNA-532-3p (FAM) detected by FISH. Nuclear was label with DAPI dye. (NS, nonsignificant; *P < 0.05; **P < 0.01; ***P < 0.001; ****P < 0.0001)
To demonstrate the direct interactions between circSOD2 and miRNAs in ccRCC cells, we constructed a biotin-labeled circSOD2 probe for the RNA pull-down assay. Compared with the control oligo probe, circSOD2 was significantly enriched using the circSOD2 probe in ACHN and 769P cells, which were transfected with the circSOD2 overexpression vector or negative control (Fig. 5D, E). Next, the probe was used to pull down the miRNAs that potentially bind to circSOD2 in both 786-O and Caki-1 ccRCC cells. The qRT-PCR results showed that, while both miR-532-3p and miR-188-3p upregulated significantly after RNA pull-down with circSOD2 probe, miR-532-3p was the most significantly clustered among the five candidate miRNAs, increased by over two times as much as miR-188-3p (Fig. 5F). Additionally, the binding capacity of miR-532-3p was analyzed as well by transfection. Biotin-labeled miR-532-3p and its mutants were stably transfected into ACHN and 769P cells to overexpress circSOD2, respectively, and circSOD2 captured by miR-532-3p was measured by qRT–PCR. Compared to the mutants, biotin-labeled miR-532-3p had a greater capacity to capture more circSOD2 (Fig. 5G). To perform the dual-luciferase reporter assay, wild-type (-wt) or mutant (-mut) circSOD2 sequences of the binding sites with miR-532-3p were inserted into the psiCHECK-2 vector (Fig. 5H, I). Next, the circSOD2-wt plasmid, circSOD2-mut plasmid, or empty plasmid and miR-532-3p mimic or negative control were co-transfected into HEK293T cells, followed by detection of Renilla luciferase activity. The results showed that compared with the negative control, Renilla luciferase activity was significantly decreased when circSOD2-wt and miR-532-3p mimics were co-transfected, supporting the hypothesis that miR-532-3p specifically binds to circSOD2 (Fig. 5J). Moreover, FISH analysis revealed that circSOD2 and miR-532-3p co-localized in the cytoplasm (Fig. 5K). In summary, the above experimental results collectively confirmed that circSOD2 can uniquely target miR-532-3p as a sponge to influence its expression.
MiR-532-3p plays an inhibitory role in ccRCC by targeting PAX5We evaluated the role of miR-532-3p in ccRCC. Verification was conducted in various cell lines using qRT-PCR, and the expression of miR-532-3p was generally lower in ccRCC cells than in HK2 cells (Fig. 6A). To evaluate the specific function of miR-532-3p in ccRCC cells, we designed mimics and corresponding negative controls. The in vitro experiments demonstrated that the overexpression of miR-532-3p inhibited tumor proliferation, migration, and invasion, and enhanced cell apoptosis, which were observed in 786-O and Caki-1 cells (Fig. 6B–D).
Fig. 6
miR-532-3p plays an inhibitory role in ccRCC by targeting PAX5. A The expression of miR-532-3p in RCC cells (769P, 786-O, A498, ACHN, Caki-1) and human renal cortical proximal convoluted tubule epithelial cells (HK2). B CCK8 assays demonstrated that cell proliferation was inhibited after transfected with miR-532-3p mimics. C Transwell assays demonstrated that cell migratory and invasive capacity was inhibited after transfected with miR-532-3p mimics. D FACS assays demonstrated that cell apoptosis was enhanced after transfected with miR-532-3p mimics. E Luciferase reporter assay in HEK293T cells co-transfected mimics miR- miR-532-3p or mimics NC and candidate genes of Luc-wild-type or Luc-mutant. F Western blot analysis indicated that miR-532-3p could down-regulate PAX5 expression in RCC cells. G Binding site of miR-532-3p and PAX5. (NS, nonsignificant; *P < 0.05; **P < 0.01; ***P < 0.001; ****P < 0.0001)
Next, we assessed the expression patterns in different cohorts. In TCGA cohort, tumor tissues showed lower miR-532-3p expression than normal samples. In addition, from the survival data in the online database, patients with lower miR-532-3p expression had poorer OS and DFS (Additional file 5: Figure S2A). In addition, the differential expression profile of miR-532-3p in ccRCC tissues and normal tissues, as well as its association with patient prognosis (OS and DFS), were also similar to our analysis in the TCGA cohort (Additional file 5: Figure S2C). Similarly, in our FAH-SYSU patient cohort, the expression level of miR-532-3p was negatively correlated with circSOD2, which was confirmed by the qRT-PCR results (Additional file 5: Figure S2E).
Subsequently, TargetScan [36] (http://www.targetscan.org/vert_80/), miRDB [37] (http://www.mirdb.org/), and miRmap [38] (http://mirmap.ezlab.org) were used to predict the target genes of miR-532-3p, and four candidate genes (PAX5, HMGA2, MMP16, and PADI1) were identified. Further screening using a double-luciferase reporter gene assay showed that the vector containing the PAX5-wt sequence significantly reduced luciferase activity, whereas the mutant sequences showed no difference (Fig. 6E). Western blotting also confirmed the correlation between miR-532-3p and PAX5. The expression of PAX5 was significantly decreased after transfection with miR-532-3p mimics, whereas it was upregulated after transfection with the miR-532-3p inhibitor (Fig. 6F). Therefore, we concluded that miR-532-3p could downregulate PAX5 expression in RCC cells, and according to the TargetScan database, its binding type was summarized as a classical 8mer site (Fig. 6G).
PAX5, the gene encoding paired box 5, is specifically upregulated in many cancers, including diffuse large B-cell lymphoma [39], breast cancer [40], glioblastoma [41], and pancreatic cancer [42]. However, the regulatory mechanism of PAX5 in ccRCC has not been explored. In subsequent cell functional experiments, the downregulation of PAX5 inhibited the proliferation (Fig. 7A), migration, and invasion (Fig. 7B) of ccRCC cells and promoted apoptosis (Fig. 7C), with the use of siRNA targeting PAX5. Then we intended to set our insights into the patient cohorts. Analysis of the FAH-SYSU cohort revealed that the expression level of PAX5 was higher in tumor tissues and, to some extent, could predict OS and DFS in patients with ccRCC (Additional file 5: Figure S2D). Moreover, the negative correlated expression pattern of miR-532-3p and PAX5 were demonstrated in the FAH-SYSU cohort (Additional File 5: Figure S2F). A comparable profile was observed in TCGA cohort (Additional file 5: Figure S2B, G). Taken together, these results suggested that PAX5 can be regarded as a target gene of miR-532-3p, acting as an oncogene in ccRCC cells.
Fig. 7
Down-regulation of PAX5 suppresses proliferation, migration and invasion of RCC cells in vitro. A CCK8 assays demonstrated that cell proliferation was inhibited after PAX5 knockdown. B Transwell assays demonstrated that cell migratory and invasive capacity was inhibited after PAX5 knockdown. C FACS assays demonstrated that cell apoptosis was enhanced after PAX5 knockdown. D GSEA analysis in TCGA patients revealed that PAX5 may be involved in PI3K signaling. E Western blot analysis indicated that circSOD2 promotes the ccRCC progression through PI3K-AKT-mTOR pathway. (A–C si-NC, referred to a scramble control of siRNA; si-1 & si-2, referred to siRNA targeting to PAX5 with different sequences; E sh-NC, referred to a scramble control of shRNA; sh-1 & sh-2, referred to shRNA targeting to circSOD2 with different sequences). (NS, nonsignificant; *P < 0.05; **P < 0.01; ***P < 0.001; ****P < 0.0001.)
GSEA (https://www.gsea-msigdb.org/gsea/index.jsp) [43] was used to predict the downstream mechanism of PAX5, and the results showed that the PI3K pathway may be one of the most relevant signaling pathways (Fig. 7D), which is consistent with a previous study [44]. Western blot analysis indicated that the phosphorylation of PI3K, Akt, and mTOR was decreased in cells with circSOD2 knockdown, using shRNA to achieve a more stable transfection, while circSOD2-overexpressed cells showed the opposite trend (Fig. 7E).
CircSOD2 rescues the tumor suppressive effect of miR-532-3pTo investigate whether circSOD2 promoted RCC progression by sponging miR-532-3p, a rescue experiment was conducted. After circSOD2 knockdown or overexpression, the abundance of miR-532-3p was altered and changes in cell function were observed. Knockdown of circSOD2 reduced the proliferation, migration, invasion, and viability of 786-O cells, but the inhibitory effect could be reversed by miR-532-3p inhibitors (Fig. 8A, B, E). Similar regulation was observed in 769P cells overexpressing circSOD2 and miR-532-3p mimics (Fig. 8C, D, E).
Fig. 8
circSOD2 rescues the tumor suppressive effect of miR-532-3p. A Cell proliferation ability of 786-O transfected with control vector, miR-532-3p mimics alone or circSOD2 overexpressed plus miR-532-3p mimics. B Cell migration and invasion abilities of 786-O transfected with control vector, miR-532-3p mimics alone or circSOD2 overexpressed plus miR-532-3p mimics. C Cell proliferation ability of 769p transfected with control vector, miR-532-3p inhibitor alone or circSOD2 shRNA plus miR-532-3p inhibitor. D Cell migration and invasion abilities of 769p transfected with control vector, miR-532-3p inhibitor alone or circSOD2 shRNA plus miR-532-3p inhibitor. E Apoptosis of 786-O transfected with control vector, miR-532-3p mimics alone or circSOD2 overexpressed plus miR-532-3p mimics (above), and apoptosis of 769p transfected with control vector, miR-532-3p inhibitor alone or circSOD2 shRNA plus miR-532-3p inhibitor (below). F Western blot of PAX5 and p-PI3K levels after 769p transfected with control vector, miR-532-3p inhibitor alone or circSOD2 shRNA plus miR-532-3p inhibitor (left), and 786-O transfected with control vector, miR-532-3p mimics alone or circSOD2 overexpressed plus miR-532-3p mimics (right). G The diagram of the signal pathway. (NS, nonsignificant; *P < 0.05; **P < 0.01; ***P < 0.001; ****P < 0.0001)
Western blot assays also showed results consistent with functional changes. In 786-O cells, the activity of PAX5 and p-PI3K proteins decreased after transfection with miR-532-3p mimics, and this alteration could be rescued by transfecting the circSOD2 overexpression vector. In contrast, after transfection with miR-532-3p inhibitors, PAX5 and p-PI3K were activated, but this effect was weakened by the introduction of circSOD2 shRNA in 769P cells (Fig. 8F). A diagram of the related signaling pathway is shown in Fig. 8G.
PAX5 enhances the biosynthesis of circSOD2 in ccRCC cellsThe production of circRNAs is regulated by a variety of factors [45,46,47], and PAX5, a transcription factor, can promote the synthesis of various circRNAs [42]. To further explore the transcriptional regulatory mechanism of circSOD2 in ccRCC, we used the JASPAR [48] (https://jaspar.elixir.no/), HumanTFDB [49] (http://bioinfo.life.hust.edu.cn/HumanTFDB#!/), and PROMO [50] (https://alggen.lsi.upc.es/cgibin/promo_v3/promo/promoinit.cgi?dirDB=TF_8.3) databases to search for possible transcription factors that might regulate circSOD2. As the factor with the highest overall score, two possible transcription factor binding sites (TFBS) in the promoter of circSOD2 (site 1: − 107 ~ − 96, tgcgtgagcac; site 2: − 34 ~ − 16, gaggcagcagtgctcagc) were predicted (Fig. 9A, B). When we knocked down PAX5 in 786-O cells, the expression of circSOD2 was also reduced (Fig. 9C). We then designed vectors containing mutations at each of the two sites for the luciferase reporter assays. The results showed that the expression of PAX5 significantly activated site 1, but not site 2 (Fig. 9D, E). To determine whether PAX5 directly binds to the circSOD2 promoter, ChIP assays were performed and it was found that PAX5 was enriched at site 1 (Fig. 9F). These data suggest that transcription factor of PAX5 accelerates the biogenesis of circSOD2.
Fig. 9
PAX5 enhances the biosynthesis of circSOD2 in ccRCC cells. A Venn diagram shows the intersection of transcription factors predicted by the three databases. B PAX5 has two possible transcription factor binding sites in the promoter of circSOD2. C qRT-PCR showed that the expression of circSOD2 decreased with the knockdown of the expression of PAX5 in 786-O cells. D Schematic diagram of luciferase reporter vectors containing mutations at each of these two sites (S1-MUT-Luc and S2-MUT-Luc). E Luciferase assays proved the the expression of PAX5 significantly activated the site 1, rather than the site 2. F ChIP assay showed that PAX5 was enriched at site 1. (NS, nonsignificant; *P < 0.05; **P < 0.01; ***P < 0.001; ****P < 0.0001)
留言 (0)