Study population
This cross-sectional study examines the interplay of genetic and MD diet in prevalent MASLD. This study utilized data from population-based cohorts within the Korean Genome and Epidemiology Study (KoGES), which includes the KoGES_Ansan and Ansung study (a community-based cohort in urban and rural counties), the KoGES_health examinee study (a national health examinee registry), and the KoGES_cardiovascular disease association study (a community-based cohort in rural counties). In the KoGES_Ansan and Ansung study, participants aged 40–69 years voluntarily enrolled at baseline between 2001 and 2002. For the KoGES_health examinee study, participants aged 40 years and over were enrolled at baseline from 2004 to 2013. In the KoGES_cardiovascular disease association study, participants aged 40–69 years were enrolled at baseline from 2005 to 2011.
For baseline recruitment, eligible participants were invited to participate through various methods such as on-site invitations, mailed letters, telephone calls, media campaigns, or community leader-mediated conferences. Those who expressed interest were asked to visit survey sites, comprising more than 50 national and international medical schools, hospitals, and health institutions. At these sites, participants underwent interviews, completed questionnaires administered by trained staff, and underwent physical examinations. The primary reasons for declining participation included changes in contact information (telephone numbers or mailing addresses), being too busy to attend, and not responding to telephone calls [15].
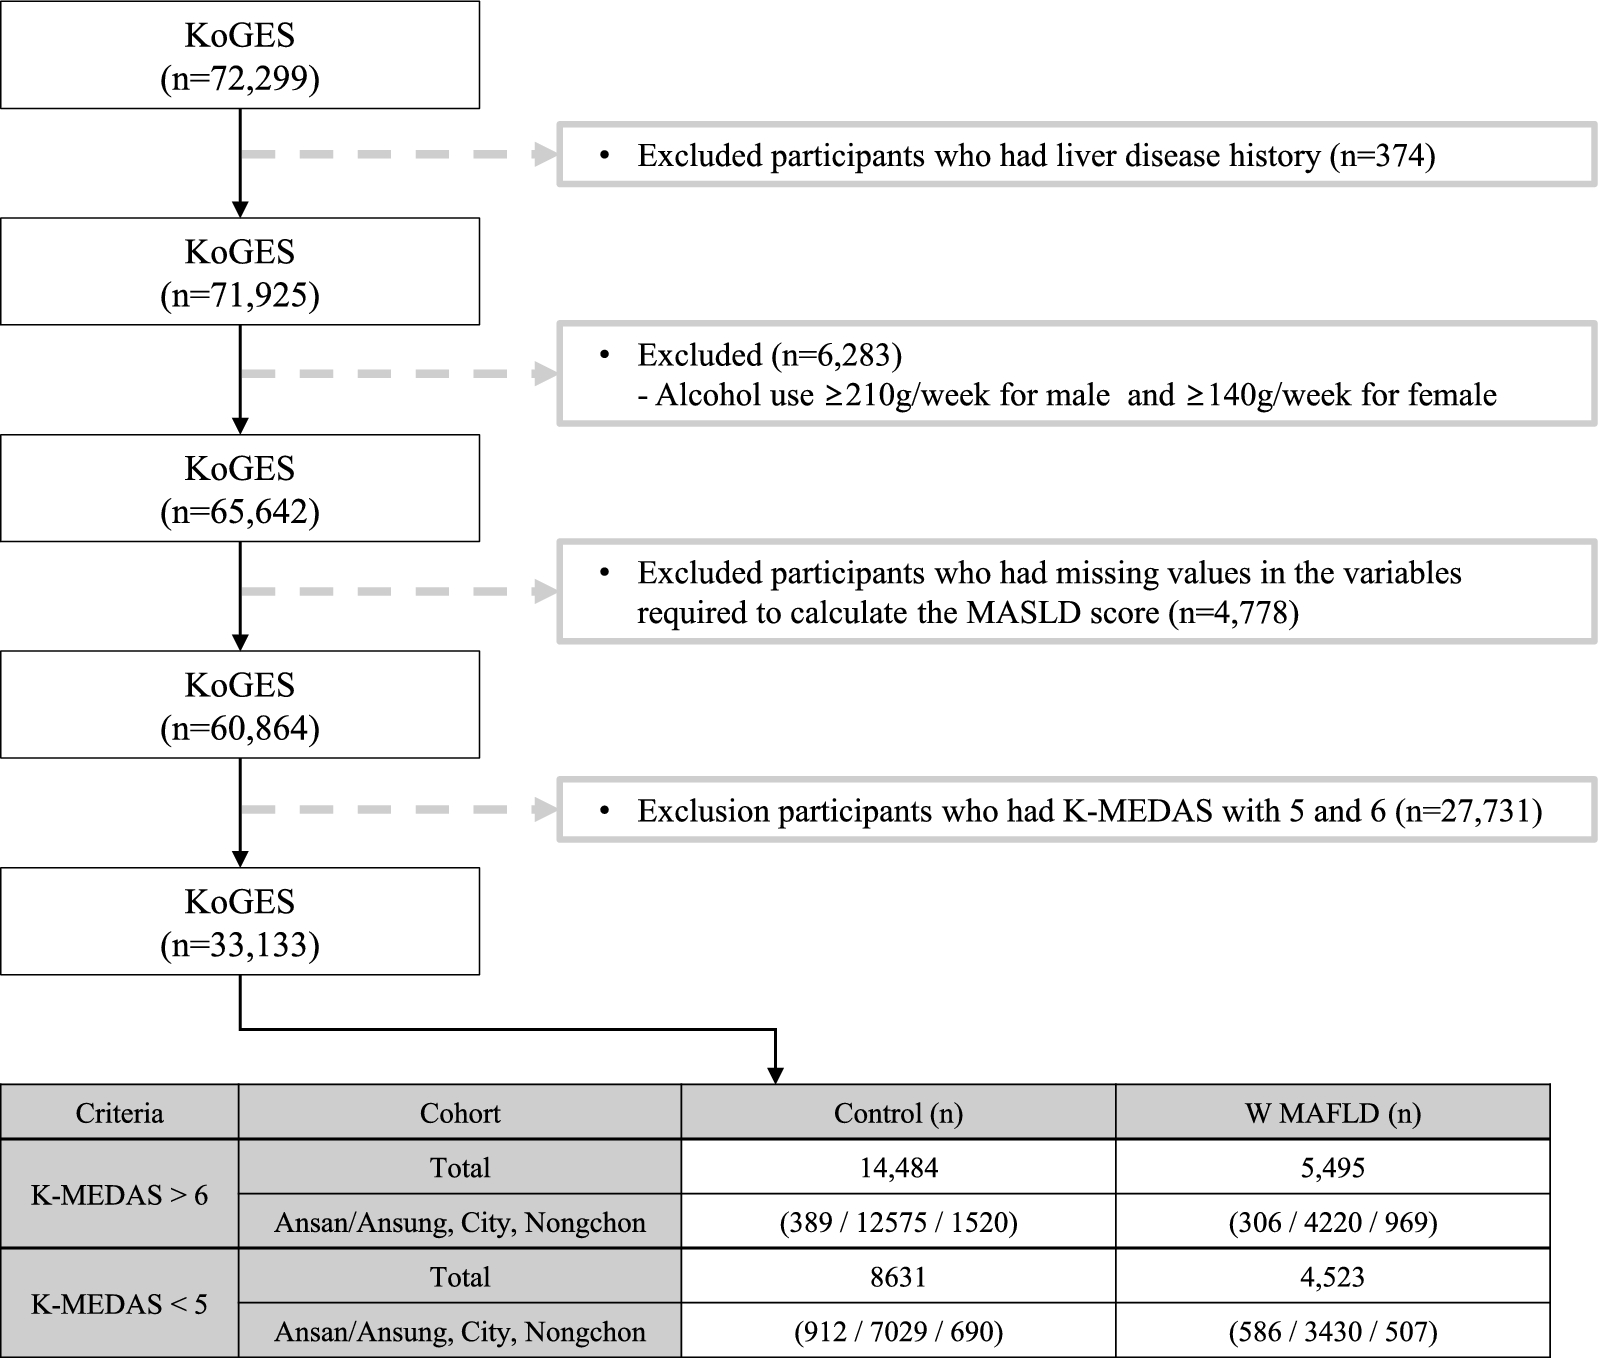
Within the KoGES, 72,299 individuals aged 40 years and older who have genome-wide single nucleotide polymorphism (SNP) genotype data were found. Participants within KoGES who had been diagnosed with liver diseases (n = 374), consumed alcohol > 210 g/week in men and 140 g/week in women (n = 6.283), had missing data pertaining to laboratory or anthropometric measurements (n = 4.778) were excluded. To distinctly investigate the genetic variations based on MD adherence, the participants were stratified into tertile groups based on the Korean version of the Mediterranean-Diet Adherence Screener (K-MEDAS) (T1: < 5; n = 13,154, T2: 5 and 6; n = 27,731, T3: > 6, n = 19,979). Subsequently, Genome-Wide Association Studies (GWAS) analysis was exclusively conducted on the upper (top 33.3%) and lower (bottom 33.3%) tertile groups. Therefore, individuals with a K-MEDAS score of 5 or 6 (n = 27,731) were also excluded. In total, 33,133 participants were included in the final analysis. Within the lower tertile group (K-MEDAS < 5; n = 13,154) a comparison of SNP differences was conducted between the without (n = 8.631) and MASLD (n = 4.523) participants. Similarly, within the upper tertile group (K-MEDAS > 6; n = 19,979), an analysis of SNP differences was performed between the individuals without (n = 14,484) and with MASLD (n = 5,495).
Informed consent was provided and obtained from all participants in this study. This study was approved by the Institutional Review Board, Theragen Bio (approval number: 700062-220814-GP-007-003).
Assessment of dietary intake and MD adherence
For dietary assessment, a semi-quantitative FFQ was designed, incorporating 103 items, and administered as part of KoGES [16]. Respondents reported the consumption frequency and portion sizes of foods consumed over the preceding year. The analysis of questionnaire data, referencing a food composition database, facilitated the estimation of dietary intakes. Based on the FFQ data, total calories, macronutrient intakes, and micronutrient intakes were estimated.
The K-MEDAS questionnaire, previously developed and validated in a separate study, was employed to assess adherence to the Mediterranean Diet (MD) [14]. Consisting of 14 questions, each scored as either 0 or 1, the K-MEDAS questionnaire yielded a total score ranging from 0 to 14 points. Based on FFQ, foods were categorized to derive a corresponding score for the K-MEDAS. A higher score indicated stronger adherence to the MD. Detailed information about the K-MEDAS questionnaire is provided in the Table S1.
Covariates
Body mass index (BMI) was computed as weight (kg) divided by the square of height (m). Waist circumference (WC) was measured at the midpoint between the lowest rib and the iliac crest. Blood pressures were measured twice using a mercury sphygmomanometer while sitting. Smoking status was classified into three categories: non-smokers, ex-smokers, and current smokers. Alcohol consumption was categorized as non-drinkers (consuming alcohol fewer than 12 times annually, with a single serving not exceeding one cup), ex-drinkers, and current drinkers. Regular exercise leading to perspiration was considered indicative of engagement in physical activity. Participants were requested to fast for at least 8 h before undergoing blood tests. Total cholesterol (TC), triglyceride (TG), high-density lipoprotein (HDL) cholesterol, blood glucose, glycated hemoglobin (HbA1c), insulin, C-reactive protein (CRP), γ-glutamyltransferase (γ-GGT), aspartate transaminase (AST), and alanine transaminase (ALT) were measured by enzymatic methods using a chemistry analyzer (Hitachi 7600, Tokyo, Japan by August 2002 and ADVIA 1650, Siemens, Tarrytown, NY from September 2002) according to standardized protocol [15]. Homeostasis model assessment of insulin resistance (HOMA-IR) was calculated as follows: HOMA-IR = (fasting plasma glucose (FPG) in mmol/L × fasting serum insulin in pmol/L) ÷ 22.5 [17]. Hypertension was defined as either a systolic (SBP) or a diastolic blood pressure (DBP) of ≥ 140 mmHg or ≥ 90 mmHg, respectively, or when participants self-reported the diagnosed diseases [18]. Type 2 diabetes was defined as either a fasting blood glucose level of ≥ 126 mg/dL or HbA1c ≥ 6.5% or when participants self-reported the diagnosed diseases [19]. Overweight and obese were defined as BMI ≥ 23 kg/m2 and ≥ 25 kg/m2, respectively [20].
Assessment of MASLD
A positive diagnosis of MASLD was established based on the presence of blood biomarker evidence of hepatic steatosis and meeting one of the following three criteria: overweight or obesity, the presence of type 2 diabetes, or the presence of at least two metabolic risk abnormalities [21]. Metabolic risk abnormalities are as follows: (1) WC ≥ 90 cm in men and WC ≥ 80 cm in women, (2) SBP ≥ 130 mmHg or DBP ≥ 85 mmHg or drug treatment, (3) TG ≥ 150 mg/dL or drug treatment, (4) HDL-C < 40 mg/dL in men and < 50 mg/dL in women, (5) presence of prediabetes (fasting glucose level 100–125 mg/dL or HbA1c 5.7–6.4%), (6) HOMA-IR score ≥ 2.5, and (7) CRP > 2 mg/dL.
The formula for calculating the Fatty Liver Index (FLI) score is as follows:
FLI = [e^(0.953 × ln(TGs) + 0.139 × BMI + 0.718 × ln(γGTP) + 0.053 × WC − 15.745)] / [1 + e^(0.953 × ln(TGs) + 0.139 × BMI + 0.718 × ln(γGTP) + 0.053 × WC − 15.745)] × 100 [22, 23]. The presence of hepatic steatosis was defined as an FLI > 30 [22, 23].
Genotyping
Fasting blood samples were collected in a one-serum separator tube and two ethylenediaminetetraacetic acid tubes. Blood DNA samples were prepared and transported to the National Biobank of Korea. SNP genotypes were obtained using the Korea Biobank array (KoreanChip), which was specifically designed for the Korean population to facilitate GWAS on blood biochemical traits. The KoreanChip included > 833,000 markers, encompassing over 247,000 rare or functional variants, derived from the sequencing data of over 2,500 Koreans [24]. Detailed information about the KoreanChip can be found in a previous study [24]. Rigorous criteria were applied during KoreanChip data analysis to ensure genotyping quality: a call rate of > 97%, a missing genotype rate of < 0.01, a minor allele frequency of > 0.01, and a Hardy–Weinberg equilibrium p-value of > 0.000001.
Statistical analysis
Data were presented as mean ± standard deviation or as number (percentages). Continuous variables were evaluated using students’ t-tests to compare individuals with and without MASLD, while categorical variables were assessed using Chi-squared tests. Principal component analysis was implemented to mitigate genomic data bias stemming from sample collection regions. Principal component (PC) 1 and PC 2 were included as covariates in subsequent statistical analyses. Logistic regression was applied to examine the single-marker variants for genetic associations with MASLD prevalence, with adjustments for age, sex, BMI, exercise, alcohol, smoking, PC1, and PC2. All statistical analyses were carried out using PLINK software (version 1.07). Significance was determined at p < 5 × 10⁻⁸. Values of p < 5 × 10⁻² were considered statistically significant for the gene-MD interaction.


留言 (0)