Study design and enrolment
In this single-center, self-controlled cohort study, we investigated patients with active UC who received two FMT procedures at an interval of 8 weeks. Disease assessments were conducted before FMT (F0), 8 weeks after the first FMT (F1), and 8 weeks after the second FMT (F2).
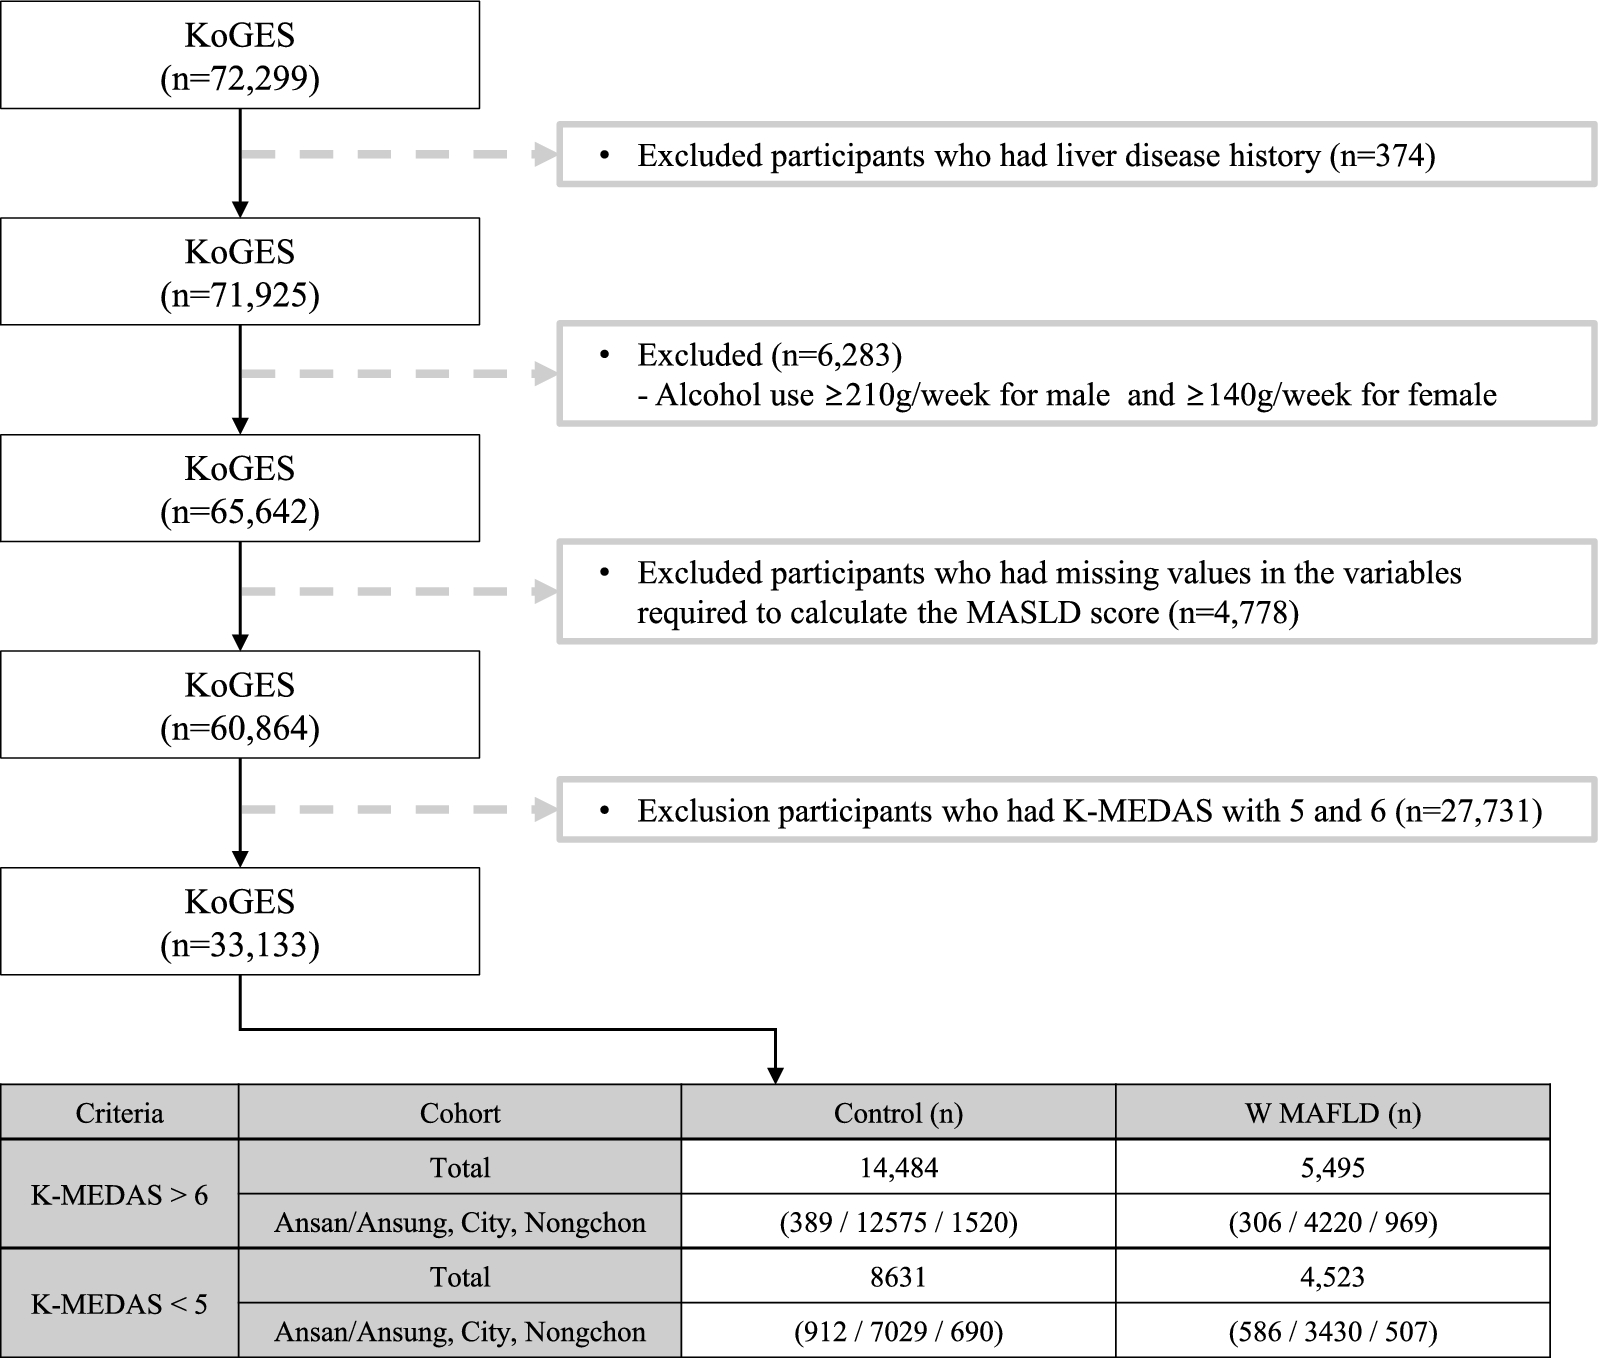
Patients were enrolled on the basis of our previously established inclusion criteria [15, 31] as follows: clinical and colonoscopic confirmation of active UC diagnosis; a Mayo score of ≥ 3; a Mayo endoscopic score of ≥ 2; and either new cases without prior treatment or patients resistant or intolerant to current treatments (including 5-aminosalicylic acid, corticosteroids, immunosuppressants, and biologics). Once exposed to antibiotics, probiotics, or other drugs that affect the gut microbiota, a washout period of at least 1 week was required. All participants signed informed consent. Exclusion criteria comprised patients on long-term prokinetic therapy for diarrhea, those with a history of colectomy or other intestinal surgeries, those with concurrent C. difficile or other intestinal pathogen infections, those with severe congenital or acquired immunodeficiency diseases, and those with other severe progressive diseases requiring hospitalization for reasons other than UC. Pregnant or lactating women were also excluded. This study was approved by the Ethics Committee of the PLA General Hospital (S2016-129–01, S2016-130–01), and the Clinical Trial Registry number was ChiCTR-ONH-17012572.
Demographic data concerning the enrolled patients included age, sex, body mass index (BMI), age at disease onset, and disease duration. Disease extent was classified using the Montreal classification [32], and disease activity was assessed on the basis of the Mayo score [33].
Donor selection and fecal suspension preparation
Based on our previous criteria [15, 31], eligible donors underwent preliminary screening using a questionnaire and laboratory tests. The questionnaire assessed the medical history and lifestyle of the donors, excluding any exposure to infectious pathogens or risky behaviors (such as sexual practices). Donors were serologically screened for the following viruses: HIV; hepatitis A, B, C, and E; syphilis; the Epstein–Barr virus; cytomegalovirus; and rotavirus. Fecal samples were collected to detect intestinal pathogens, including E. coli O157, Salmonella, Shigella, Staphylococcus aureus, Campylobacter, Yersinia, Vibrio cholerae, Vibrio parahaemolyticus, and Candida albicans, toxins A/B of C. difficile, and parasites. Additional evaluations included physical examinations, electrocardiograms, chest radiography, urea breath tests, and blood tests to rule out gastrointestinal and non-gastrointestinal diseases. All eligible donors tested negative on the assessments. During the donation period, donors did not use antibiotics, probiotics, or other medications affecting the gut microbiota, had no travel history, and were re-evaluated every three months. Informed consent was obtained from all of the donors.
On the treatment day, donors provided 100–200 g of fresh feces in a sterile container, which was promptly delivered to the laboratory within 1 h. The fecal sample was mixed with 500 mL of sterile saline to produce 300 mL of filtered fecal suspension, which was immediately transferred to the endoscopy center for use. FMT was administered via colonoscopy. The intestines were prepared using 2 L of a bowel-cleansing agent (poly-ethylene glycol electrolyte solution) before treatment. An endoscopic spray tube (AF-2416 PB; Olympus, Japan) was inserted into the ileum through the working channel of the colonoscope, and a total 300 mL of fecal suspension was injected into the spray tube while slowly retracting the scope. After transplantation, patients were advised to rest in bed for at least 45–60 min.
Measures and outcomes
At three time points (F0, F1, and F2), patients’ clinical symptoms, laboratory parameters, Mayo scores, and endoscopic Mayo scores were recorded. The primary end-points of this study included clinical response, clinical remission, and endoscopic remission.
Clinical response was defined as a decrease in the Mayo score by at least 3 points and at least 30%, along with a decrease in the rectal bleeding sub-score by at least 1 point or a rectal bleeding sub-score of 0 or 1 [34]. Clinical remission was defined as a total Mayo score of ≤ 2 with no individual sub-score > 1. Endoscopic remission was defined as an endoscopic sub-score of 0 or 1 [34]. Consistent with our primary research [15, 31], patients with UC were categorized into clinical response and non-response groups.
Sample collection and DNA extraction
Fresh fecal samples from patients were collected at three time points (F0, F1, and F2) and stored in 2.0 mL cryovials. We also randomly selected donors’ feces at a certain timepoint. If DNA extraction was not to be immediately performed, all samples were preserved at − 80 °C. DNA was extracted from the fecal samples using the TIANamp Stool DNA Kit (TIANGEN, Beijing, China), following the manufacturer’s instructions. DNA concentration was measured using a NanoDrop One spectrophotometer (Thermo Fisher, Waltham, MA, USA). DNA samples were stored at − 80 °C for subsequent analysis.
Metagenomic sequencing
DNA extract was fragmented to an average size of about 400 bp using Covaris M220 (Gene Company Limited, China) for paired-end library construction. Paired-end library was constructed using NEXTFLEX Rapid DNA-Seq (Bioo Scientific, Austin, TX, USA). Paired-end sequencing was performed on Illumina NovaSeq ™ X Plus (Illumina Inc., San Diego, CA, USA) at Majorbio Bio-Pharm Technology Co., Ltd. (Shanghai, China) using NovaSeq X Series 25B Reagent Kit according to the manufacturer’ s instructions (www.illumina.com).
The data were analyzed on the free online platform of Majorbio Cloud Platform (www.majorbio.com). Briefly, the raw sequencing reads were trimmed of adapters, and low-quality reads (length < 50 bp or with a quality value < 20 or having N bases) were removed by fastp (https://github.com/OpenGene/fastp, version 0.20.0). Reads were aligned to the human genome by BWA (http://bio-bwa.sourceforge.net. Version 0.7.17) and any hit associated with the reads and their mated reads were removed. The quality-filtered data were assembled using MEGAHIT (https://github.com/voutcn/megahit, version 1.1.2). Contigs with a length ≥ 300 bp were selected as the final assembling result. A non-redundant gene catalog was constructed using CD-HIT (http://weizhongli-lab.org /cd-hit/, version 4.7) with 90% sequence identity and 90% coverage. Gene abundance for a certain sample was eatimated by SOAPaligner (https://github.com/ShujiaHuang/SOAPaligner, version soap2.21release) with 95% identity.
The best-hit taxonomy of non-redundant genes was obtained by aligning them against the NCBI NR database by DIAMOND (http://ab.inf.uni-tuebingen.de/software/diamond/, version 2.0.13), and using VFDB core database to obtain annotation information of VFs.
Quantitative real-time polymerase chain reaction (qPCR)
The reference plasmid used in this study was a recombinant E. coli plasmid containing the iroB and iroN genes (BGI Tech Solutions, Beijing, China). Plasmid DNA served as a positive control for the salmochelin genes. The standard bacterial strain Shigella flexneri (ATCC 12022) was acquired from BIOBW Biotechnology (Beijing, China). Genomic DNA was used as a positive control for the enterobactin and aerobactin genes. The genomic DNA of the E. coli LF82 strain was used as a positive control for yersiniabactin genes.
Genomic DNA was extracted from the bacterial strains using the MiniBEST Bacterial Genome DNA Extraction Kit Ver. 3.0 (TaKaRa, Japan). Plasmid DNA extraction was performed using the Fast Plasmid Mini Kit (StarPrep, Beijing, China). Gene sequences for the eight genes were retrieved from the GenBank database, and primers were designed using Primer3Plus software (https://www.primer3plus.com/). Primer specificity was confirmed using the BLAST database (http://www.ncbi.nlm.nih.gov/BLAST). The primers were synthesized using BGI Tech Solutions (Beijing LIUHE) Co., Ltd. Detailed primer information is provided in Additional file 1: Table S1.
All qPCRs were performed using the StepOnePlus system. The 20 µL-qPCR mixture consisted of 10 µL of 2 × TB Green Premix Ex Taq, 0.8 µL of primers, 0.4 µL of ROX, 2 µL of DNA, and 6 µL of ddH2O. The thermal cycling conditions were set as follows: (i) 95 °C for 30 s and (ii) 95 °C for 5 s, 60 °C for 30 s, and 72 °C for 1 min, for 40 cycles. Each sample was analyzed in triplicate to ensure quality and reproducibility. Negative controls were reactions without DNA. Standard curves for different qPCR assays were generated using tenfold serial dilutions of genomic DNA from reference strains. All standard curves had an R2 > 0.99, and the amplification efficiencies were between 90 and 110% (Additional file 1: Fig. S1). Positive samples with Ct values < 10 were diluted to achieve Ct values between 10 and 35. The copy number was calculated using the following formula: copies/ng = (ng × 6.023 × 10⁻²³)/(template length × 660), assuming a template length equal to the E. coli genome base number (4700 kb). qPCR results with Ct values > 35 or those that were Ct negative were considered 0 copies/ng.
Statistical analysis
Categorical data are presented as numbers and percentages. Continuous data with a non-normal distribution are expressed as medians and interquartile ranges, whereas those with a normal distribution are presented as averages and standard deviations. Statistical analyses were conducted using SPSS v21.0 software (SPSS, Chicago, IL, United States). Categorical data were analyzed using chi-square or Fisher’s exact tests. Continuous data were evaluated using a Mann–Whitney U test and Pearson correlation analysis, whereas paired data were tested using a Wilcoxon rank-sum test. Receiver operating characteristic curves were plotted, and the area under the curve was calculated. Statistical significance was set at P < 0.05.
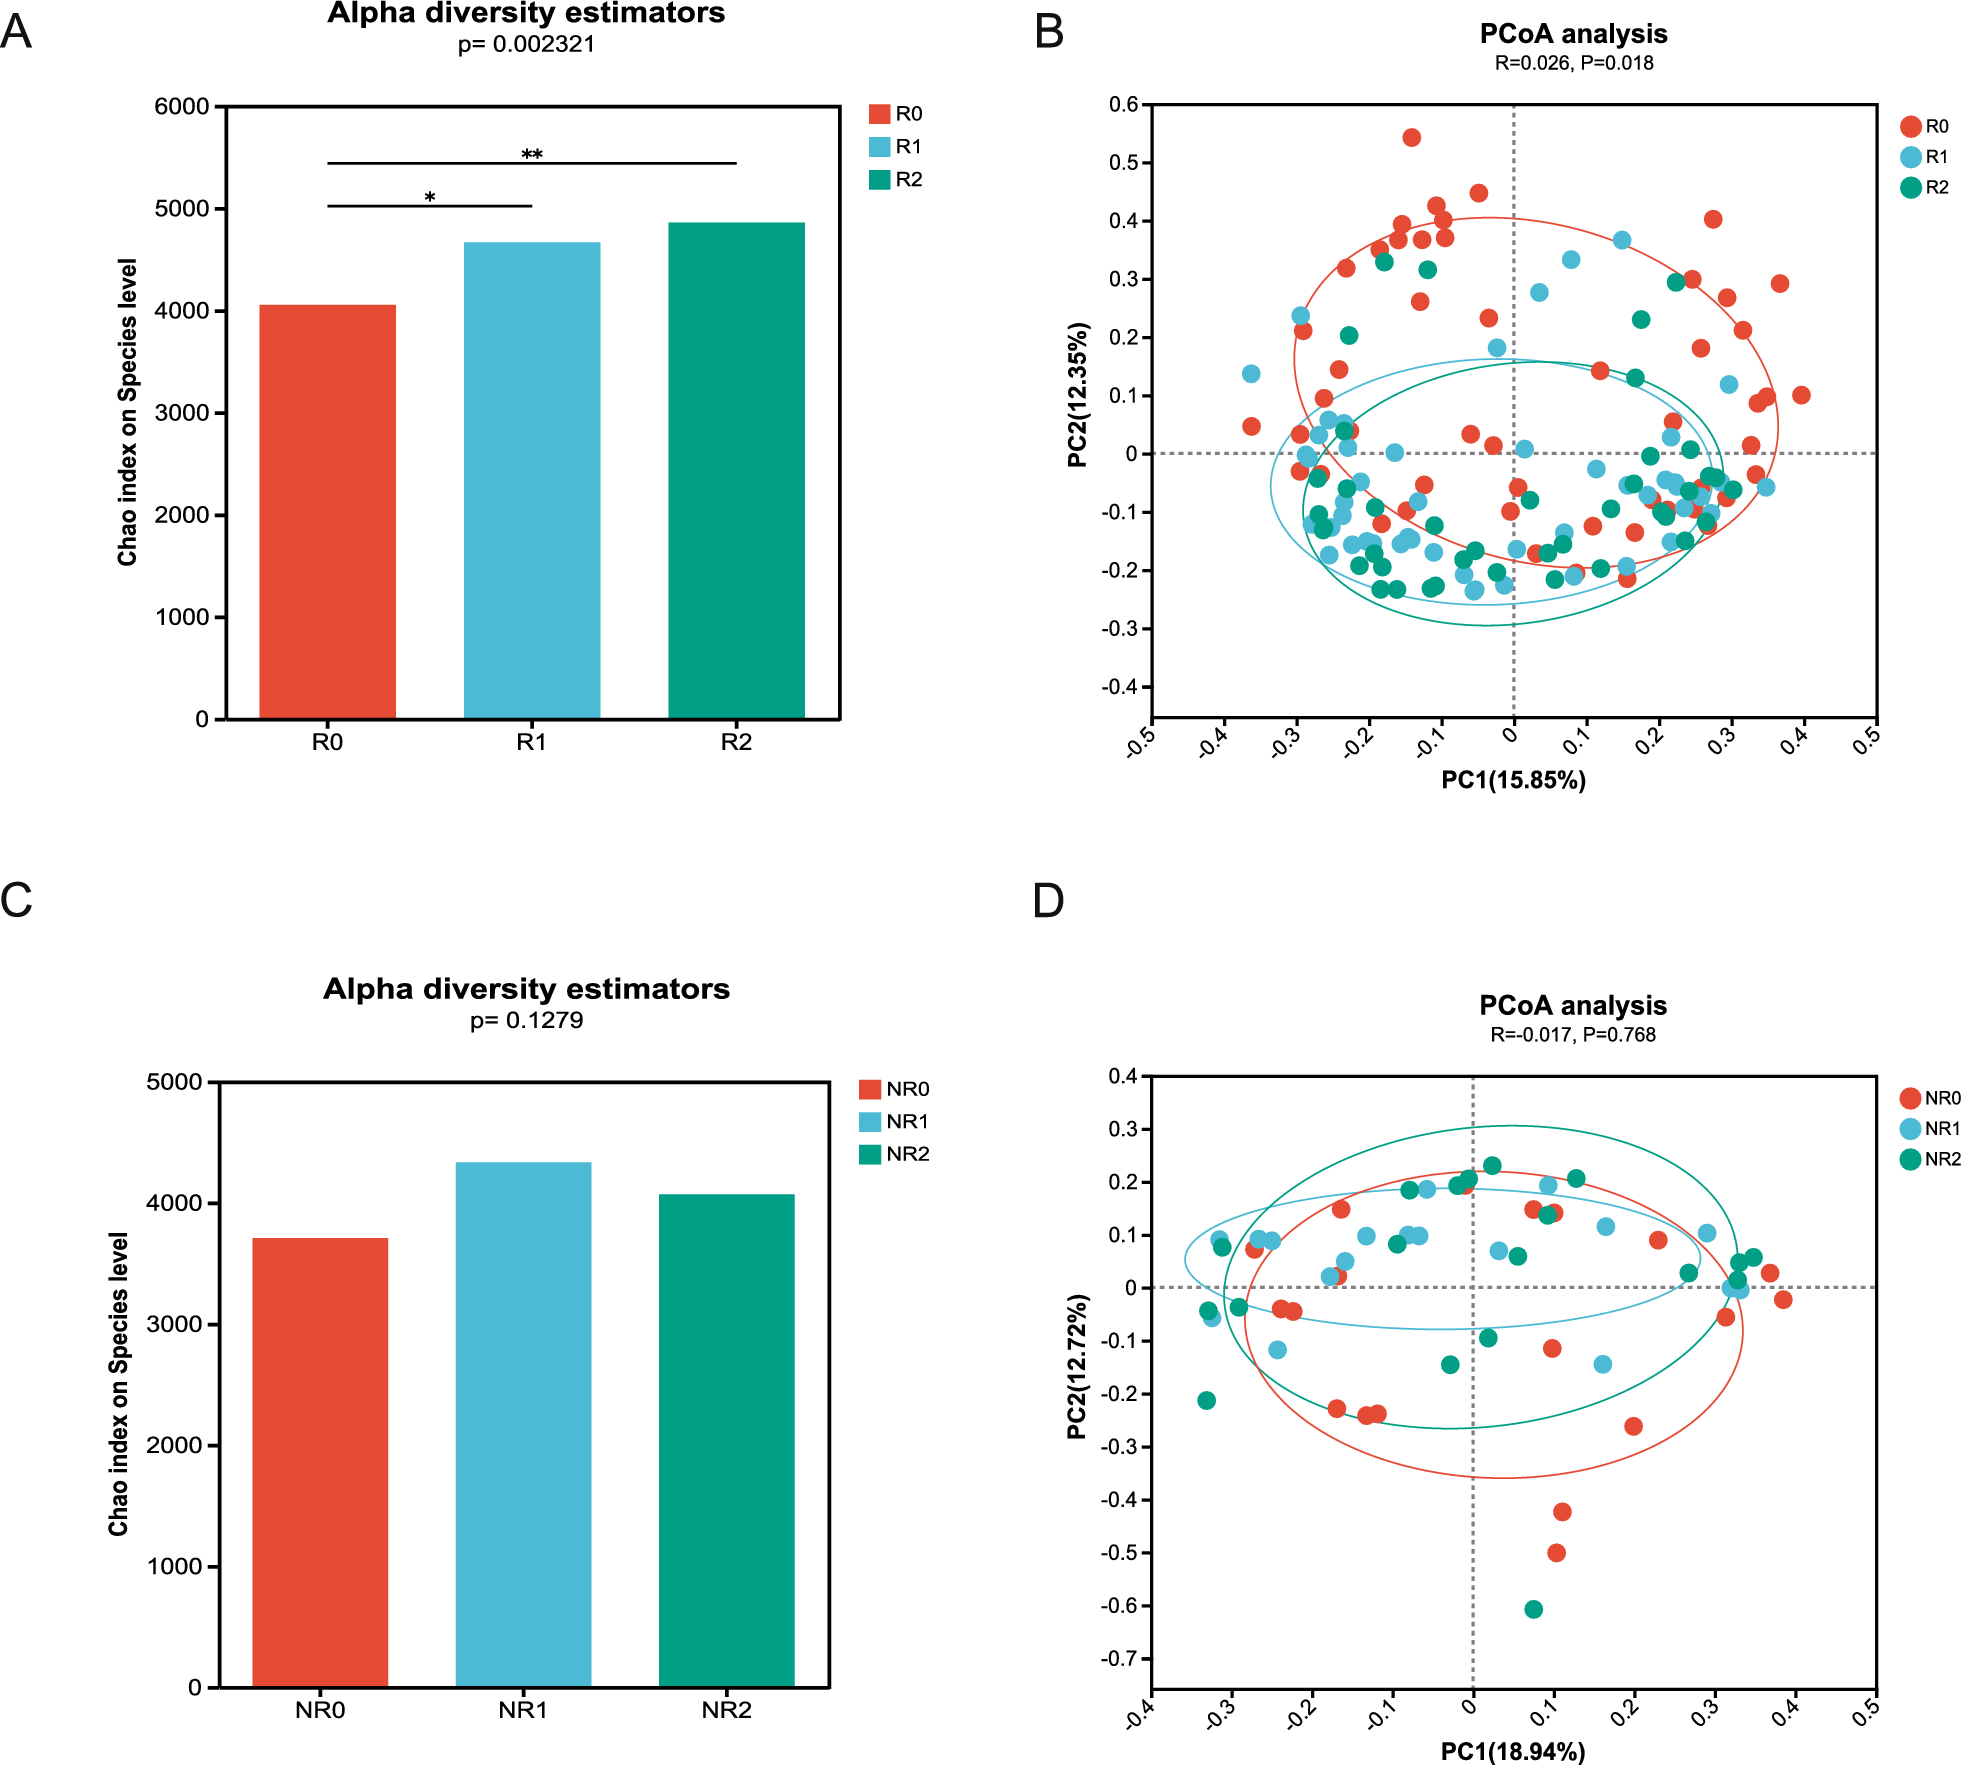
Alpha diversity was quantified at the operational taxonomic units (OTU) level using the Chao1 index, testing for significant differences with analysis of variance (ANOVA) followed by a Tukey post hoc test. For beta diversity, we performed principal coordinates analysis (PCoA) using Bray–Curtis dissimilarity at the OTU level and determined significant differences among groups using analysis of similarities (ANOSIM). A Wilcoxon rank-sum test was used to determine differences in microbial/functional composition between two groups. Three group-wise comparisons were performed using Kruskal–Wallis testing.
Mappings were created using GraphPad Prism v7.0 (GraphPad Software Inc., CA, United States) and Adobe Illustrator CC 22.0 (Adobe, San Jose, CA, United States) software, and created in the cloud platform of Majorbio Bio-Pharm Technology Co. Ltd.


留言 (0)