In the present study, we have discovered that the CCAAT box associated with the MHC class I promoter is a regulator of stable transgenerational gene expression.
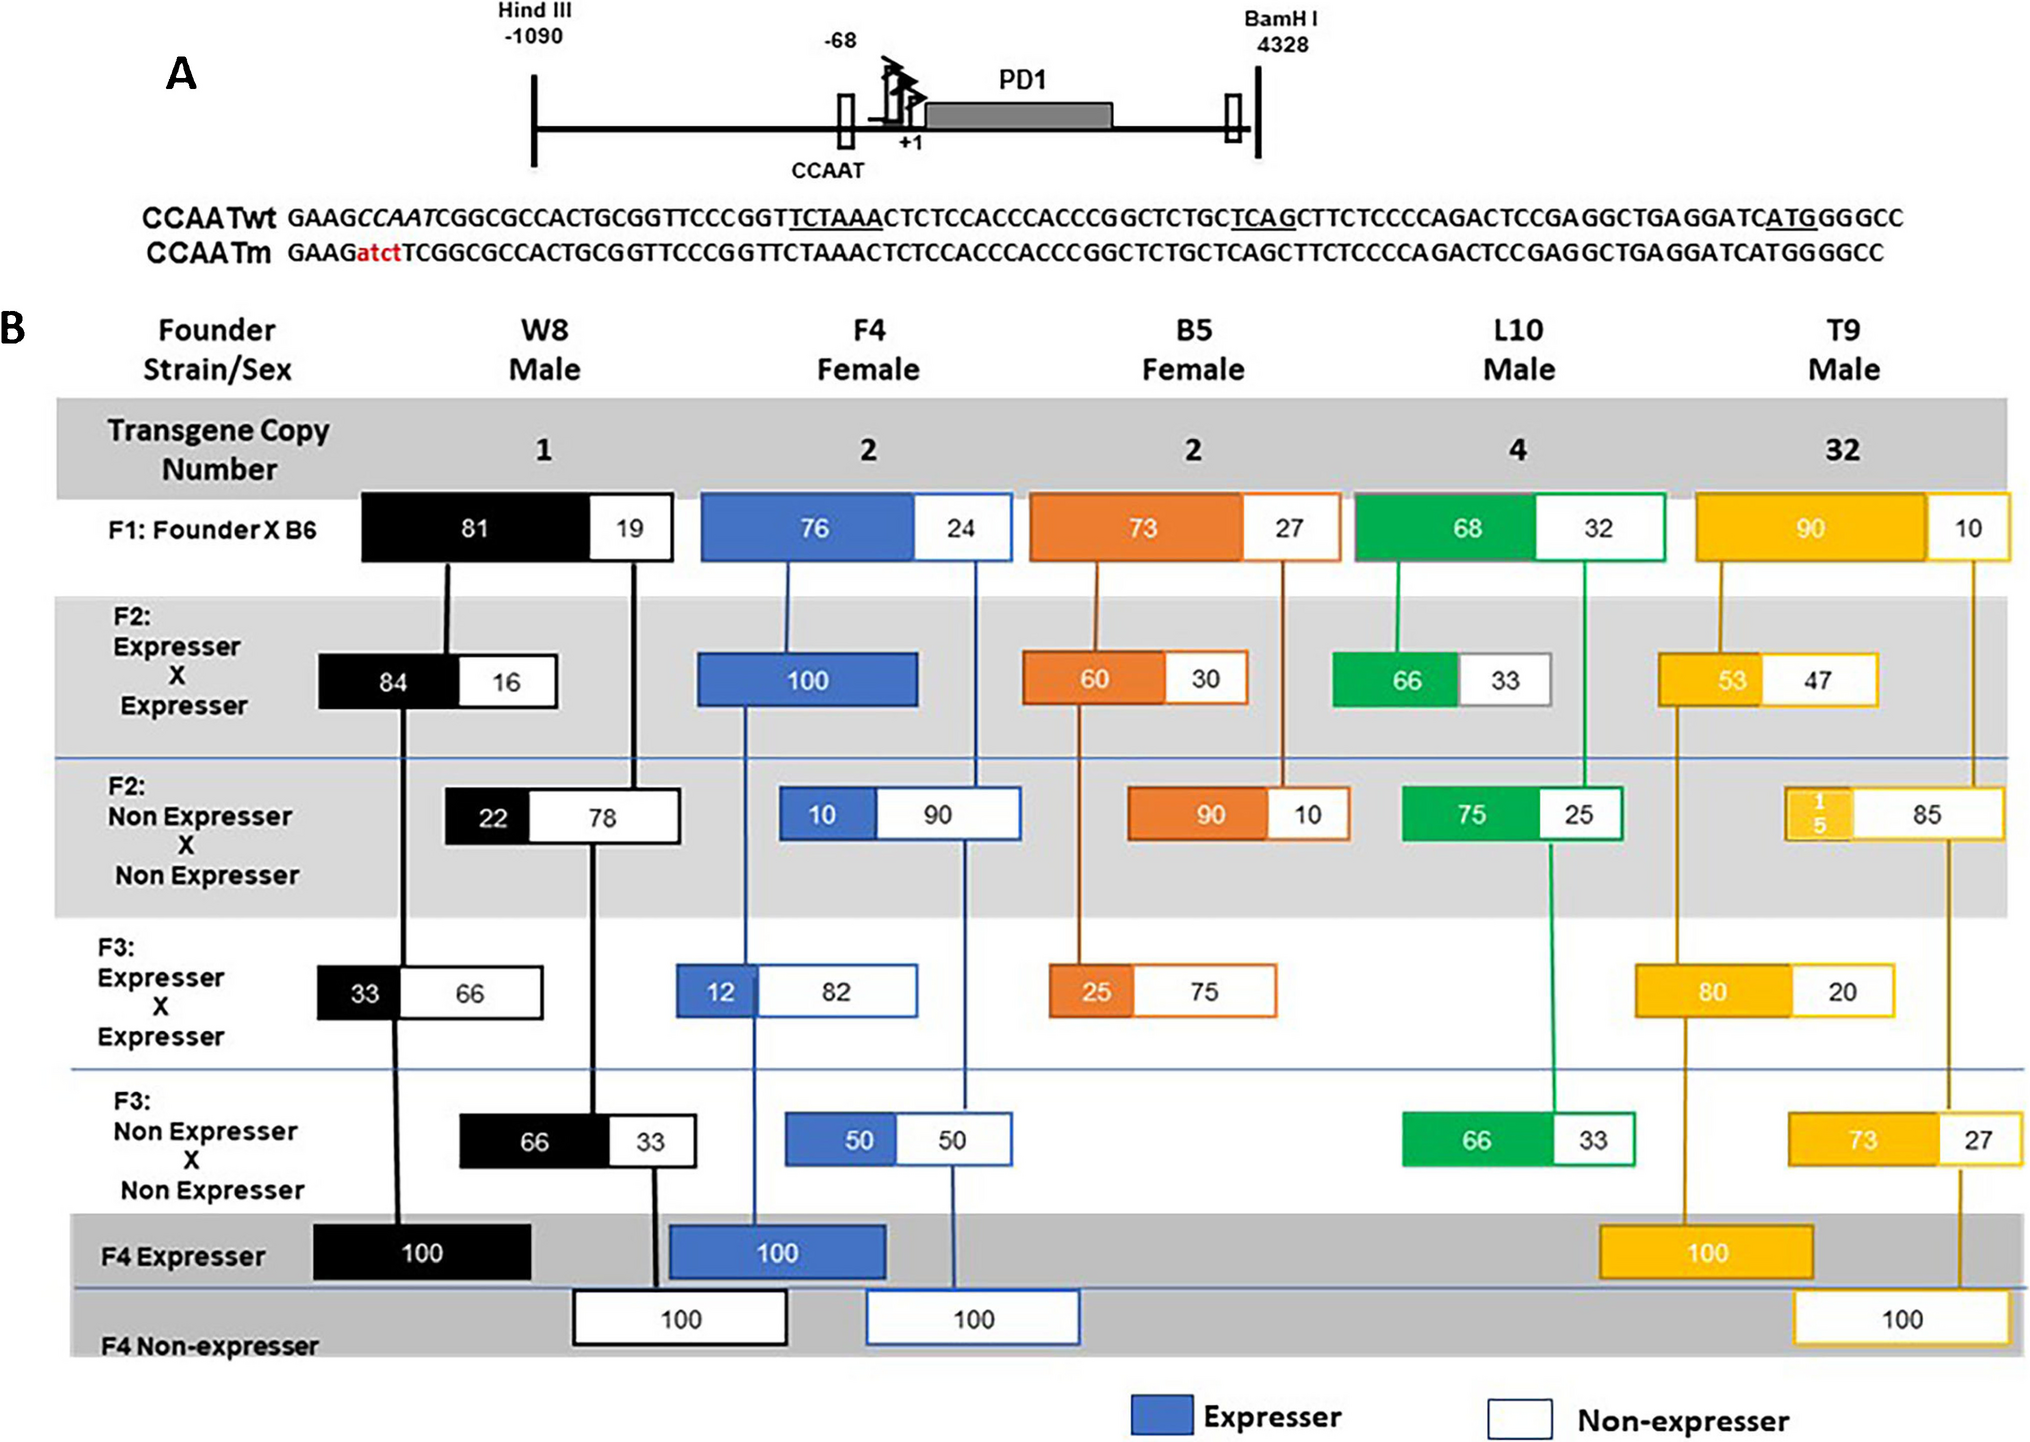
Mutation of the CCAAT box results in the failure of NF-Y binding, aberrant patterns of MHC class I expression and the transgenerational variegation of expression of the MHC class I transgene. Thus, the MHC class I CCAAT box functions as both a regulator of transcription and to maintain stable gene expression across generations. These findings lead to the hypothesis that the CCAAT box is a regulator of transgenerational epigenetic inheritance.
Transgenerational epigenetic inheritance (TEI) is the process by which novel phenotypes are transmitted from one generation to the next through epigenetic, not DNA sequence, changes (Cavalli and Heard 2019; Fitz-James and Cavalli 2022). While it has been widely documented in plants, the number of examples of TEI in mammals is still limited but increasing (Arzate-Mejia and Mansuy 2022). Although the mechanisms underlying TEI are not known, a number of epigenetic associations have been established in both plants and mammals. Among the documented links with epigenetic inheritance are changes in DNA methylation, small RNAs and histone modifications (Cavalli and Heard 2019; Burton and Greer 2022; Fitz-James and Cavalli 2022). Among the CCAAT mutant transgenic mice, MHC class I expression status did not correlate with patterns of DNA methylation across the transgene. Similarly, we observed only minor differences in nucleosomal packaging between expressers and non-expressers. Thus, these two potential mechanisms are not operational for TEI associated with the CCAAT box mutant. In contrast, expression of the transgene did correlate with histone modifications. Namely, the presence of H3K4me3 and total H3 acetylation was associated with the CCAATm expresser transgenic mice, but not the non-expressers.
Given the large-scale epigenetic reprograming in mammals during embryogenesis, other mechanisms—such as non-coding RNAs, 3D genome organization, and transcription factor binding—have been proposed to contribute to mammalian TEI (Fitz-James and Cavalli 2022). Indeed, all three of these features distinguish the CCAATm expresser from the non-expresser. Whereas the CCAATm expresser transgene transcribes promoter-distal non-coding RNA sequences, the CCAATm non-expresser does not. However, whether this is the mechanism determining TEI or a reflection of the ability of Pol II to initiate transcription cannot be distinguished. Significantly, the CCAATm expressers and non-expressers differ both in their 3D genome organization and transcription factor binding. The CCAATm expresser forms a unique 3D loop not found in either the CCAATm non-expresser or the WT transgene. This loop encompasses exon 3, intron 3 and exon 4. The role of this loop in expression of the CCAATm transgene, as well as its precise anchors, remains to be determined. Conversely, CTCF binds to a region in the 5’ distal promoter of the CCAATm non-expresser, but not to the CCAATm expresser. We speculate that CTCF binding to this region acts as a barrier to expression, perhaps by loop formation with the previously-identified 3’ barrier element (Cohen et al. 2009), although we have not been able to detect such a loop to date. Thus, there is a reciprocal relationship between CTCF binding and loop formation that correlates with expression; whether the establishment of one prevents the other remains to be determined. These findings extended previous reports that allele-specific differences in CTCF binding can lead to altered chromatin environment, 3D structure and gene expression (McDaniell et al. 2010). The variegated patterns of PD1 expression that occur in the early CCAATm transgene generations reflect stochastic establishment of either loops or CTCF binding. What leads to a stable, heritable configuration after the early generations remains to be determined.
The present studies suggest that the CCAAT box plays a singular role in the stable expression of the MHC class I gene. Thus, none of the forty-eight transgenic lines generated from either the WT MHC class I gene or other MHC class I promoter mutants (mutants in the TATA box, SP1 BS or Inr) displayed the variegated expression observed in the multiple CCAATm transgenic lines. There is only limited previous evidence for the role of a DNA sequence element in regulating transgenerational inheritance. DNA methylation of CpG islands associated with promoters is prevented by the presence of a promoter-associated Sp1-binding site; whether Sp1 is the responsible transcription factor was not directly demonstrated (Brandeis et al. 1994). In the present study, mutation of the CCAAT box abrogates NF-Y binding, further suggesting that NF-Y plays a critical role in maintaining stable expression. We speculate that the loss of stable transgenerational inheritance of the phenotype upon mutation of the CCAAT box results from loss of NF-Y binding leading to aberrant looping and transcription factor binding. In wild-type animals, NF-Y binding presumably establishes a favorable 3D chromatin structure that results in stable expression of the Class I gene across generations. NF-Y has been shown to contribute to zygotic genome activation and formation of DNase hypersensitive sites at the 2-cell stage (Lu et al. 2016). So, loss of NF-Y binding in CCAAT mutants presumably results in stochastic expression very early in embryogenesis leading to differential expression in littermates. This expression status is maintained throughout the lifespan of the individual but is reprogrammed and reset in subsequent generations.
As Rothi and Greer (Rothi and Greer 2023) pointed out in a recent review, the understanding of TEI now needs to go beyond correlation to causation, about which relatively little is known. Recent studies in C. elegans have begun to track heritable molecules that transmit epigenetic information. In worms, viral infections and starvation result in transgenerational inheritance of small RNAs that influence the transcriptome (Rechavi et al. 2011, 2014). Unlike previous examples of transgenerational inheritance which result from environmental triggers, these studies define a novel mechanism of transgenerational inheritance caused by a discrete mutation within a transcription factor binding site, leading to formation of novel DNA loops. Although the mechanisms underlying the distinct patterns of expression remain to be determined, our demonstration, in multiple independent transgenic lines, that mutation of the CCAAT box results in transgenerational inheritance provides a clear example of causation in mammals.
Material and methods
Mice
C57BL/10 mice homozygous for the MHC class I transgene PD1 (CCAATwt) were generated as described previously (Frels et al. 1985). The CCAATwt transgene contains a 1 Kb regulatory region upstream of the TSS, the entire coding region and 650bp immediately following the polyadenylation site that contains the 3’ boundary element (Cohen et al. 2009). Experiments were performed on CCAATm expresser and non-expresser lines derived from at least two independent founders (Barbash et al. 2013). Peripheral blood lymphocytes (PBL) were analyzed by flow cytometry of cells stained with anti-class I antibody. All animal procedures reported in this study that were performed by NCI-CCR affiliated staff were approved by the NCI Animal Care and Use Committee (ACUC) and in accordance with federal regulatory requirements and standards. All components of the intramural NIH ACU program are accredited by AAALAC International.
IFN treatment
Mice were injected intraperitoneally with 50kU of mouse IFNγ (CalBiochem) or an equal volume of PBS + 0.1%BSA. Tissues were harvested 24 h post-injection. Levels of PD1 and endogenous H2-Kb RNA were assessed by RT real time PCR of RNA extracted from tissues (RT-PCR described below). The experiment was performed twice each with three mice that were analyzed independently.
Flow cytometry
FACS was carried out using antibodies for PD1 surface expression (PT85, VRB) as described before (Ehrlich et al. 1989). FACS results were analyzed using FlowJo (BD).
Immunofluorescence
Immunofluorescence staining was performed according to standard protocol, using the PT85 antibody that was used for FACS staining. Slides were counterstained with DAPI.
Electrophoretic Mobility Shift Assay (EMSA)
NF-Y EMSA was done as described previously (Weissman and Singer 1991) with modifications mentioned below. DNA fragments used in the gel shift assay were the PD1 fragment from 1011–1060 and the corresponding CCAAT mutant fragment (IDT). DNA fragments were end labeled with [32P]ATP using T4-Polynucleotide kinase (NEB). EMSAs were done with 3.6ug of HeLa nuclear extract and 1.5-fmol radiolabeled probe in binding buffer (20mMTris-HCl pH 7.5, 50 mM NaCl, 5 mM MgCl2, 0.5 mM EDTA, 6.5% glycerol, 2.5 mM DTT, and 0.1 mg/ml BSA) (Bernardini et al. 2019) and 2ug poly(dA-dT). Reactions were incubated at 30°C for 30’. For cold competition and antibody supershifts, cell extracts were preincubated with the competitor or antibody for 30 min on ice before addition of radiolabeled probe. Competitor double-stranded oligonucleotides were added at a 1000-fold molar excess. Antibodies used were NF-YA Antibody (G-2): sc-17753, and NF-YB Antibody (G-2): sc-376546 (both from Santacruz). The reactions were loaded on 4% polyacrylamide gels and run in 0.5X TBE at 200 V for 2 h.
MNase hypersensitivity and Nucleosome Occupancy
Nuclei were prepared from spleen cells from CCAATwt and CCAATm expresser and non-expresser mice and used for MNase digestions as described previously (Kotekar et al. 2008). Briefly, 15X10^6 nuclei were digested for 5’ at 37°C with 0, 3U or 5U of micrococcal nuclease in 100ul of MNase digestion buffer with 1mM CaCl2. Nucleosome occupancy was assessed across the PD1 gene (-614, -30, Exon 1 and Exon 5; primers below) by real-time PCR, measured as amplification from 100ng digested DNA (3U MNase) normalized to undigested (0U) DNA.
Additionally, nuclei were digested with high MNase concentrations 50U and 100U for 5’ and 15’ at 37°C to assess accessibility at the PD1 promoter (CCAAT box) by amplifying DNA from the digested soluble chromatin fraction versus the digestion resistant pellet fraction.
REGION
DIR
SEQUENCE
-640
FWD
REV
5’ GGGGCTTTTACATTTCATAGATG
5’ TTTACATTTTACTCTATGGCAAGTCTC
-30
FWD
REV
5’ CTTCTCTCTCCTATTGCGTGTCC
5’ ATGATCCTCAGCCTCGGAGT
Exon 1
FWD
REV
5’ ACTCCGAGGCTGAGGATCA
5’ CCGCAGCGGCCTTGTTC
Exon 5
FWD
REV
5’ CAGACCCTGCTCAGCCCCCCGTCCCCA
5’ ACCTGAGCGCGTCTTCCTCCAGATCACAA
Real-time RT-PCR
RNA was prepared using RNeasy kit (Qiagen) according to manufacturer instructions. Each sample was subjected to DNase treatment on column using RNAse free DNase (Qiagen) per manufacturer’s instructions. cDNA was synthesized using oligo dT or random primers and the Superscript III kit according to manufacturer’s instructions (ThermoFisher). Real time PCR was performed as described (Kotekar et al. 2008) using ABI7900 with SYBR PCR Master Mix (Life technologies). For tissue RNA expression, the calculations used the standard curve method, and normalized to the level of 18S in the tissues. All results reported are the average of 2–3 independent experiments in lines derived from different founders, to exclude possible insertion position effects. Endogenous MHC class I levels were determined the same way using published primers (Landel et al. 1997).
Assessment of upstream transcription
Tissues were harvested from CCAATwt and CCAATm expresser and non-expresser mice and stored at -80 degrees C. RNA was prepared by using TRIzol (Invitrogen/Thermo Fisher Scientific). DNA contamination was eliminated using TURBO™ DNA-free kit (Invitrogen/Thermo Fisher Scientific). The RNA was then used for cDNA preparation using AffinityScript Multiple Temperature cDNA Synthesis Kit (Agilent) with random primers, oligodT primers or gene-specific primers (Integrated DNA Technologies).
Gene-specific cDNA primers used were:
Region
For Sense transcripts
For Antisense transcripts
TSE
5’ CTGTCTGGCTCATGGGAAAAC
5’ ACTGATTCAGGTCCACATTCA
USF
5’ TGGAGCCTGAGACCCTGA
5’ CTCACTAAAAGGTTTGGAAATCGC
Promoter proximal
5’ GGGTGGGTGGAGAGTTT
5’ CCCGTGTCCCCAGTTCACTTCTCCG
cDNAs were then amplified using SYBR green PCR master mix (Applied Biosystems,). Primers used for real time RT-PCR were:
REGION
DIR
SEQUENCE
Exon 2–3
FWD
REV
5’ GGAATGTCAAGGAAACCGCAC
5’ ACATGCTCTGGAGGGTGTGAGAC
TSE
FWD
REV
5’ TGTGCGGGGCTTTTACATTTC
5’ CACTGGAGGTTTATGTCTGCTTCTG
USF
FWD
REV
5’ CACGTGAGGCACTGGAGAC
5’ CCCTGCTGCTCTTCAGAAAGC
Promoter proximal
FWD
REV
5’ CGCAACCTGTGTGGGAC
5’ GGGAACCGCAGTGGC
Primers for 18S RNA (AM1716, Ambion/Applied Biosystems) were used for amplifying the internal control. Results were normalized for 18S and copy number.
NF-Y siRNA treatment and effect on PD1 expression
93B2 cells (Mouse L-cells stably transfected with the PD1 gene) were cultured for 24-h in 12-well plates and then transfected in duplicate with NF-Y siRNA (Mm_Nfya_3 FlexiTube siRNA, or Mm_Nfya_2 FlexiTube siRNA, or Mm_Nfyb_4 FlexiTube siRNA; Qiagen) using Lipofectamine RNAiMax Reagent (Thermofisher). GAPDH siRNA (Silencer™ Select GAPDH Positive Control siRNA; Thermofisher) and a non-targeting siRNA pool (ON-TARGETplus Non-targeting Control Pool; Horizon/Perkin Elmer) were used as controls.
The cells were harvested at 24, 48 and 72 h. RNA was extracted using RNAeasy plus mini kit. cDNA was prepared using AffinityScript Multiple Temperature cDNA Synthesis Kit (Agilent) with random primers and amplified using SYBR green PCR master mix (Applied Biosystems, Foster City, CA).
siRNA knockdown was confirmed by RT-PCR using NF-YA, NF-YB and GAPDH primers, and effect of NF-Y knockdown on PD1 expression was assessed by RT-PCR using PD1 primers. Primers for 18S RNA (AM1716, Ambion/Applied Biosystems) were used for amplifying the internal control.
Primers used for real time RT-PCR were:
Primers for:
DIR
SEQUENCE
NF-YA
FWD
REV
5’ GGCACAATTCTCCAGCAAG
5’ GGCTCCTGTCTGAACGATCT
NF-YB
FWD
REV
5’ AGGGCTGCATTGGAGGTTAAAA
5’ TCCTCAGTATCATCATGGGGC
GAPDH
FWD
REV
5’ TGTGTCCGTCGTGGATCTGA
5’ CCTGCTTCACCACCTTCTTGA
PD1
FWD
REV
5’ GGAATGTCAAGGAAACCGCAC
5’ ACATGCTCTGGAGGGTGTGAGAC
Chromatin Immunoprecipitation (ChIP)
Spleens from 2 transgenic mice were pooled for each experiment. The lysis of the tissues was performed by the MAGNA ChIP Kit for tissues (Millipore). ChIPs were performed according to manufacturer instructions. All experiments were repeated 3 times. Antibodies used: anti Pol-II (Active Motif, Santa Cruz), anti NF-YB (Santa Cruz Biotechnology), anti AcH3 (Abcam), anti Smc1 (Millipore), anti CTCF (Millipore, Santa Cruz), anti H3K4me3, H3K9me3 (Upstate).
Quantitation of ChIP results
DNA immunoprecipitated in ChIP reactions was analyzed by real time PCR using the primers described below. (Real-time PCR, rather than ChIP-seq, was used since the analyses focused a transgene.) Quantitative real-time PCR was performed using ABI7900 with SYBR green real time PCR kit (Applied Biosystems). Results were calculated as percentage bound/total input DNA, relative to IgG control.
Region
DIR
SEQUENCE
-1018
FWD
REV
5’ TCCTAATTACCATTCTTCAATCCA
5’ GCTCACAGAATGATTTTCCTTG
-918
FWD
REV
5’ CAAGGAAAATCATTCTGTGAGC
5’ GTAAGAGTTTTAAGACCGAATACATTG
-700
FWD
REV
5’ ACTGATTCAGGTCCACATTCA
5’ GAGTCCTTTTGGTGGCTGACATC
-640
FWD
REV
5’ TGTGCGGGGCTTTTACATTTC
5 ‘ CACTGGAGGTTTATGTCTGCTTCTG
-614
FWD
REV
5’ GGGGCTTTTACATTTCATAGATG
5’ TTTACATTTTACTCTATGGCAAGTCTC
-450
FWD
REV
5’ CATATGAAATGCATGG
5’ CGTCAGTGGATATTTTCTATACTAG
-400
FWD
REV
5’ CTAGTATAGAAAATATCCACTGACG
5’ CCTACAGTTTTACAAATTAGTGAAGACC
-368
FWD
REV
5’ CTAGTATAGAAAATATCCACTGACGTATCAACACA
5’ GATTTCCAAACCTTTTAGTGAGAATA
-300
FWD
REV
5’ CTCACTAAAAGGTTTGGAAATCGC
5’ CCCTGCTGCTCTTCAGAAAGC
-150
FWD
REV
5’ TCAGGGTCTCAGGCTCCA
5’ GGACACGCAATAGGAGAGAGAAG
-75
FWD
REV
5’ CGCAACCTGTGTGGGAC
5’ GGGTGGGTGGAGAGTTT
-30
FWD
REV
5’ CTTCTCTCTCCTATTGCGTGTCC
5’ ATGATCCTCAGCCTCGGAGT
EXON 1
FWD
REV
5’ ACTCCGAGGCTGAGGATCA
5’ CCGCAGCGGCCTTGTTC
EXON 2
FWD
REV
5’ GTCCCCACTCCCTGAGCTATTTCTACA
5’ CCACTCCGTAAGTCTGTGCGGTTT
EXON 5
FWD
REV
5’ CAGACCCTGCTCAGCCCCCCGTCCCCA
5’ ACCTGAGCGCGTCTTCCTCCAGATCACAA
3’UTR
FWD
REV
5’ TGAGAACCTTCCAGAATCCACAT
5’ TCCGTGAAGGGACAAGGACAA
Spleen Chromosome conformation capture 3C Analysis
3C analysis was performed as described (Splinter et al. 2004; Cope and Fraser 2009), using Nla III [NEB special order] as the restriction enzyme. Single cell suspensions of ACK treated spleen cells were crosslinked at RT for 5 min with 1% formaldehyde in HBSS/2%FBS, then quenched with glycine to 0.125M for 15min on ice. Washed crosslinked cells were lysed by swelling cold and harvested by rapid centrifugation to obtain nuclei. 2 × 10⁷ cell equivalents were used for each experimental point. 4000 Units of NlaIII [custom concentration 50,000Units/ml] was added and samples were incubated rotating overnight at 37°C. The following morning, enzyme was inactivated with SDS and ligations [T4 DNA ligase, NEB] of varied concentrations were set up for 4 h at 16°C. Samples were RNAse treated, phenol and IAC extracted, and precipitated. PCRs were performed to determine ligated sites. Non-digested, and digested non-ligated samples were used as controls. PCR analysis of 3C experiments were performed using primers in table below.
Enzyme sites
DIR
SEQUENCE
-689/ + 3434
Enh-Sil/3’UTR
FWD
REV
5’ TCCTAATTACCATTCTTCAATCCA
5’ TGGATTCTGGAAGGTTCTCAATC
-689/ + 3434
Enh-Sil/Exon3
FWD
REV
5’ TTGTGATCTGGAGGAAGACGCGCTCAGGT
5’ CACTGGAGGTTTATGTCTGCTTCTG
-593/ + 1049
Enh-Sil/Exon3
FWD
REV
5’ GGAATGTCAAGGAAACCGCAC
5’ GCGATTTCCAAACCTTTTAGTGA
-488/ + 929
-488/Exon3
FWD
REV
5’ GGAATGTCAAGGAAACCGCAC
5’ GCGATTTCCAAACCTTTTAGTGA
+ 35/ + 3040
Exon1/Intron7
FWD
REV
5’ CTTCTCTCTCCTATTGCGTGTCC
5’ TGGATTCTGGAAGGTTCTCAATC
+ 1049/ + 2027
Exon3/Exon4
FWD
REV
5’ GGAATGTCAAGGAAACCGCAC
5’ TGGGGACGGGGGGCTGAGCAGGGTCTG
+ 2036/ + 2689
Exon4/Intron5
FWD
REV
5’ TTGTGATCTGGAGGAAGACGCGCTCAGGT
5’ TGGGGACGGGGGGCTGAGCAGGGTCTG
+ 2717/ + 3302
Intron5/3’UTR
FWD
REV
5’ TTGTGATCTGGAGGAAGACGCGCTCAGGT
5’ TGGATTCTGGAAGGTTCTCAATC
Methylation assay
Methylation of genomic DNA was examined using methylation sensitive enzymes Aci 1 or Tai 1. 2 ugms of genomic DNA from spleens of CCAATwt and CCAATm mutant mice, were digested with 20 units of either enzyme overnight. PCRs were then performed using oligos flanking the enzymatic sites on the digested DNA and compared to undigested.
Enzyme sites
DIR
SEQUENCE OF FLANKING OLIGOS
Aci 1
-208, -197
FWD
REV
5’ TCAGGGTCTCAGGCTCCA
5’ GGACACGCAATAGGAGAGAGAAG
-41
FWD
REV
5’ CTTCTCTCTCCTATTGCGTGTCC
5’ ATGATCCTCAGCCTCGGAGT
+ 92, + 145
FWD
REV
5’ GTCCCCACTCCCTGAGCTATTTCTACA
5’ CCACTCCGTAAGTCTGTGCGGTTT
+ 402 to + 602
FWD
REV
5’ CGCAACCTGTGTGGGAC
5’ CCGCAGCGGCCTTGTTC
+ 3335
FWD
REV
5’ TCTGTGTTCCTATGAGCATCCT
5’ TGGATTCTGGAAGGTTCTCAATC
Tai 1
-414, -309
FWD
REV
5’ GCTGAGAACCTGGTCCCCAACTGGAAGAAT
5’ CCCTGCTGCTCTTCAGAAAGC
+ 493
FWD
REV
5’ GTCCCCACTCCCTGAGCTATTTCTACA
5’ CCACTCCGTAAGTCTGTGCGGTTT
+ 2393, + 2439
FWD
REV
5’ TTGTGATCTGGAGGAAGACGCGCTCAGGT
5’ GCTGAGAACCTGGTCCCCAACTGGAAGAAT
+ 3268
FWD
REV
5’ TCTGTGTTCCTATGAGCATCCT
5’ TGGATTCTGGAAGGTTCTCAATC


留言 (0)