Characteristics of participants according to tripartite of TWA LDL-C
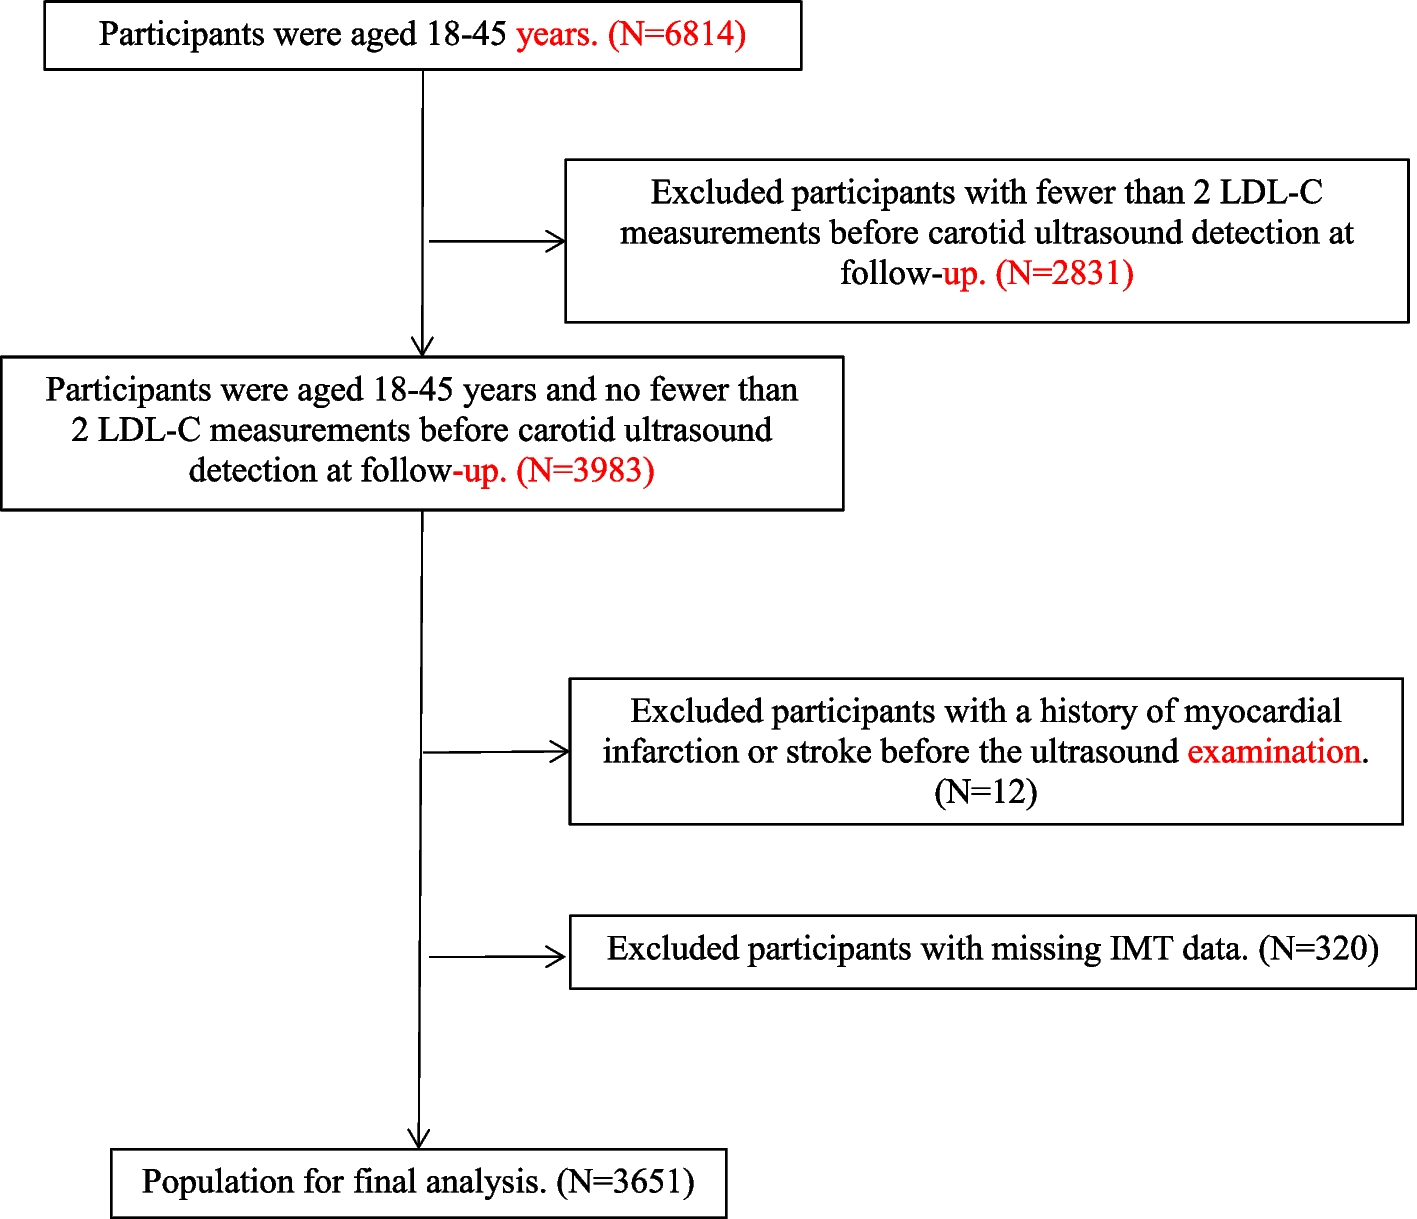
Among the 3 651 subjects included in the analysis, the mean age was 37 ± 5 years, the mean number of LDL-C measurements was 4 ± 1 times, and the cumulative LDL-C exposure time was 6.3 ± 2.6 years. From T1 to T3, the proportion of men, smokers, obese individuals, individuals with high Hs-CRP levels, hypertension, diabetes, and those taking antihypertensive drugs, as well as the levels of triglyceride and IMT gradually increased. Conversely, the proportion of individuals with normal BMI and high density lipoprotein (HDL-C) levels gradually decrease. The age of T3 group was higher than that of T1 and T2 groups. The proportion of university degree or above in T3 group was lower than that in T1 and T2 group. The proportion of alcohol consumption in the T1 group was higher than that in the other two groups. The differences between the above groups were statistically significant (Table 1).
Table 1 Characteristics of participants according to tripartite of time-weighted cumulative LDL-CCarotid IMT of participants according to tripartite of TWA LDL-C
The average carotid IMT in the observation population was 0.68 ± 0.15 mm, among which 118 cases (3.2%) exhibited thickening. Both IMT thickness and the proportion of IMT thickening population showed an increasing trend, and the differences between groups were statistically significant (Table 2).
Table 2 IMT date of participants according to tripartite of time-weighted cumulative LDL-CLinear regression analysis of TWA LDL-C and IMT
Linear regression was used to analyze the correlation between TWA LDL-C and IMT in individuals 18–45 years of age. IMT was used as the dependent variable and TWA as the independent variable in the linear regression model. Model 1 involved a single factor analysis, and model 2 corrected for age and sex. Model 3 was adjusted for education level, body mass index, smoking, alcohol consumption, diabetes, hypertension, HDL-C, triglyceride and Hs-CRP on the basis of model 2. Model 4 added adjustments for the use of antihypertensive drugs and lipid-lowering drugs to model 3, the adjustment of was added. After adjusting for possible influencing factors, the results showed that TWA LDL-C was positively correlated with IMT, with IMT increasing by 0.017 mm for every 1 mmol/L year increase in TWA LDL-C (P < 0.05) (Table 3).
Table 3 Linear regression analysis of weighted average cumulative exposure time of LDL-C and IMTLogistic regression analysis of the influence of TWA LDL-C on IMT thickening
Logistic regression was used to analyze the effects of different TWA groups on IMT thickening in people 18–45 years old. The thickening of IMT (0 = no, 1 = yes) was used as the dependent variable, while the TWA LDL-C group was used as the independent variable. Model 1 was a single factor analysis, and model 2 corrected for age and sex. Model 3 adjusted for education level, body mass index, smoking, alcohol consumption, diabetes, hypertension, HDL-C, triglyceride and Hs-CRP on the basis of model 2. Model 4 added further adjustments for the use of adjustment of taking antihypertensive drugs and lipid-lowering drugs to model 3. Following the adjustments for possible influencing factors, the results showed that high TWA LDL-C was a risk factor for IMT thickening (P < 0.05), with OR values of 1.812(1.027 ~ 3.200) in the T3 group (Table 4).
Table 4 Logistic regression analysis of the effect of TWA LDL-C on IMT thickeningSensitivity analysis of the effect of TWA LDL-C on IMT thickening
The thickening of IMT (0 = no, 1 = yes) was used as the dependent variable, and the TWA LDL-C group was used as the independent variable. The data of the patients who took antihypertensive drugs and lipid-lowering drugs (206 cases) were excluded. After adjusting for age, sex, education level, body mass index, smoking, drinking, diabetes, hypertension, HDL-C, triglyceride, and Hs-CRP. The results showed that the T3 group, with the highest TWA LDL-C, the OR value for IMT thickening is 1.850(0.988–3.464) (P = 0.055). The P for trend is 0.043 (Table 5).
Table 5 Sensitivity analysis of TWA LDL-C on IMT increase (n = 3445) 

留言 (0)