
記住我

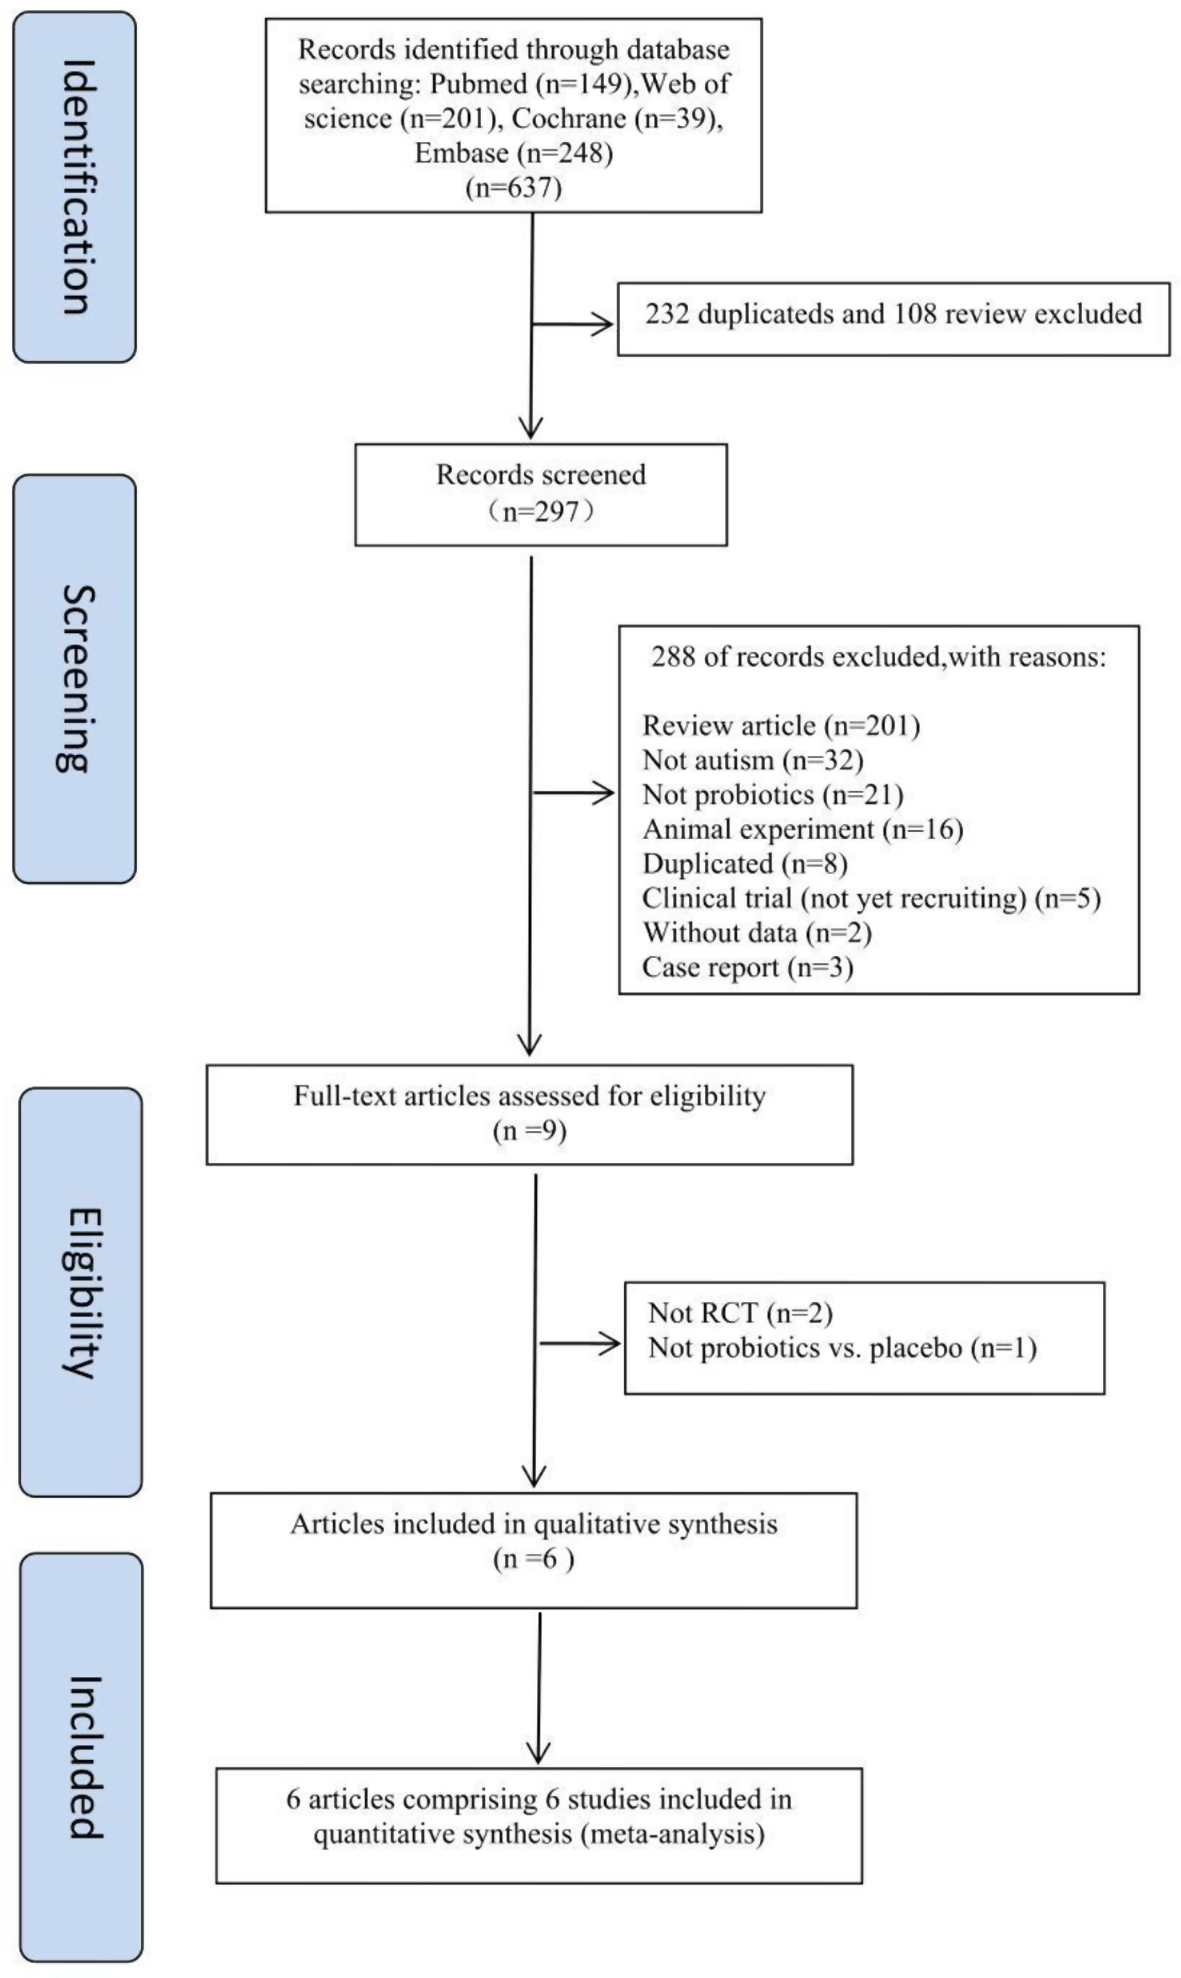
In the study period (June 2015-May 2019) there were 67,746 overall hospitalizations, of which 40.1% were in Group 1 (RSV-coded), and 59.9% in Group 2 (not RSV-coded). As Fig. 1 shows, the trend of hospitalizations increased for Group 1 from season 1 to season 4 (+ 28.8%), while the number of hospitalizations for Group 2 was stable through the years.
Fig. 1
Trend of hospitalizations in Italy
As for hospitalization rate, we can observe a higher increase for Group 1 (+ 42.4%) than for Group 2 (+ 11.4%) (Fig. 2).
Fig. 2
Trend of hospitalization rate in Italy
In Fig. 3 we analysed the monthly trend for all seasons. The peak seasonality for both groups was between January and February, and in the remaining months Group 2 had a higher hospitalization rate than Group 1. Comparing season 1 and season 4, we noticed that Group 1 surpassed Group 2 in hospitalization rate during the peak.
Fig. 3
Monthly hospitalization rate per 10,000 infants from season 1 to season 4
Furthermore, we analyzed hospitalization rates by geographical area (North West, North East, Centre, South and major Islands). In Group 1, we noticed an increase in hospitalization rate for every area, with some variations between seasons. In particular, from season 1 to season 4 the North East had the highest increase (+ 50.7%), followed by South and major Islands (+ 47.9%), North West (+ 40.0%), and Centre (+ 32.9%). Conversely, in Group 2 we observed a smaller increase: North West (+ 14.7%), North East (+ 9.2%), Centre (+ 12.9%), South and major Islands (+ 10.0%) (Fig. 4).
Fig. 4
Hospitalization rate per 10,000 infants by geographical area: Group 1 (RSV-coded) and Group 2 (not RSV-coded)
As for in-hospital mortality, we recorded 19 total deaths out of 67,746 hospitalizations in the study period. The mortality rate in the four seasons ranged from 0.13 to 0.33/1,000 per year in Group 1 and from 0.19 to 0.40/1,000 per year in Group 2. Out of 7 deaths in Group 1, 2 deaths were not caused by RSV: one infant suffered from heart disease, and another had cardiac arrest. Instead, out of 12 deaths occurred in Group 2, 9 were not retained to be caused primarily by bronchiolitis (heart diseases, sepsis, bone marrow transplant rejection, meningitis).
We analysed the mean hospitalization length for the two groups and the emerging data was the significantly longer hospital stay in Group 1, compared to Group 2 (+ 1.04 day; 95% CI, 0.96–1.11; p < 0.0001) (Fig. 5). However, in each group the hospital stay length was very similar between seasons.
Fig. 5
Mean hospital stay (days)
Out of all hospitalizations, Group 1 required more critical care (oxygen therapy and/or mechanical ventilation) than Group 2 (+ 23.0% and + 28.7% in season 1 and in season 4, respectively), although throughout the seasons we observed an increment of critical care in both groups (Fig. 6).
Fig. 6
Rates of critical care cases out of all hospitalizations
In order to investigate comorbidities, we divided Group 1 into three subgroups: (A) infants with heart disease; (B) premature infants; (C) infants without risk factors. Then, we analyzed the mean length of hospital stay in each subgroup. We also verified whether the number of comorbidities could have an impact on the length of hospital stay. The mean hospital stay of subgroup A and subgroup B were significantly longer than that of subgroup C (10.7 days versus 6.1 days, p < 0.0001; 34.0 days versus 6.1 days, p < 0.0001). In each subgroup, we noticed that the higher the number of diagnoses, the longer the length of hospital stay.
Heart disease
Premature infants
No risk factors
Total
Number of hospitalizations
412
56
26,687
27,155
Mean length of hospital stay
10.7
34.0
6.1
6.2
Furthermore, the multivariable linear regression model yielded a statistically significant result, as indicated by an F-statistic of 478.85 (p < 0.0001). Specifically, the following variables demonstrated concurrent statistical significance within the model and were associated with longer hospital stay: prematurity, cytomegalovirus infection, sepsis, Down syndrome, pertussis, esophageal reflux, heart disease, rotavirus gastroenteritis, Hemophilus influenzae infection, urinary tract infection, anemia, rhinovirus, and belonging to Group 1 (RSV-coded). All variables except one (rhinovirus, p = 0.013) had a p-value < 0.001.
Considering the type of healthcare facility (pediatric vs. general hospitals), we found that in season 4 infants in Group 1 (RSV-coded) admitted in pediatric hospitals were 7.2% of the total (pediatric + general), compared to 4.9% (+ 46.9%) of infants in Group 2.
Also, in the season 4 the proportion of RSV-coded admissions out of the total number of admissions for Group 1 plus Group 2 is higher in pediatric hospitals than in general hospitals (52.8% and 42.6%, respectively). This difference increases when considering monthly data: December 2018: 66.1% vs. 50.0%; January 2019: 65.6% vs. 53.1%; February 2019: 65.0% vs. 51.0%; March 2019: 61.1% vs. 40.1%).
The mean cost for hospitalization increased from season 1 to season 4 for Group 1 and Group 2: Group 1, from € 2,483 to € 2,617 (+ 5.4%); Group 2, from € 2,007 to € 2,180 (+ 8.6%). In season 4, the total costs for all infants hospitalized in Italy were: Group 1: € 20,203,406; Group 2: € 22,124,502.
留言 (0)