
記住我
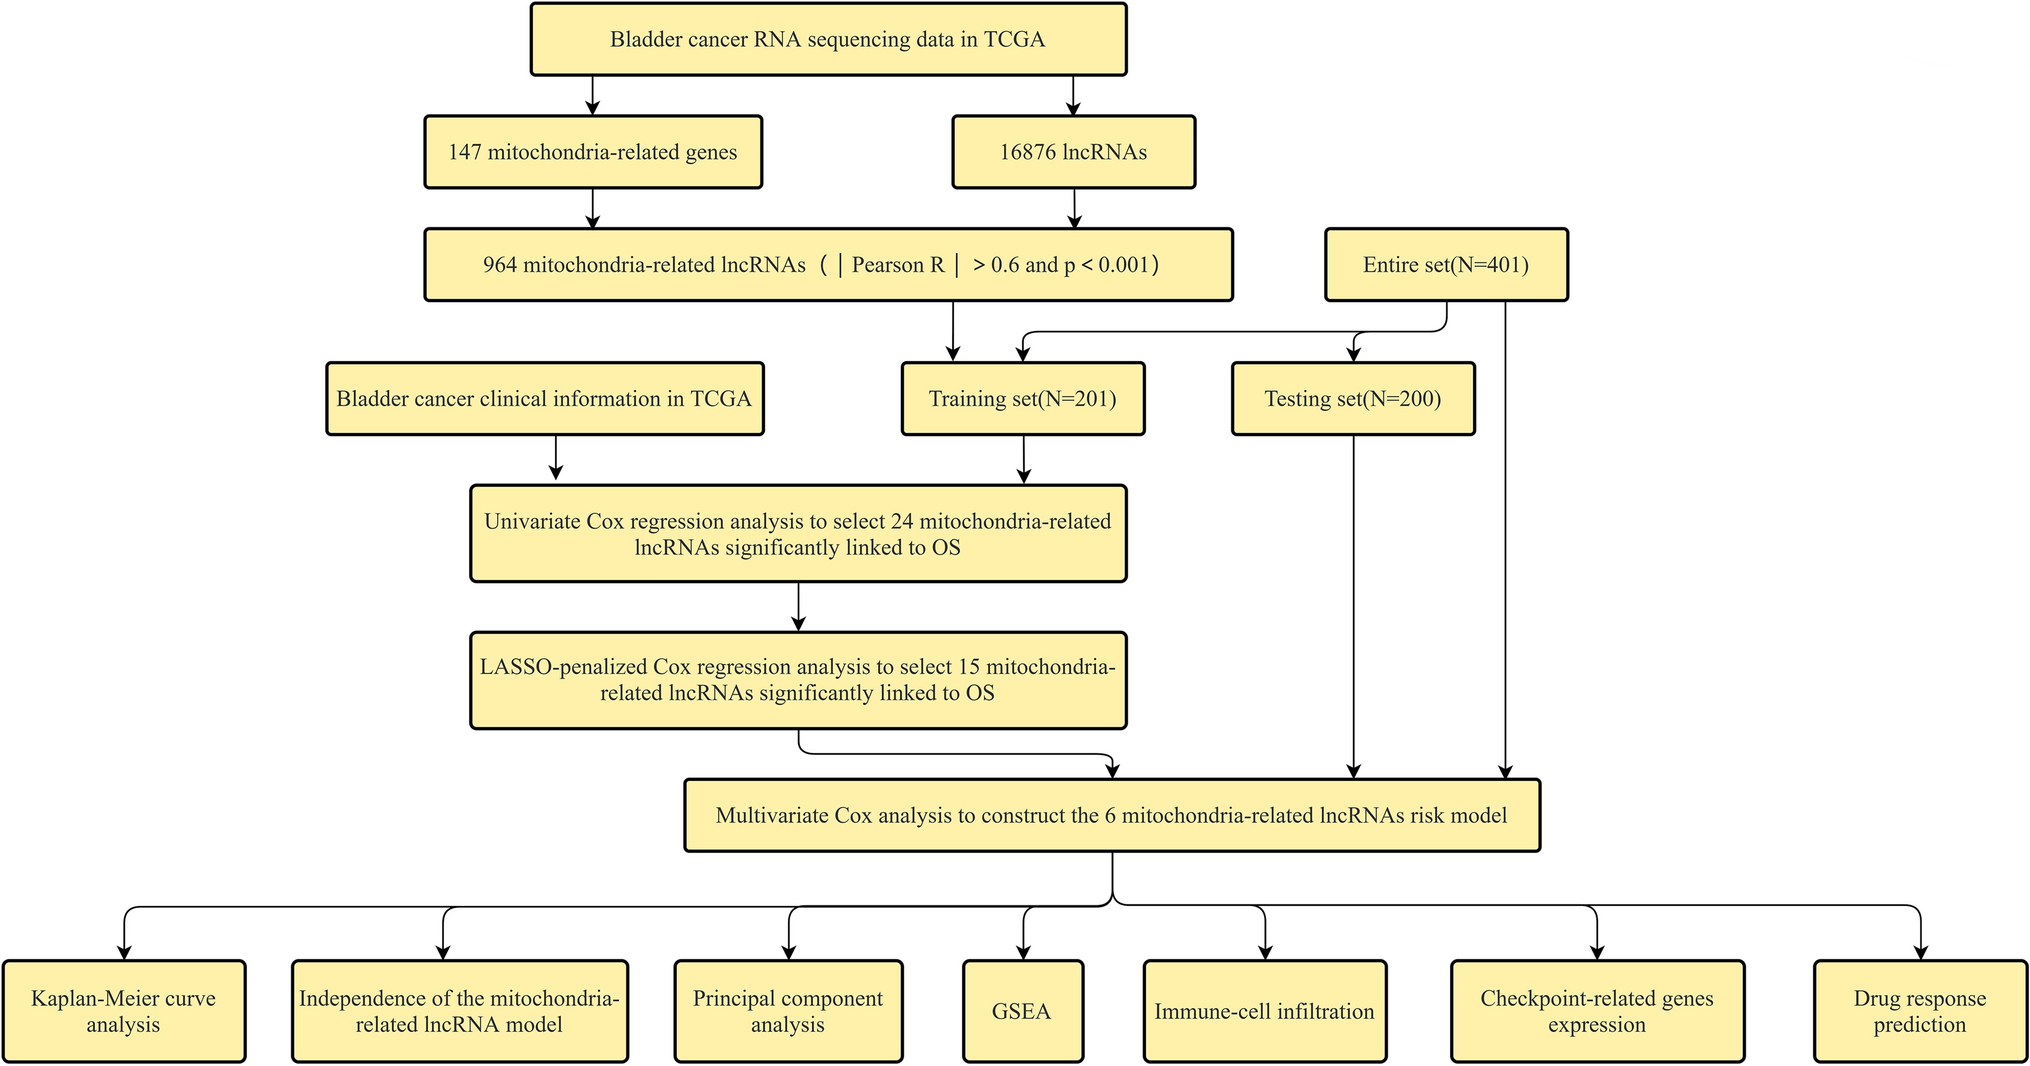


The research scheme is shown in Fig. 1. BLCA raw RNA sequencing data were retrieved from the TCGA database to extract 16,876 lncRNAs, and a co-expression network has been developed with 147 mitochondrial-related coding genes (mRNAs). Thus, a total of 964 mitochondrial-related lncRNAs (correlation coefficient |r|> 0.6 and P < 0.001) was obtained. The limma R package was utilized to perform the differential expression analysis. Consequently, 532 differentially expressed mitochondrial-related lncRNAs (log twofold change (FC) > 1, false discovery rate (FDR) < 0.05) are obtained, and 457 of them underwent up-regulation while 75 underwent down-regulation (Fig. 2A). The network diagram comprising mitochondrial-related genes and lncRNAs is illustrated in Fig. 2B. The identification of differentially expressed mitochondrial-related lncRNAs highlights their potential role in BLCA pathology. Up-regulated lncRNAs may contribute to tumor progression by influencing mitochondrial function, energy metabolism, and reactive oxygen species production, which are crucial for cancer cell survival and proliferation.
Fig. 1 Fig. 2
Detection of differentially expressed mitochondrial-related lncRNAs in BLCA patients. A Volcano plot of differentially expressed mitochondrial-associated lncRNAs. Green-colored sequences depicting down-regulated lncRNAs, and red-colored for up-regulated lncRNAs. B Network constituting mitochondrial genes and lncRNAs
3.2 Screening of BLCA prognosis mitochondrial-related lncRNAs and establishment of prognostic risk modelA univariate Cox regression analysis has been executed via R’s “survival” package to calculate the prognostic significance of 532 differentially expressed mitochondrial-related lncRNAs in BLCA (Fig. 3A). 24 lncRNAs showed a considerable association with the BLCA prognosis (P < 0.05) (Fig. 3B). Further, through LASSO analysis, 15 lncRNAs were selected. Multivariate Cox regression analysis and KM method are applied to screen the mitochondrial lncRNAs with independent prognosis, and 6 lncRNAs were determined according to the optimal AIC value to establish a BLCA prognostic risk model (Fig. 3C-D). The selected lncRNAs for the prognostic risk model suggest their independent roles in BLCA progression and patient outcomes. These lncRNAs may regulate key biological processes such as apoptosis, immune response, and mitochondrial function, thereby influencing overall survival.
Fig. 3
mitochondrial extraction of prognostic features of mitochondrial-associated lncRNAs in BLCA. A Mitochondrial-associated prognostic lncRNAs assessed by univariate regression analysis. B 24 prognostic mitochondrial-related lncRNAs screened by the LASSO-Cox regression model. C Expression profiles of 24 prognostic mitochondrial-related lncRNAs. D Distribution of LASSO coefficients of 24 mitochondrial-related lncRNAs
3.3 Prognostic risk model validationFor assessing the prognosis capacity of the developed model, it was divided into 3 sets: training, testing, and entire sets, and we then calculated the RS of each patient according to the RS formula and classified patients into two risk groups (low and high) as per the median risk value Group. The R software's "survival" package has been used to compare the RS distribution, survival status, survival time, and expression profiles of the lncRNAs related to low- as well as high-risk groups across the three concentrations. In the training set, the RS curve (Fig. 4A), survival status map (Fig. 4B), and heat map of 6 mitochondrial-related lncRNAs (Fig. 4C), OS of patients between both risk groups were plotted. The KM survival curve (Fig. 4E) constructed from these results indicated the mortality rate of patients in HRG was considerably higher than those in LRG. It should be noted that as the RS increased, the mortality rate of patients also increased, and the overall survival time of patients in HRG tended to decrease. The areas under the ROC curve (AUC) at 1, 3, and 5 years were 0.755, 0.708, and 0.685, respectively (Fig. 4F). Furthermore, the BLCA prognosis predictors were screened via univariate Cox regression analysis where age, stages (T, M, N), as well as RS, were all found to be related to BLCA prognosis (Fig. 4D). However, multivariate Cox regression analysis outcomes implied that age, sex, stage, and RS are independent predictors of BLCA prognosis (Fig. 4G). The RS curve (Fig. 5A), survival state map (Fig. 5B), and heat map of 6 mitochondrial-related lncRNA (Fig. 5C) in the testing set, the OS of patients in LRG, KM survival curve for the HRG (Fig. 5E) were constructed. The mortality rate of the patients in HRG has been found considerably higher than that of LRG. It is to be noted that with high RS, the mortality rate is higher, and the overall survival time of the patients in the HRG is shorter. The values for the areas under the ROC curve (AUC) were 0.691, 0.575, and 0.562 for 1-, 3-, and 5-year periods, respectively (Fig. 5F). Moreover, the predictors of BLCA prognosis were identified utilizing univariate Cox regression analysis. The results revealed an association of the RS with BLCA prognosis (Fig. 5D). Also, as per the findings of univariate Cox regression analysis, it was concluded that the RS served as an independent predictor for BLCA prognosis (Fig. 5G). For the entire set, the RS curve (Fig. 6A), survival status map (Fig. 6B), a heat map of six mitochondrial-related lncRNA genes (Fig. 6C), and OS of patients between both risk groups were plotted. The KM survival curve (Fig. 6E) constructed from these results indicated the mortality rate of patients in HRG is considerably higher than in HRG. It is worth noting that patients with higher RSs exhibited higher mortality rates and shorter overall survival times, particularly those in the HRG. The AUC values were found as 0.721, 0.636, and 0.625 for 1-, 3-, and 5-year periods, respectively (Fig. 6F). Also, the BLCA prognosis predictors were screened via univariate Cox regression analysis, and stage, T stage, N stage, and RS were all found to be related to BLCA prognosis (Fig. 6D). However, the results of multivariate Cox regression analysis implied that RS were independent predictors of BLCA prognosis (Fig. 6G).The prognostic risk model effectively stratifies BLCA patients based on survival outcomes. High-risk patients may exhibit more aggressive tumor behavior and poorer responses to conventional treatments, underscoring the need for targeted therapeutic strategies.
Fig. 4
Prognostic value of mitochondrial-related lncRNA prognostic model in the training set. A RSs for mitochondrial-related lncRNA models in the training set. B Scatter plot for high- as well as low-risk survival status in the training set. C Heat map of 6 mitochondrial-related lncRNA in the training set. D The RS as well as clinicopathological characteristics as evaluated utilizing univariate regression analysis. E KM survival curves of OS between both risk group patients for the training set. F ROC curves for 1-, 3-, and 5-year periods were obtained by utilizing the model in the training set. G The RS as well as clinicopathological characteristics as evaluated utilizing multivariate regression analysis
Fig. 5
Prognostic value of mitochondrial-related lncRNA prognostic model in the testing set. A RSs for mitochondrial-related lncRNA models in the testing set. B Scatter plot of survival statuses in both risk groups in the testing set. C Heat map of—mitochondrial-related lncRNAs in the testing set. D Uni-Cox regression analysis of RS and clinicopathological characteristics. E KM survival curves of OS among both the risk groups for the testing set. F ROC curves for 1-, 3-, and 5-year periods were obtained utilizing the model in the testing set. G Multi-Cox regression analysis of RS and clinicopathological features
Fig. 6
Prognostic value of mitochondrial-related lncRNA prognostic model in the entire set. A RSs for mitochondrial-related lncRNA models in the entire set. B Scatter plot of high- as well as low-risk survival status in the entire set. C Heat map of 6 mitochondrial-related lncRNAs in the entire set. D The RS as well as clinicopathological features as evaluated utilizing uni-Cox regression analysis. E KM survival curves of OS among patients of both risk groups for the entire set. F ROC curves for 1-, 3-, and 5-year periods were obtained by utilizing the model in the entire set. G Multi-Cox regression analysis of RS and clinicopathological features
3.4 Clinical evaluation of mitochondrial-related lncRNA prognostic signatureA heat map (Fig. 7A) illustrating the correlation between RSs and clinical indicators was generated utilizing the Wilcoxon signed-rank test. From the map, it is evident that the survival status (Fig. 7B), age (Fig. 7C), tumor grade (Fig. 7E), clinical stage (Fig. 7F), T stage (Fig. 7G), and M stage (Fig. 7H) was significantly linked to the RS (P < 0.001). Conversely, gender (Fig. 7D) and N stage (Fig. 7I) did not exhibit any notable correlation with the RS (P > 0.05). The correlation of RS with adverse clinical features reinforces the model's relevance in predicting BLCA prognosis. High-risk patients may benefit from more intensive monitoring and personalized treatment approaches to improve outcomes.
3.5 PCA verifying the capability of the mitochondrial-related lncRNA signature to establish groups effectively
Fig. 7
Clinical correlation of RSs utilizing clinicopathological features of BLCA patients. A Heatmap outlining common clinical characteristics, B Survival status (P < 0.001), C Age, D Gender, E Tumor grade, F Clinical stage, G T stage, H M phase, I N stage
PCA revealed expression patterns for the whole genome (Fig. 8A), mitochondrial-related genes (Fig. 8B), mitochondrial-related lncRNA (Fig. 8C), and mitochondrial-related lncRNA prognostic signature for both risk groups (Fig. 8D). Figures 8A–C illustrate that both low-risk groups are widely dispersed in their distribution. Nonetheless, this model's findings reveal that the prognostic signature of mitochondrial-related lncRNAs exhibits distinct expression profiles for both risk groups (Fig. 8D). Therefore, these results demonstrate the capability of prognostic signature to successfully differentiate between LRG and HRG.
Fig. 8
Following profiles were constructed based on the PCA of HRG and LRG. A Whole gene expression profile. B Mitochondrial-related gene expression profile. C Mitochondrial-related lncRNA expression profile. D Mitochondrial-related lncRNA prognostic signature expression profile for both risk groups
3.5 GSEA and correlation analysis of prognostic risk model and tumor-infiltrating immune cellsGSEA revealed a variety of mitochondrial and BLCA-related pathways, most of which are the prognostic marker regulators of mitochondrial-related lncRNAs, including drug metabolism cytochrome P450, linoleic acid metabolism, metabolism of xenobiotics by 450, retinol metabolism, and steroid hormone biosynthesis were considerably enriched in the LRG. The 5 pathways of arrhythmogenic right ventricular cardiomyopathy arvc, dilated cardiomyopathy, focal adhesion, gap junction, and prion diseases were found considerably enriched in the HRG (Fig. 9A). The relationship between prognostic features and tumor immune-infiltrating cells was evaluated utilizing PCA using seven algorithms and the results are illustrated via lollipops (Fig. 9B). The immune, stromal as well as estimate scores for each BLCA sample were computed via the ESTIMATE algorithm. Compared with the LRG, higher immune, stromal as well as estimate scores were observed in the HRG (P < 0.001), indicating different degrees of immune cell infiltration occurring in both risk groups. The boxplots showing variations in the number of tumor-infiltrating immune cells between both risk groups were constructed (Fig. 9C–E). The enriched pathways provide insights into the metabolic and signaling alterations in BLCA, highlighting potential therapeutic targets. The differences in immune cell infiltration between risk groups suggest that immune-related lncRNAs play a critical role in tumor microenvironment modulation and patient prognosis.
Fig. 9
Prediction of tumor immunotherapy. A GSEA identified the top 5 pathways that exhibited considerable enrichment in both risk groups. B Association of tumor-infiltrating immune cells with prognostic signatures based on seven known algorithms. C Differences in immune scores between HRG and LRG. D Variations of stromal score between HRG and LRG. E ESTIMATE score variations between HRG and LRG
3.6 Correlation between the prognostic risk model and ICIsThe application of ICIs is one of the important potential treatments for BLCA. Hence, the correlation between the prognostic risk model and ICIs has been studied. High-RS and CTLA4 (P < 0.001; Fig. 10A), HAVCR2 (P < 0.001; Fig. 10C), LAG3 (P < 0.001; Fig. 10D), High expression of PD-L1 (P < 0.01; Fig. 10E), PD-L1 (P < 0.001; Fig. 10F), PD-L2 (P < 0.001; Fig. 10G), TIGIT (P < 0.001; Fig. 10H) were significantly correlated positively, but GAL9 was not varied considerably by risk group (P > 0.05; Fig. 10B). The association with immune checkpoints suggests that high-risk BLCA patients may benefit from immunotherapy, providing a rationale for incorporating immune checkpoint blockade in treatment plans for these patients.
Fig. 10
Relationship between prognostic features and the expression criteria of ICIs. A CTLA4 (P < 0.001), B GAL9 (P > 0.05), C HAVCR2 (P < 0.001), D LAG3 (P < 0.001), E PD-L1 (P < 0.01), F PD-L1 (P < 0.001), G PD-L2 (P < 0.001), and H TIGIT (P < 0.001)
3.7 Analyzing the association between the prognostic risk model and targeted drug sensitivityTargeted drugs are the most important primary treatment for advanced BLCA. The group at high risk was discovered to have an association with low IC50s. for cisplatin (Fig. 11A), docetaxel (Fig. 11B), paclitaxel (Fig. 11C), methotrexate (Fig. 11E), and vinblastine (Fig. 11F), suggesting that the prognostic risk model developed in this study can predict these drug sensitivities. Contrarily, the IC50 value of gemcitabine (Fig. 11D) didn’t display any remarkable variations between both risk groups. The differential drug sensitivity between risk groups underscores the importance of personalized chemotherapy regimens based on the prognostic risk model, potentially improving therapeutic efficacy and minimizing adverse effects.
Fig. 11
Relationship between chemotherapy drugs and risk model in patients with BLCA. In comparison to the LRG, individuals in the HRG exhibited a greater level of sensitivity to A cisplatin, B docetaxel, C paclitaxel, D gemcitabine, E methotrexate, and F vinblastine. G No significant differences in sensitivity were observed between the two groups regarding the drug gemcitabine
留言 (0)