
記住我


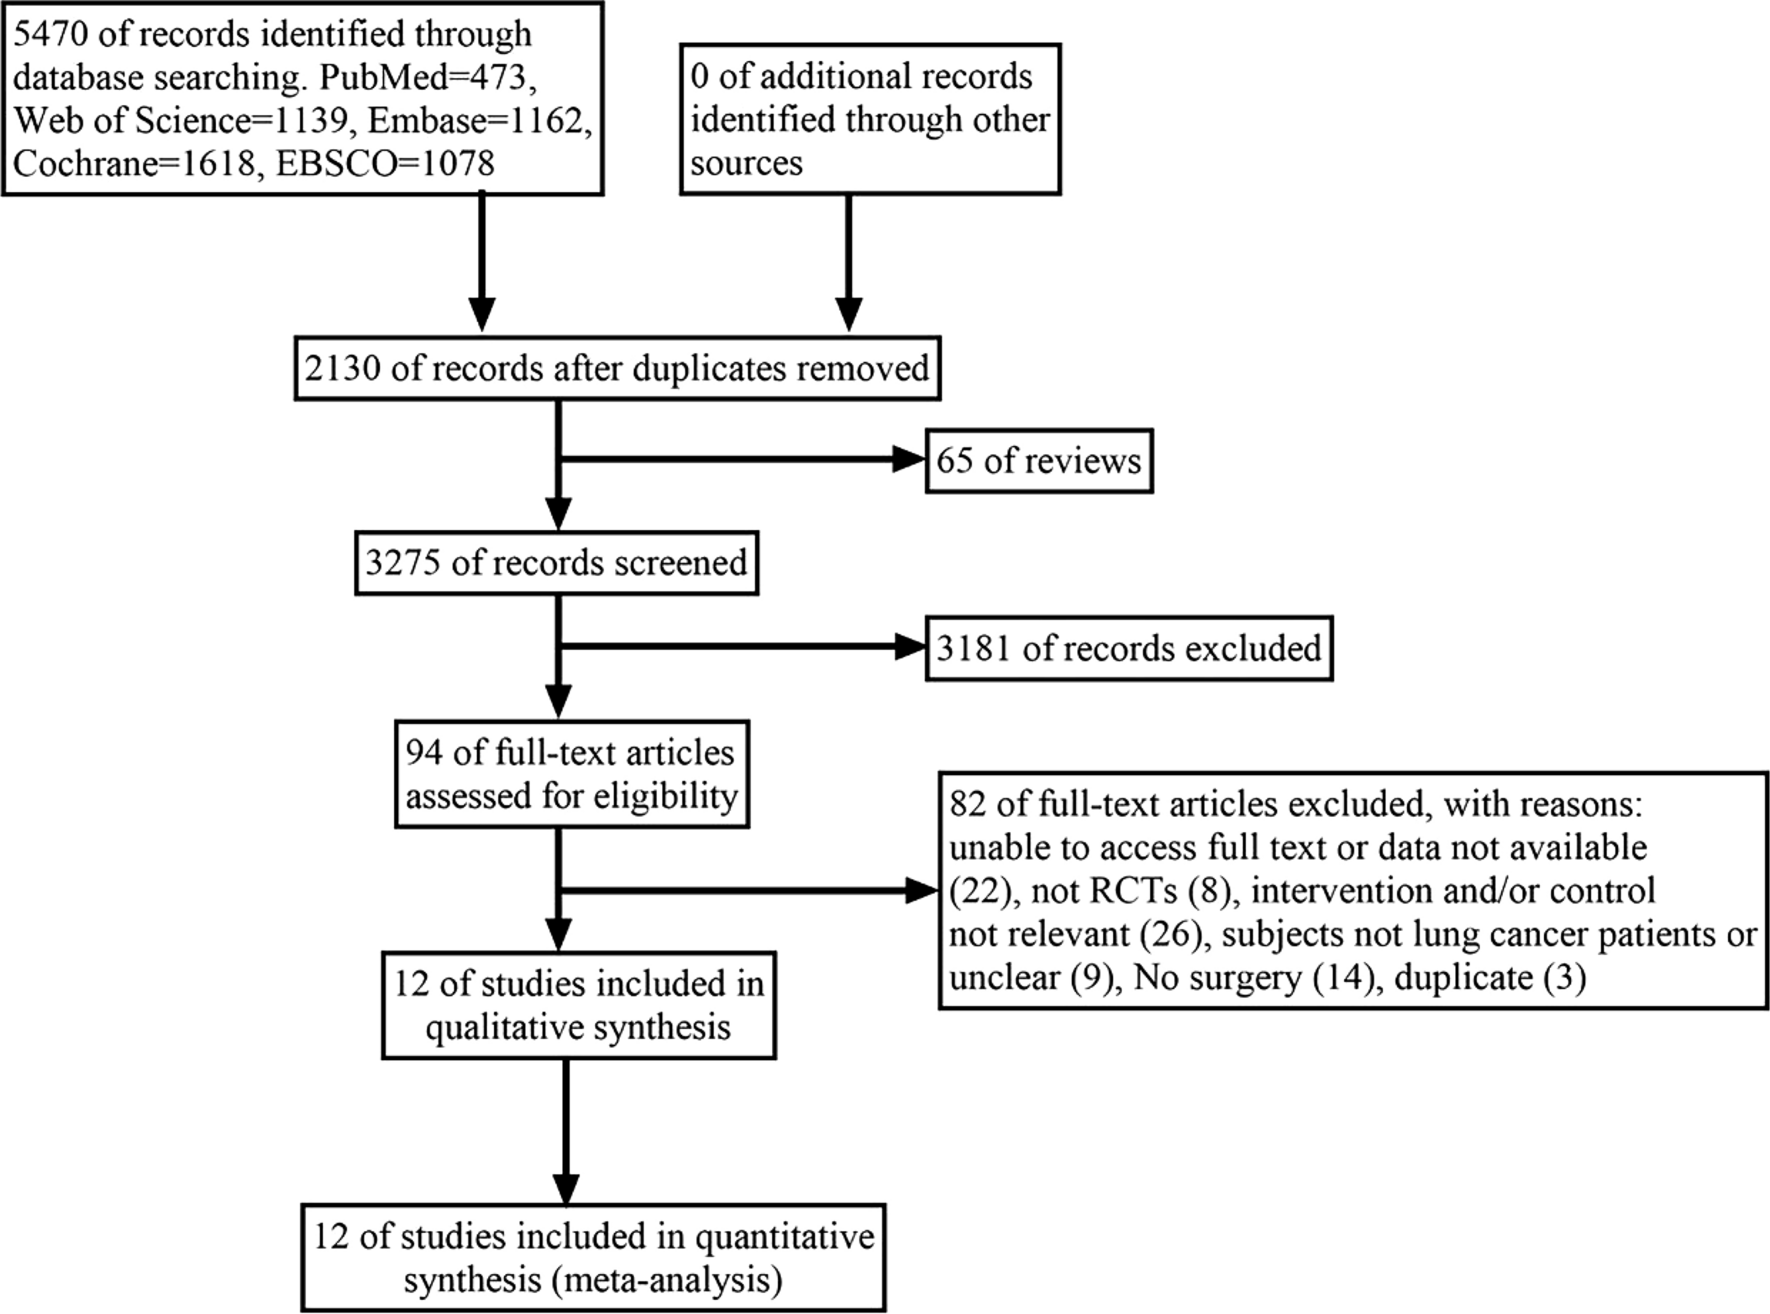


The flowchart of selection process is presented in Fig. 1. 5470 potentially eligible articles were retrieved from which duplicates and reviews were removed, resulting in 3275 articles for screening. After evaluating titles and abstracts, 3181 articles were excluded, followed by the removal of 82 articles after reading their full texts. Ultimately, only 12 eligible articles were enrolled.
Fig. 1
Flow chart of the study selection process
3.2 Description of the included RCTs3.2.1 ParticipantsThe characteristics of the included RCTs are summarized in Table 1. 413 cases in the experimental group and 407 cases in the control group were included. Ten RCTs included only postoperative NSCLC patients. Two RCTs included postoperative patients with NSCLC and small cell lung cancer (SCLC). Ten RCTs reported the surgical approach used, video-assisted thoracoscopic surgery (VATS) or open thoracic surgery. The mean age of the study participants ranged from 56 to 68 years, with the majority being middle-aged or older.
Table 1 Characteristics of included RCTs3.2.2 InterventionsA concise overview of exercise programs is presented in Table 1. Twelve studies implemented exercise interventions during the postoperative period, encompassing six articles using aerobic and resistance exercises, two articles using HIIT with resistance exercise, one article combining aerobic, HIIT, and resistance exercises, one article combining resistance and cardiovascular exercises, one article combining aerobic, resistance, and respiratory exercises, and one article solely on aerobic and respiratory exercises. The primary forms of aerobic exercise were cycling, walking, and treadmill activities. The main form of resistance training was the range of motion exercises for the trunk and limbs. Chest breathing techniques, abdominal breathing methods, or ventilator assistance, were primary forms of respiratory exercise. All interventions lasted at least four weeks. During this period, the frequency of each exercise intervention varied. The control group in each study received either standard care no, specific exercise training, or only general instructions regarding physical activity.
3.2.3 OutcomeThe outcome measures are presented in Table 1. These studies primarily focused on pulmonary function [e.g., forced expiratory volume (FEV), forced expiratory volume in 1 s (FEV1)], exercise capacity [e.g., six-minute walk distance (6MWD), peak oxygen uptake (VO2peak)], QOL [the 36-item short form health survey (SF-36), the European organization for research and treatment of cancer (EORTC QLQ-C30)], muscle strength (e.g., quadriceps, grip strength), dyspnea, fatigue, postoperative complications, and length of hospitalization. Two studies examined the impact of exercise on forced vital capacity (FVC) and various aspects of functional status, symptoms, role functioning, cognitive functioning, social functioning, grip strength, handgrip strength, anxiety levels, depression levels, and oxygen saturation (SPO2) in postoperative lung cancer patients. Due to limited data available for FVC, postoperative complications, functional status, symptoms, role functioning, cognitive functioning, social functioning, anxiety levels, depression levels, and SPO2 from the EORTC QLQ-C30 questionnaire were not included in this analysis. Additionally, other outcome indicators such as the ratio of spirometry to airflow capacity (FEV1/FVC), diffusion function, and St George’s respiratory questionnaire (SGRQ) were studied but could not be analyzed due to insufficient data.
3.3 Methodological quality assessmentThe results of Cochrane risk evaluation are presented in Fig. 2. Among the enrolled articles, twelve explicitly reported randomization methods and ten had concealed the allocation of groups. Given that all studies involved human subjects, blinding of participants and personnel was a challenge. However, informed consent forms were signed by participants, and exercise interventions were supervised by researchers. Consequently, all articles were deemed a high risk of bias. Seven articles described blinding for outcome analysis, but three were rated as high risk due to a significant loss of personnel during the intervention. Some papers clearly outlined how missing data were handled and the methods used, while five papers selectively reported outcomes. When reviewing the trial registers, it was found that not all prespecified results were reported in the published papers. In addition, some outcomes appeared in the papers but not in the registers, leading to three articles being rated as high risk due to baseline differences.
Fig. 2
Cochrane risk bias evaluation chart. A Risk of bias graph B Risk of bias summary
3.4 Synthesis of the results3.4.1 Analysis of pulmonary functionLung function was measured in six studies, with FEV1 and FEV analyzed. Among the five studies investigating FEV1, no great difference was noted between the intervention and control groups (MD = 0.20; 95% CI [− 0.10, 0.51]; P = 0.20; I2 = 94%) (Fig. 3). In three studies on FEV, there was also no marked difference (MD = 1.17; 95% CI [− 2.64, 4.97]; P = 0.55; I2 = 0%) (Fig. 4).
Fig. 3
Forest plot of post-intervention FEV1 value. SD: standard deviation; IV: inverse variance; CI: confidence interval
Fig. 4
Forest plot of post-intervention FEV value. SD: standard deviation; IV: inverse variance; CI: confidence interval
3.4.2 Analysis of 6MWDThe effect of exercise on 6MWD is summarized in Fig. 5. Nine studies with 6MWD as a measure of exercise capacity were included, including 455 participants. Due to substantial heterogeneity (I2 = 71%), a random-effects model was employed to estimate combined effects, and the analysis demonstrated substantial differences between the intervention and control groups (MD = 35.80; 95% CI [13.99, 57.62]; P = 0.001).
Fig. 5
Forest plot of post-intervention 6MWD value. SD: standard deviation; IV: inverse variance; CI: confidence interval
3.4.3 Analysis of VO2peakFive studies reported VO2peak as an indicator of exercise capacity, with 255 participants providing data. Four of these studies utilized the statistical unit of mL/kg/min to measure VO2peak, while the remaining study used ml O2/min. Considering the different units, we employed SMD for data comparison and analysis. Due to substantial heterogeneity (I2 = 80%), random-effects models were applied for combined effects estimation. The results noted a significant disparity between the intervention and control groups (SMD = 1.05; 95% CI [0.35, 1.76]; P = 0.003) (Fig. 6). Sensitivity analyses were conducted to identify potential sources of heterogeneity.
Fig. 6
Forest plot of postintervention VO2peak value SD: standard deviation; IV: inverse variance; CI: confidence interval
3.4.4 Analysis of QOLTo comprehensively investigate the impact of postoperative exercise on QOL in patients undergoing pneumonectomy, we conducted a statistical analysis using SF-36 and EORTC QLQ-C30.
Six studies assessed QOL using the SF-36 questionnaire. The pooled results demonstrated a significantly improved physical domain score of SF-36 after postoperative exercise (MD = 3.10, 95% CI [1.28, 4.93]; P = 0.0008; I2 = 29%) (Appendix S3-1). However, substantial heterogeneity was noticed (I2 = 89%). Therefore, a random-effects model was employed for analysis (MD = 4.76, 95% CI [− 1.78, 11.30]; P = 0.15; I2 = 89%). Notably, no prominent differences were found between the two groups in the psychological domains of SF-36 (Appendix S3-2).
Postoperative exercise training was significantly correlated with improved physical function (MD = 7.91, 95% CI [0.84, 14.98]; P = 0.03; I2 = 76%) and role physical (MD = 7.73, 95% CI [2.91, 12.55]; P = 0.002; I2 = 37%) (Appendix S3-3).
Postoperative motor rehabilitation was significantly correlated with social functioning (MD = 6.80, 95% CI [3.63, 9.98]; P < 0.0001; I2 = 0%) and psychological well-being (MD = 9.47, 95% CI [7.54, 11.41]; P < 0.00001; I2 = 18%) within the four psychological domains (Appendix S3-4).
Six studies reported disease-specific health-related quality of life (HRQoL) using the EORTC QLQ-C30, while five studies reported global health component scores on the same questionnaire. No noticeable differences were found in global health component scores (MD = 1.39, 95% CI [− 2.53, 5.32]; P = 0.49; I2 = 0%). However, significant differences were observed in body composition across four studies (MD = 4.88, 95% CI [2.05, 7.72]; P = 0.0007; I2 = 0%). In contrast, no significant differences were found between in three studies investigating affective functioning (MD = 11.47, 95% CI [− 4.58, 27.53]; P = 0.16; I2 = 77%) (Appendix S3-5).
3.4.5 Analysis of quadricepsFour studies reported the intervention's impact on quadriceps muscle, with 133 participants providing data. Substantial evidence indicated high heterogeneity (I2 = 78%). Consequently, a random-effects model was employed for analysis (MD = 18.85; 95% CI [1.36, 36.33]; P = 0.03) (Fig. 7). The findings demonstrated visible differences in quadriceps muscle, and sensitivity analysis was conducted to identify the source of heterogeneity.
Fig. 7
Forest plot of post-intervention quadriceps value. SD: standard deviation; IV: inverse variance; CI: confidence interval
3.4.6 Analysis of dyspneaThree studies examined the impact of interventions on dyspnea, involving 192 participants. A remarkable difference was noted between the intervention and control groups (MD = − 6.58, 95% CI [− 12.04, 1.13]; P = 0.02) (Fig. 8). The low heterogeneity across these studies (I2 = 13%, P for heterogeneity = 0.32) suggests that exercise interventions may effectively alleviate dyspnea in postoperative NSCLC patients.
Fig. 8
Forest plot of post-intervention dyspnea value. SD: standard deviation; IV: inverse variance; CI: confidence interval
3.4.7 Analysis of fatigueFive studies with participants reported the impact of the intervention on fatigue. Among these, three studies utilized the fatigue component score of the EORTC QLQ-C30, while the remaining two employed functional assessment of chronic illness therapy—fatigue (FACIT-Fatigue) for measuring fatigue levels. Higher scores on the EORTC QLQ-C30 indicate more severe fatigue, whereas lower scores on FACIT-Fatigue suggest greater fatigue severity. During data sorting and collection, we reversed the direction of the average change in FACIT-Fatigue scores (i.e., negative values were treated as positive). Due to different assessment methods, number of questions, and score ranges, SMD was calculated to analyze the data. The results obtained through fixed-effects model analysis unveiled no significant difference in fatigue (SMD = − 0.18; 95% CI [− 0.46, 0.11]; P = 0.22; I2 = 0%) (Fig. 9).
Fig. 9
Forest plot of post-intervention fatigue value SD: standard deviation; IV: inverse variance; CI: confidence interval
3.5 Subgroup analysis3.5.1 Subgroup analysis of FEV1Regarding the impact on postoperative NSCLC patients, our previous analysis of the overall sample did not disclose any significant findings (p > 0.05) in FEV1 for lung function. However, subgroup analyses (Fig. 10) unveiled some intriguing results. Three studies (n = 225 patients) reported aerobic and resistance exercise, which demonstrated notable differences between the intervention and control groups (MD = 0.12; 95% CI [0.04, 0.21]; P = 0.006; I2 = 0%). One study (n = 90 patients) provided data on FEV1 for breathing exercises combined with other forms of exercise, showing marked differences (MD = 0.81; 95% CI [0.62, 1.00]; P < 0.00001). Additionally, one study (n = 90 patients) presented FEV1 measurements for HIIT, revealing significant differences (MD = − 0.10; 95% CI [− 0.20, 0.00]; P = 0.05).
Fig. 10
Forest plot of post-intervention FEV1 value. SD: standard deviation; IV: inverse variance; CI: confidence interval
3.5.2 Subgroup analysis of 6MWDFigure 11 presents a summary of the impact of exercise on 6MWD. A random-effects model was employed for estimating combined effects, considering data from nine RCTs involving 455 participants. Overall, exercise demonstrated a noticeable increase in 6MWD levels (MD = 35.80; 95% CI [13.99, 57.62]; P = 0.004; I2 = 73%). Subgroup analyses yielded varying results. Six studies (n = 297 patients) reporting aerobic and resistance exercises manifested significant differences (MD = 33.24; 95% CI [6.09, 60.39]; P = 0.02; I2 = 64%). However, two studies (n = 144 patients) providing data on breathing and other exercises did not show any notable differences (MD = 36.92; 95% CI [− 23.11, 96.95]; P = 0.23; I2 = 92%). Additionally, one study (n = 14 patients) examining HIIT exhibited no marked difference (MD = 53.00; 95% CI [− 4.85, 110.85]; P = 0.07).
Fig. 11
Forest plot of post-intervention 6MWD value. SD: standard deviation; IV: inverse variance; CI: confidence interval
3.5.3 Subgroup analysis of physical domainFigure 12 presents a summary of the impact of exercise on physical aspects of QOL, with random-effects models utilized for combined effects estimation. Six RCTs with 336 participants assessed the SF-36 physical domain. Overall, exercise visibly improved bodily domains (MD = 3.10; 95% CI [1.28, 4.93]; P = 0.00008; I2 = 29%). Subgroup analyses yielded consistent results. Four studies (n = 258 patients) reported physical domains combining aerobic and resistance exercise, and analyses demonstrated prominent differences (MD = 2.15; 95% CI [0.06, 4.24]; P = 0.04; I2 = 0%). Two studies (n = 78 patients) reported the physical domains of HIIT, and analysis proved substantial differences (MD = 6.13; 95% CI [2.41, 9.85]; P = 0.001; I2 = 29%).
Fig. 12
Forest plot of post-intervention physical domain value. SD: standard deviation; IV: inverse variance; CI: confidence interval
3.5.4 Subgroup analysis of mental domainPrevious results from the overall sample analysis implied no statistical significance (P > 0.05) for the mental domain outcome metrics of the SF-36 questionnaire. However, noteworthy findings emerged after subgroup analyses on exercise interventions (Fig. 13). Four articles (n = 258 patients) reported notable differences in the mental domain outcomes for combined aerobic and resistance exercise (MD = 7.23; 95% CI [− 0.09, 14.55]; P = 0.05; I2 = 89%). Two articles (n = 78 patients) reported no notable difference in the mental domain outcomes for HIIT (MD = − 0.44; 95% CI [− 17.00, 16.12]; P = 0.96; I2 = 92%). To comprehensively explore the impact of postoperative exercise on QOL, we conducted a statistical analysis using SF-36 and EORTC QLQ-C30.
Fig. 13
Forest plot of post-intervention mental domain value. SD: standard deviation; IV: inverse variance; CI: confidence interval
3.6 Sensitivity analysisTo evaluate the stability of the meta-analysis, a sensitivity analysis was conducted. After excluding the study by Messaggi-sartor 2019 [29], heterogeneity for VO2peak greatly decreased (I2 = 12%), indicating that this study contributed to the observed heterogeneity. However, there was no significant change in the adjusted combined estimate (SMD = 0.55; 95% CI [0.29, 0.82]; P < 0.0001). Similarly, the removal of Arbane's study led to a significant reduction in heterogeneity for SF-36 physical functional values (I2 = 24%) [25], but it did not result in any substantial changes in the adjusted combined estimates (MD = 4.84; 95% CI [0.02, 9.67]; P = 0.05). The elimination of Arbane's study [4] substantially reduced heterogeneity for quadriceps data (I2 = 0%), suggesting it was a major source of heterogeneity; however, there were no evident alterations in the adjusted combined estimates (MD = 27.98; 95% CI [16.09, 39.87]; P < 0.00001). These findings indicated that the results obtained from this meta-analysis were relatively robust.
Sensitivity analyses were done for FEV1, 6MWD, physical domain, and psychological domain. Upon exclusion of each study, the sensitivity analyses demonstrated robustness and stability in the overall findings (Appendix S4).
3.7 Evolution of publication biasThe funnel plot showed no significant evidence of asymmetric distribution for FEV1, 6MWD, physical domain, and psychological domain. Begg's and Egger's tests indicated no significant publication bias in FEV1 (Pr >|z|= 0.624 > 0.05) (t = 1.11, P = 0.349), 6MWD (Pr >|z|= 0.404 > 0.05) (t = 0.39, P = 0.706), physical domain (Pr >|z|= 0.188 > 0.05) (t = -0.30, P = 0.782), and psychological domain (Pr >|z|= 0.573 > 0.05) (t = 0.74, P = 0.502) (Appendix S5).
留言 (0)