
記住我


According to CCLE analysis, the gene expression levels of CD74 are different in various cancer cell lines (Fig. 1A). The results downloaded from UCSC displayed that CD74 was expressed in all cancres and up-regulated in breast invasive carcinoma (BRCA), cholangiocarcinoma (CHOL), glioblastoma multiforme (GBM), esophageal carcinoma (ESCA), kidney renal clear cell carcinoma (KIRC), kidney renal papillary cell carcinoma (KIRP), liver hepatocellular carcinoma (LIHC), stomach adenocarcinoma (STAD), thyroid carcinoma (THCA) and uterine corpus endometrial carcinoma (UCEC) (Fig. 1B). It was significantly downregulated in colon adenocarcinoma (COAD), lung squamous cell carcinoma (LUSC), lung adenocarcinoma (LUAD), pancreatic adenocarcinomaancreatic adenocarcinoma (PAAD), pheochromocytoma and paraganglioma (PCPG), prostate adenocarcinoma (PRAD), rectal adenocarcinoma (READ), skin cutaneous melanoma (SKCM). Since cell surface CD74 acts as a receptor for the cytokine macrophage migration inhibitory factor (MIF), and their combination induces a signaling cascade that regulates cell proliferation and survival, we also compared the expression of MIF in pan-cancer. MIF expression levels were remarkably elevated in 19 cancer types in pan-cancer (Fig. 1C).
Fig. 1
Pan-cancer CD74 and MIF expression. A The mRNA level of CD74 in CCLE. B The expression of CD74 between tumor tissues and normal tissues in TCGA database. C The expression of MIF between tumor tissues and normal tissues. *P < 0.05, **P < 0.01, ***P < 0.001
Subsequently, we compared the IHC results provided by the HPA database with the CD74 gene expression data from TCGA (Supplementary Fig. 1), and found that the CD74 expression results were consistent.
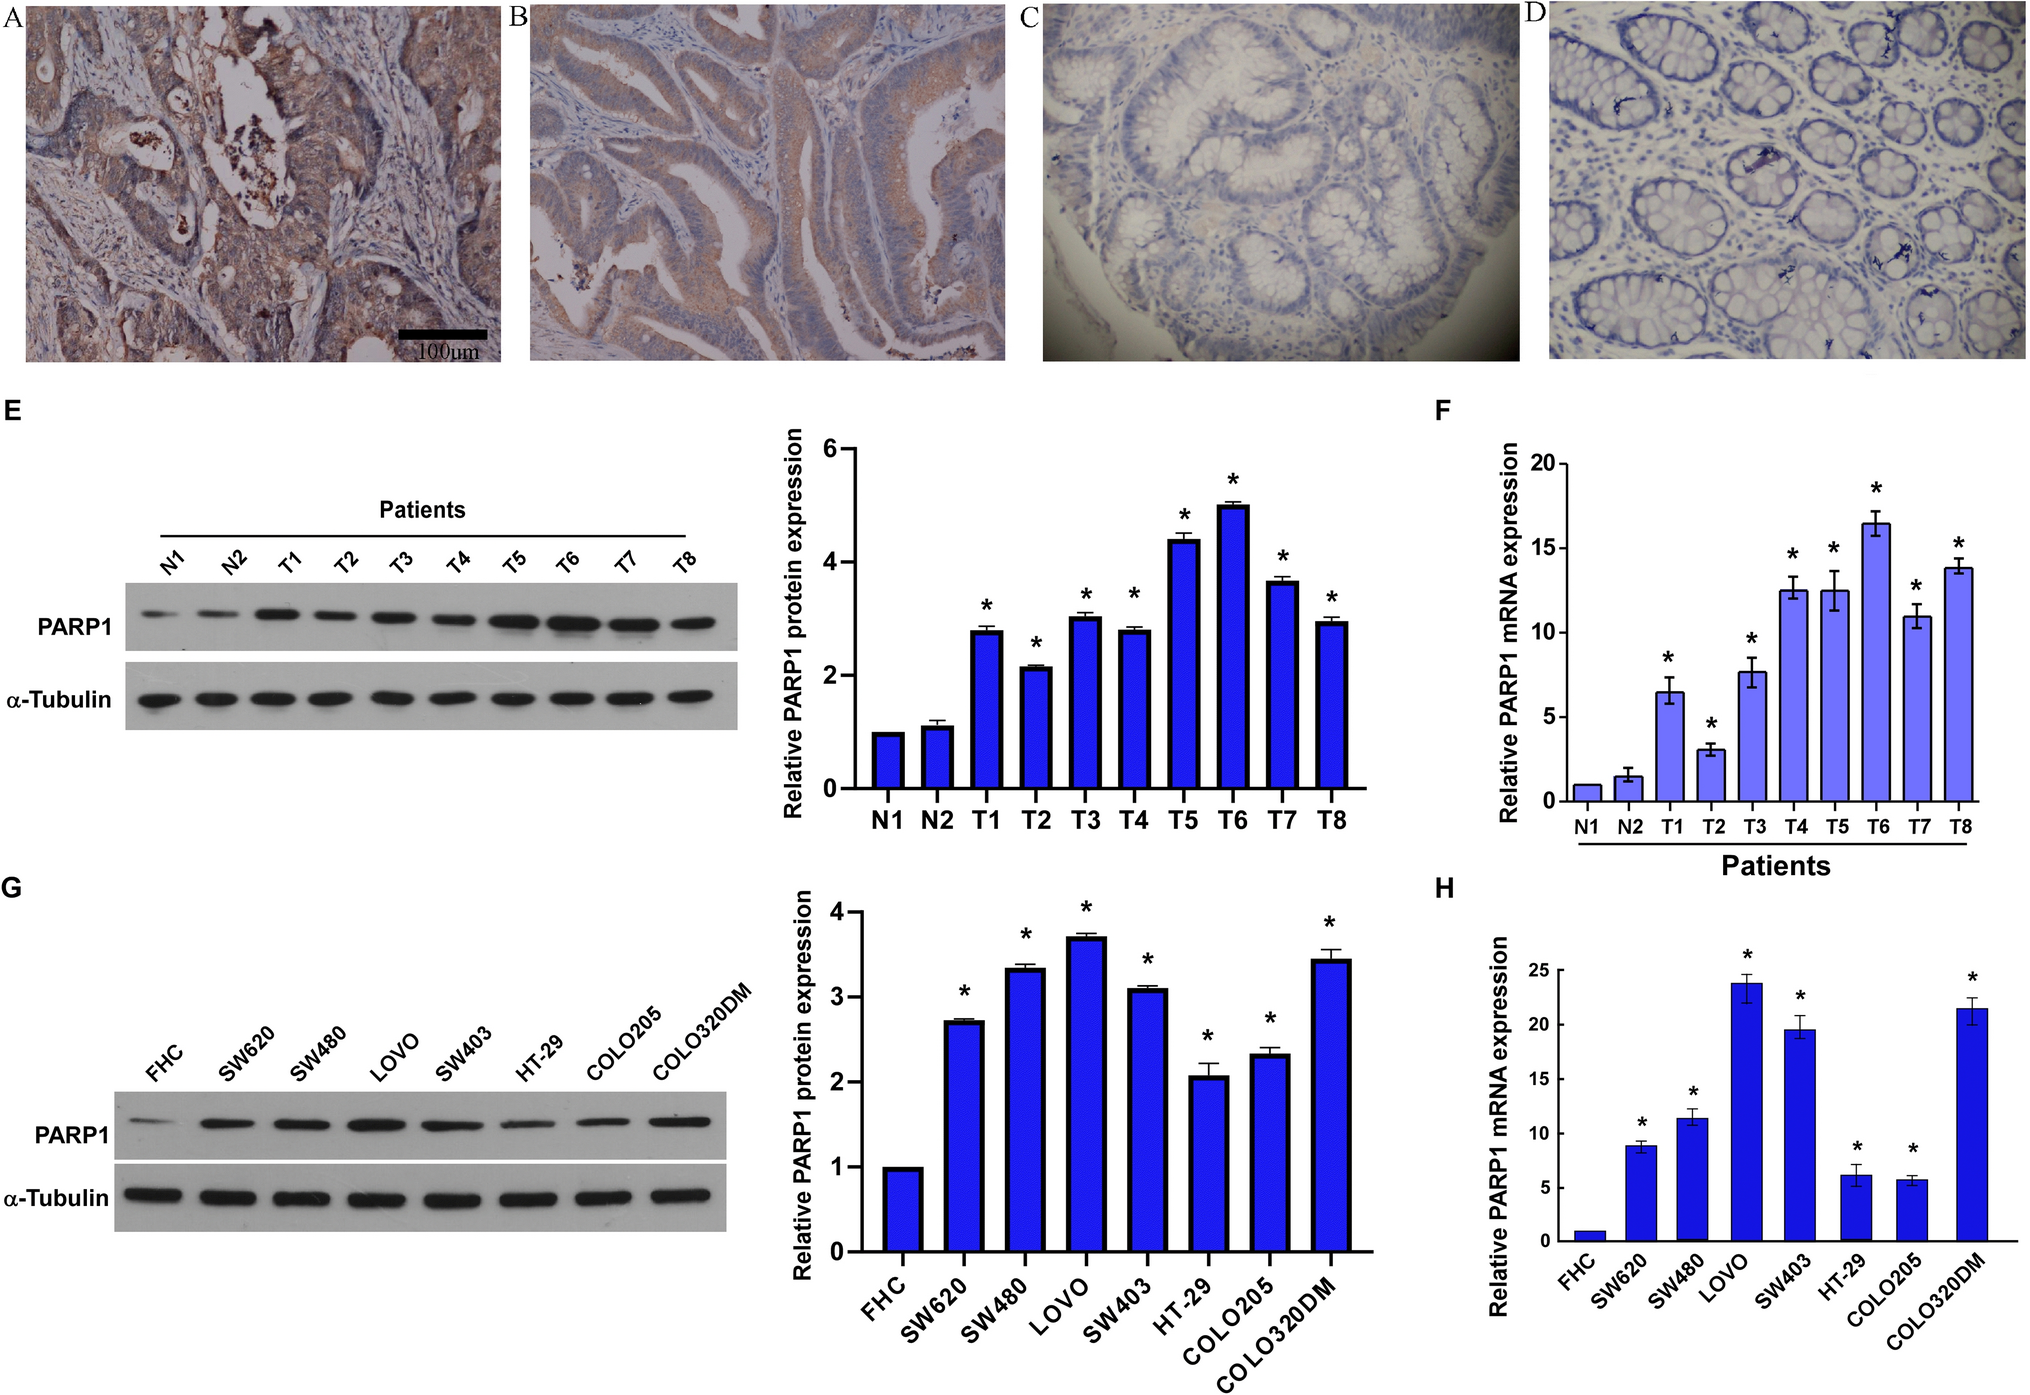
3.2 Expression of CD74 in colorectal cancerWe further validated CD74 expression in colorectal cancer using Real-Time PCR and Western blot. The results were consistent with the above (Fig. 2A, B). Both qPCR and WB results showed decreased expression of CD74 in colorectal cancer.
Fig. 2
CD74 expression in colorectal cancer. A The mRNA relative expression level of CD74 in colorectal cancer. B Expression of CD74 protein levels. N1-3 is normal tissue, T1-3 is tumor tissue
3.3 Multiple prognostic value analysis of CD74We have statistically examined the expression of CD74 in the whole cancer dataset and correlated it with patient prognosis. Survival indicators include DFI, PFI, DSS and OS. Cox regression analysis showed that CD74 expression was remarkably linked to OS in 10 cases of cancer (Fig. 3A), including LGG, UVM, THYM, LAML, SKCM, CESC, LUAD, BRCA, SARC and UCEC. Further, CD74 was a high-risk gene in LGG (hazard ratio = 1.42), UVM (hazard ratio = 1.47), THYM (hazard ratio = 4.3), LAML (hazard ratio = 1.24). To investigate the effect of CD74 expression expression on OS, we performed a KM analysis, which showed that in patients with higher CD74 expression in UVM (Fig. 3B), LGG (Fig. 3C), LAML (Fig. 3F) and THYM (Fig. 3J), the 5 year survival rate was lower.In CESC (Fig. 3D), BRCA (Fig. 3E), LUAD (Fig. 3G), SARC (Fig. 3I) and SKCM (Fig. 3H), higher levels of CD74 in patients were associated with better OS.
Fig. 3
The relationship between the level of CD74 and OS in tumor patients. A OS related forest map. B–J Kaplan—Meier survival curves in UVM, LGG, CESC, BRCA, LAML, LUAD, SKCM, SARC and THYM
We also evaluated the association between CD74 levels in all tumors and DSS in cancer patients, and found that CD74 expression affected DSS in LGG, UVM, THYM, SKCM, BRCA, CESC, LUAD and ACC (Fig. 4A). In LGG (Fig. 4C), THYM (Fig. 4G) and UVM (Fig. 4I), higher levels of CD74 in patients were associated with poorer DSS. In CESC (Fig. 4D), BRCA (Fig. 4E), LUAD (Fig. 4F), SKCM (Fig. 4H) and ACC (Fig. 4B), higher levels of CD74 in patients were associated with better DSS.
Fig. 4
The relationship between the level of CD74 and DSS in tumor patients. A DSS related forest map. B–I Kaplan—Meier survival curves in ACC, LGG, CESC, BRCA, LUAD, THYM, SKCM and UVM
In addition, we found that the expression of CD74 affected the DFI of three cancers (Fig. 5A), including BLCA, LIHC and BRCA. In BLCA (Fig. 5B), BRCA (Fig. 5C) and LIHC (Fig. 5D), higher levels of CD74 in patients were associated with better DFI.
Fig. 5
Association between the CD74 expression and the DFI of cancer patients. A Forest plot of DFI associations in 33 types of tumor. B–D Kaplan–Meier survival curves of DFI for patients stratified by the different expressions of CD74 BLCA, BRCA and LIHC
We also found that the expression of CD74 affected the PFI of 11 cancers (Fig. 6A), including LGG, GMB, THYM, PRAD, PCPG, SKCM, ACC, BRCA, LUAD, HNSC and LIHC. In GMB (Fig. 6B), LGG (Fig. 6C) and THYM (Fig. 6G), higher levels of CD74 in patients were associated with poorer PFI. Patients with increased CD74 levels showed superior PFI to those with decreased CD74 levels in ACC (Fig. 6D), BRCA (Fig. 6E), LUAD (Fig. 6F), SKCM (Fig. 6H) and LIHC (Fig. 6I).
Fig. 6
Association between the CD74 expression and the PFI of cancer patients. A Forest plot of PFI associations in 33 types of tumor. B–I Kaplan–Meier survival curves of PFI for patients stratified by the different expressions of CD74 GMB, LGG, ACC, BRCA, LUAD, THYM, SKCM, LIHC
3.4 Correlation analysis of CD74 expression and immune cell infiltration in pan-cancerTo clarify the association of CD74 with immune response, we analyzed the relationship between CD74 expression in each tumor and infiltration of immune cells using the Timer method of the IOBR package in R software. CD74 expression was significantly correlated with infiltration of immune cells. Importantly, CD74 expression was significantly positively correlated with M1 macrophages in all cancers except DLBC, LAML, and CHOL (Fig. 7A and Supplementary Fig. 2). CD74 expression was significantly negatively correlated with native CD4 T cell in all tumors except LAML, STAD, MESO, UCS, CHOL, DLBC, KICH, LUAD, PCPG, PAAD and KIRP. The results of MHC, EC, SC, CP, AZ, and IPS infiltration scores for each tumor showed that CD74 expression in most tumors was positively correlated with MHC, EC, and negatively correlated with SC, CP (Fig. 7B). This suggests that our abnormal expression of CD74 can affect numerous immune responses.
Fig. 7
Immune cell infiltration analysis. A CIBERSORT method was used to compare the relationship between CD74 expression and tumor invasion of different immune cells. B MHC, EC, SC, CP, AZ, IPS infiltration score of each tumor was assessed by deconvo_ips method. The asterisks indicate a statistically significant p-value calculated using spearman correlation analysis. *P < 0.05
3.4.1 Correlation analysis with immunescoreWe further analyzed the relationship between the expression of CD74 and ImmuneScore, and StromalScore. The results showed that CD74 expression in most tumors was significantly and positively correlated with ImmuneScore (Fig. 8), StromalScore (Supplementary Fig. 3).
Fig. 8
The relationship between CD74 expression and ImmuneScore. The results showed that CD74 expression in most tumors was significantly and positively correlated with ImmuneScore
3.5 Relationship between CD74 expression and immunomodulatorsImmune checkpoints can affect the prognosis of cancer patients. Tumors evade immune responses through immune checkpoints such as PD-1 and PD-L1 [24]. We evaluated the correlation of CD74 expression with immunomodulators to clarify the immune function of CD74, which is essential to identify the tumor types for CD74 immunotherapy. The results of the study showed that CD74 expression in pan-cancer was positively correlated with most immune checkpoints (Fig. 9). Specifically, all tumors were positively correlated with CTLA4. All prognosis-related cancers except LAML were positively correlated with 6 immune checkpoints of CD27, TNF, CXCL9, CD40LG, TIGIT and SELP. All prognosis-related cancers except LAML and THYM were positively correlated with 3 immune checkpoints of ICOS, CD28 and PDCD1.
Fig. 9
Correlation between CD74 and 60 immunomodulators (Inhibitory(24)、Stimulatory(36)). The asterisks indicate a statistically significant p-value calculated using spearman correlation analysis. The upper left corner of each square represents the correlation coefficient by color change, and the lower right corner is the p-value by color change; p < 0.05 indicates statistical significance. *P < 0.05
3.6 Correlation of CD74 expression with TMB and MSIWe also investigated the relationship between CD74 and TMB, MSI, two new biomarkers relevant to immunotherapy. We found that CD74 expression was positively correlated with TMB expression in many tumors, such as COAD and THYM. In addition, LUAD and ACC were negatively correlated with it (Fig. 10A). Finally, the findings demonstrated that CD74 expression was correlated with MSI, indicating that high CD74 expression in TGCT, UCS, CHOL, PAAD, HNSC, LUSC and OV was negatively correlated with MSI and positively correlated in COAD (Fig. 10B).
Fig. 10
Associations between CD74 expression and tumor mutational burden (TMB) and microsatellite instability (MSI). A The association between CD74 expression and TMB levels in tumors. B The association between CD74 expression and MSI event in tumors
3.7 GSEA of CD74 analysisTo investigate the biological function of CD74 expression in different tumor tissues, we evaluated the pathway through which CD74 may involve using GSEA. The results showed that in LIHC, CD74 was significantly associated with IL6/JAK2/STAT3 signaling pathway, epithelial mesenchymal transition, apoptosis, DNA repair, P53 signaling pathway, antigen presentation, chemokine signaling pathway, and B and T cell receptor signaling pathway (Fig. 11A–C). It is important to note that many of the same pathways can be found in the GSEA analysis of STAD. It gates mostly associated with immune signaling pathway, inflammatory factor related pathways, P53 signaling pathway, epithelial-to-mesenchymal transition (Supplementary Fig. 4). These remarkable pathways may be the key pathways underlying the involvement of CD74 in tumorigenesis and development.
Fig. 11
Analysis results of GSEA. A HALLMARK analysis of CD74 in LIHC. B GO functional annotation of CD74 in LIHC. C KEGG pathway analysis of CD74 in LIHC. The chart above shows only some of the results. Peaks on the upward curve indicate positive regulation and peaks on the downward curve indicate negative regulation. Here we show only a few of these signaling pathways
留言 (0)