Study populations
The National Health and Nutrition Examination Survey (NHANES) is a national initiative of the National Center for Health Statistics (NCHS) that focuses on the nutritional and health conditions of the U.S. civilian population every two years, with the goal of providing a comprehensive understanding of the contemporary spectrum of disease to inform public health policy. Additionally, from a total of 101,316 baseline individuals in the NHANES (1999–2018), participants were excluded for the following reasons: (1) age < 20 years (n = 47,207); (2) lack of data on patients with diabetes and hypertension (n = 20,963); and (3) missing records of blood glucose, diastolic blood pressure (DBP), total cholesterol (TC), LDL-C, systolic blood pressure (SBP), and CRP (n = 19,420). The current study also obtained data from the China Health and Retirement Longitudinal Study (CHARLS 2015), which is a nationwide demographic cohort study of Chinese people aged over 45 years, with four regular surveys conducted every six months (http://charls.pku.edu.cn/). We selected the baseline individuals in the CHARLS (n = 21,097). The exclusion criteria for individuals were as follows: (1) < 45 years of age (n = 86), extreme BMI levels (> 55 or < 15 kg/m2) (n = 57), or DBP > SBP (n = 16); (2) lack of data on SBP and DBP (n = 4,689); and (3) lack of data on TC, uric acid (UA), HDL-C, LDL-C, CRP, glucose, and haemoglobin A1c (HbA1c), as well as missing records of covariates (n = 12,285). Finally, 13,726 participants in the NHANES and 3,964 participants in the CHARLS were eligible for this cross-sectional analysis. All participants supplied written informed consent in two large surveys, and two surveys were administered in conformity with the 1975 Helsinki Declaration.
Exposure and outcome variables
In the fasting state, blood specimens were collected by professional medical workers and measured in the central laboratory. The TyG index was computed using the following formula: Ln (glucose [mg/dL]×triglycerides [TG] [mg/dL]/2) [22]. The formula for non-HDL-C was TC minus HDL-C. The main outcome of this study was arterial stiffness. Arterial stiffness was represented by ePWV. The ePWV was calculated using a coordinate Eqs. [23, 24]: mean blood pressure (MBP) was computed as DBP + 0.4×(SBP − DBP). ePWV = 9.587 – (0.402 × age) + (4.560 × 10− 3× age2) − (2.621 × 10− 5 × age2 × MBP) + (3.176 × 10− 3×age × MBP) − (1.832 × 10− 2× MBP). Increased arterial stiffness was defined as elevated ePWV, which was defined as a level higher than the 75th percentile of ePWV [25].
Data collection
Information on demographic elements (including sex, age and race/ethnicity), health habits (history of drinking and smoking), health situations (diabetes and hypertension) and medical history (antihypertensive treatment and antidiabetic treatment) was acquired via face-to-face interviews and a standardized questionnaire.
The primary anthropometric indicators that were measured in this study were blood pressure (mm Hg), height (meter, m) and body weight (kilogram, kg). Body weight [kg]/height squared [m2] is the formula applied to calculate the body mass index (BMI). Individuals were asked to rest quietly for five minutes before blood pressure was measured; moreover, three measurements of DBP and SBP were made, and their mean values were documented.
Fasting blood samples were collected for tests of UA, TC, CRP, HDL-C, TG, LDL-C, glucose, and HbA1c.
Statistical analysis
To get precise estimates that are typical of both the Chinese and U.S. populations, all of the analyses were computed using the proper sample weights. Normally distributed clinical data are presented as the mean ± standard deviation (SD), and nonnormally distributed data are described as the median and interquartile range (IQR). Quantitative variables are described as counts and percentages (%). As appropriate, to explore variations in baseline characteristics across groups, categorical and continuous variables were compared via Student’s t test, the Mann‒Whitney U test and the chi‒square test, respectively.
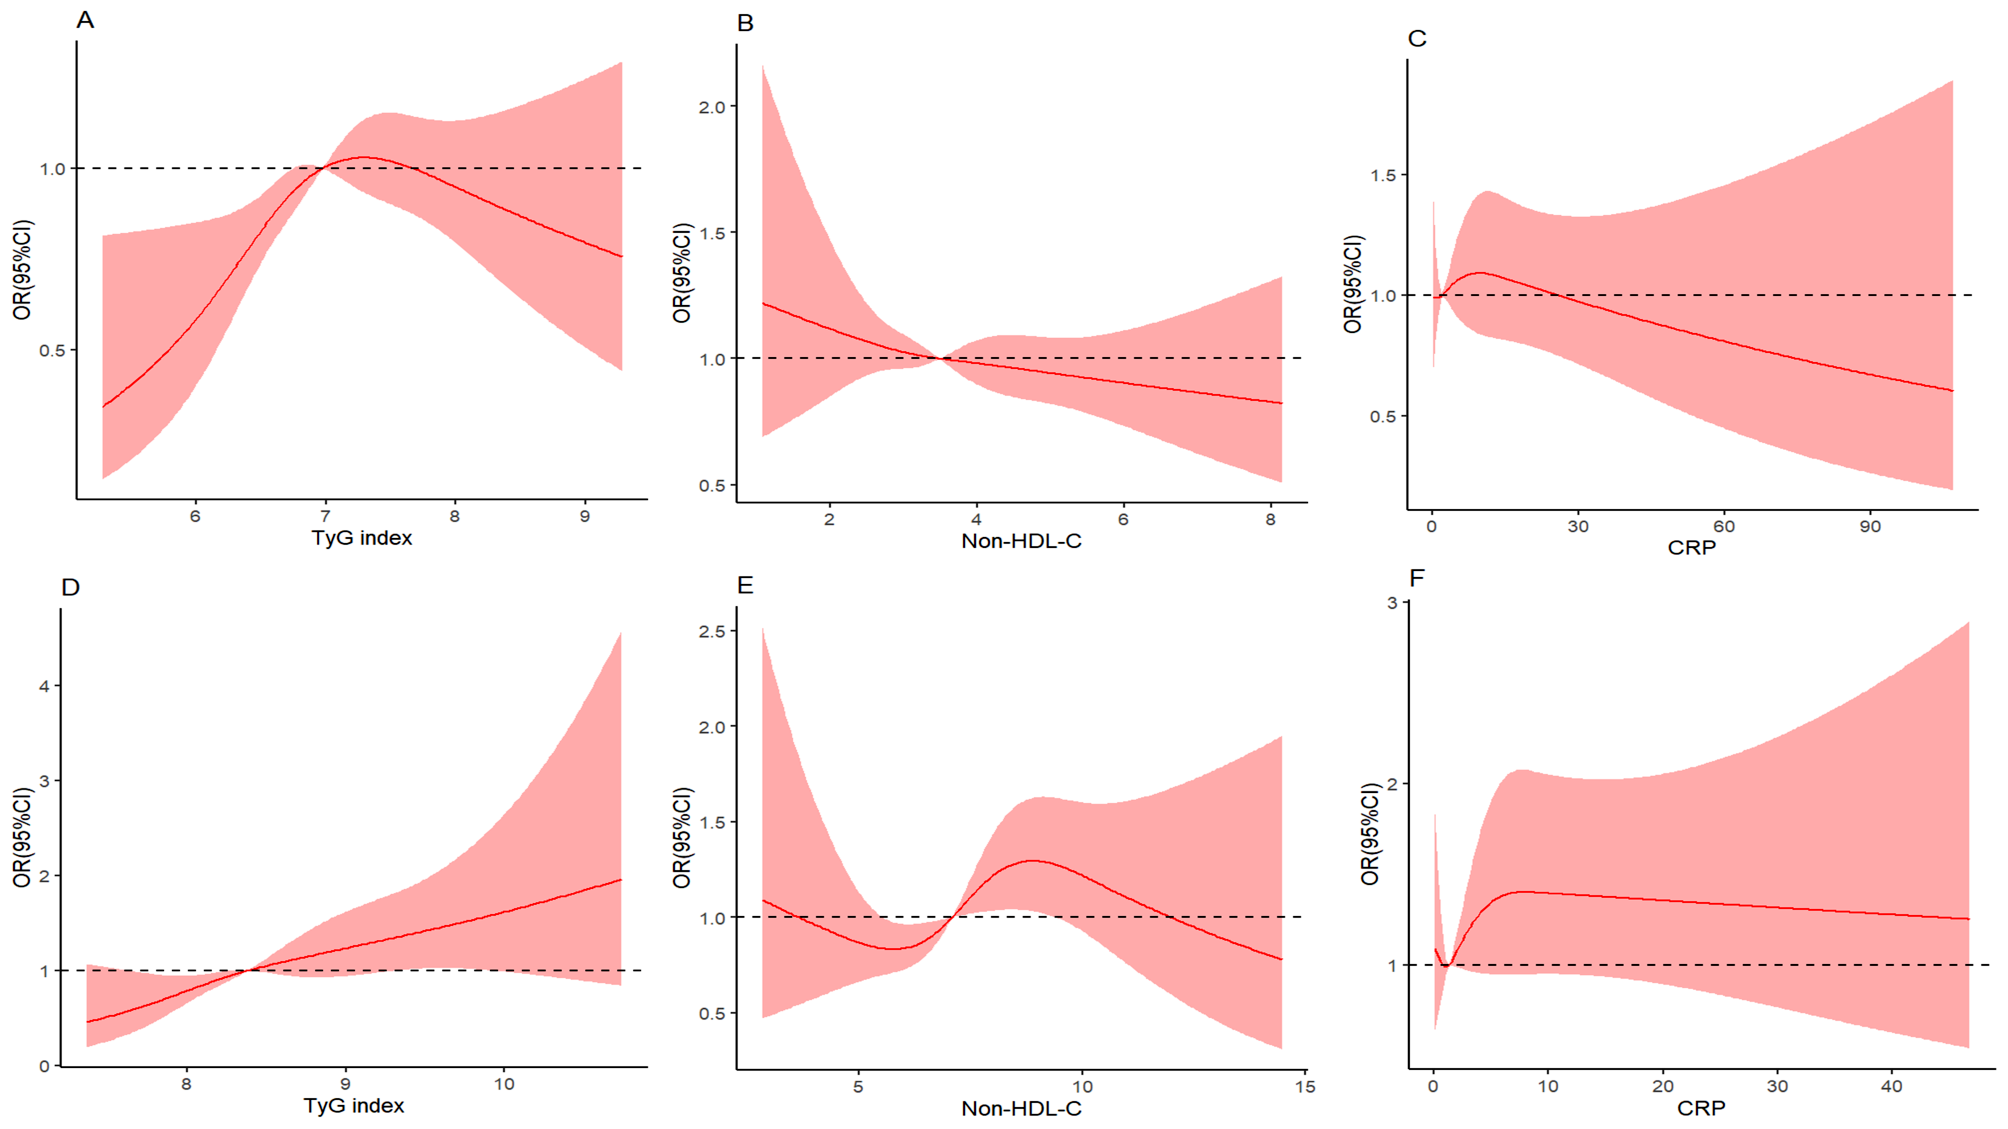
The TyG index and non-HDL-C and CRP levels were grouped into quartiles (Q1, Q2, Q3 and Q4). Weighted multiple logistic regression/linear models were used to measure odds ratios (ORs)/β coefficients and 95% confidence intervals (CIs) for the relationships of the TyG index, non-HDL cholesterol, and CRP with increased arterial stiffness, including fully adjusted model (Model 2) and an unadjusted model (Model 1). Alcohol consumption, smoking status, BMI, sex, age, UA, HbA1c, diabetes status, hypertension status, antihypertensive treatment, and antidiabetic treatment were adjusted for in Model 2. When considering that antihypertensive treatment affects SBP and DBP and thereby alters ePWV, sensitivity analyses were applied to verify the relationship between the TyG index and arterial stiffness after excluding patients treated with antihypertensive agents. The nonlinearity of the relationship between the four variables was estimated utilizing restricted cubic spline (RCS) regression. A P value < 0.05 indicated a nonlinear dose‒response association. The TyG index, CRP and non-HDL-C were classified into two groups based on the median value in the corresponding populations. Afterwards, individuals were classified into eight groups based on combined evaluation of the TyG index and CRP and non-HDL-C values. Then, more stringent clinical cut-off values for non-HDL-C (3.4 mmol/L) in the NHANES and cut-off values for non-HDL-C (4.9 mmol/L) in the CHARLS were employed to estimate the relationships of the discordant/concordant TyG index, CRP, and non-HDL-C groups with increased arterial stiffness for sensitivity analysis. The study performed subgroup analyses in terms of sex (male/female), age (</≥ 60 years), BMI (</≥ 30 kg/m2), HbA1c (</≥ 6.5%), and antihypertensive treatment (yes or no) and interaction tests to estimate underlying alterations.
Insulin resistance can influence arterial stiffness through a proinflammatory state and dyslipidaemia. Mediation analysis was applied to estimate whether this association was mediated by non-HDL-C and CRP. Bootstrap analysis was utilized to estimate the mediating impacts [26]. Four different preprogrammed routes were used, including indirect (routes 2, 3, and 4) and direct (route 1) mediation effects, and their β coefficients were assessed: Route 1, TyG index (exposure)→increased arterial stiffness (outcome); Route 2, TyG index (exposure)→non-HDL-C (mediator)→ increased arterial stiffness (outcome); Route 3, TyG index (exposure) → CRP (mediator) → increased arterial stiffness (outcome); Route 4, TyG index (exposure) → non-HDL-C (mediator) → CRP (mediator) →increased arterial stiffness (outcome). The significance threshold was set at P < 0.05. R statistical software (version 4.3.2) and IBM SPSS software (version 25) were utilized to conduct the data analysis.

留言 (0)