
記住我
NHANES is a project of the National Center for Health Statistics that provides a thorough and continuous assessment of the health and nutrition of the American population. A sophisticated stratified sampling methodology was applied in the NHANES to enhance the accuracy and reliability of representative samples. Comprehensive data, including socioeconomic status, demographic characteristics, dietary habits, and health-related information, are collected by trained personnel. All participants must provide signed consent forms in order to participate in the study.
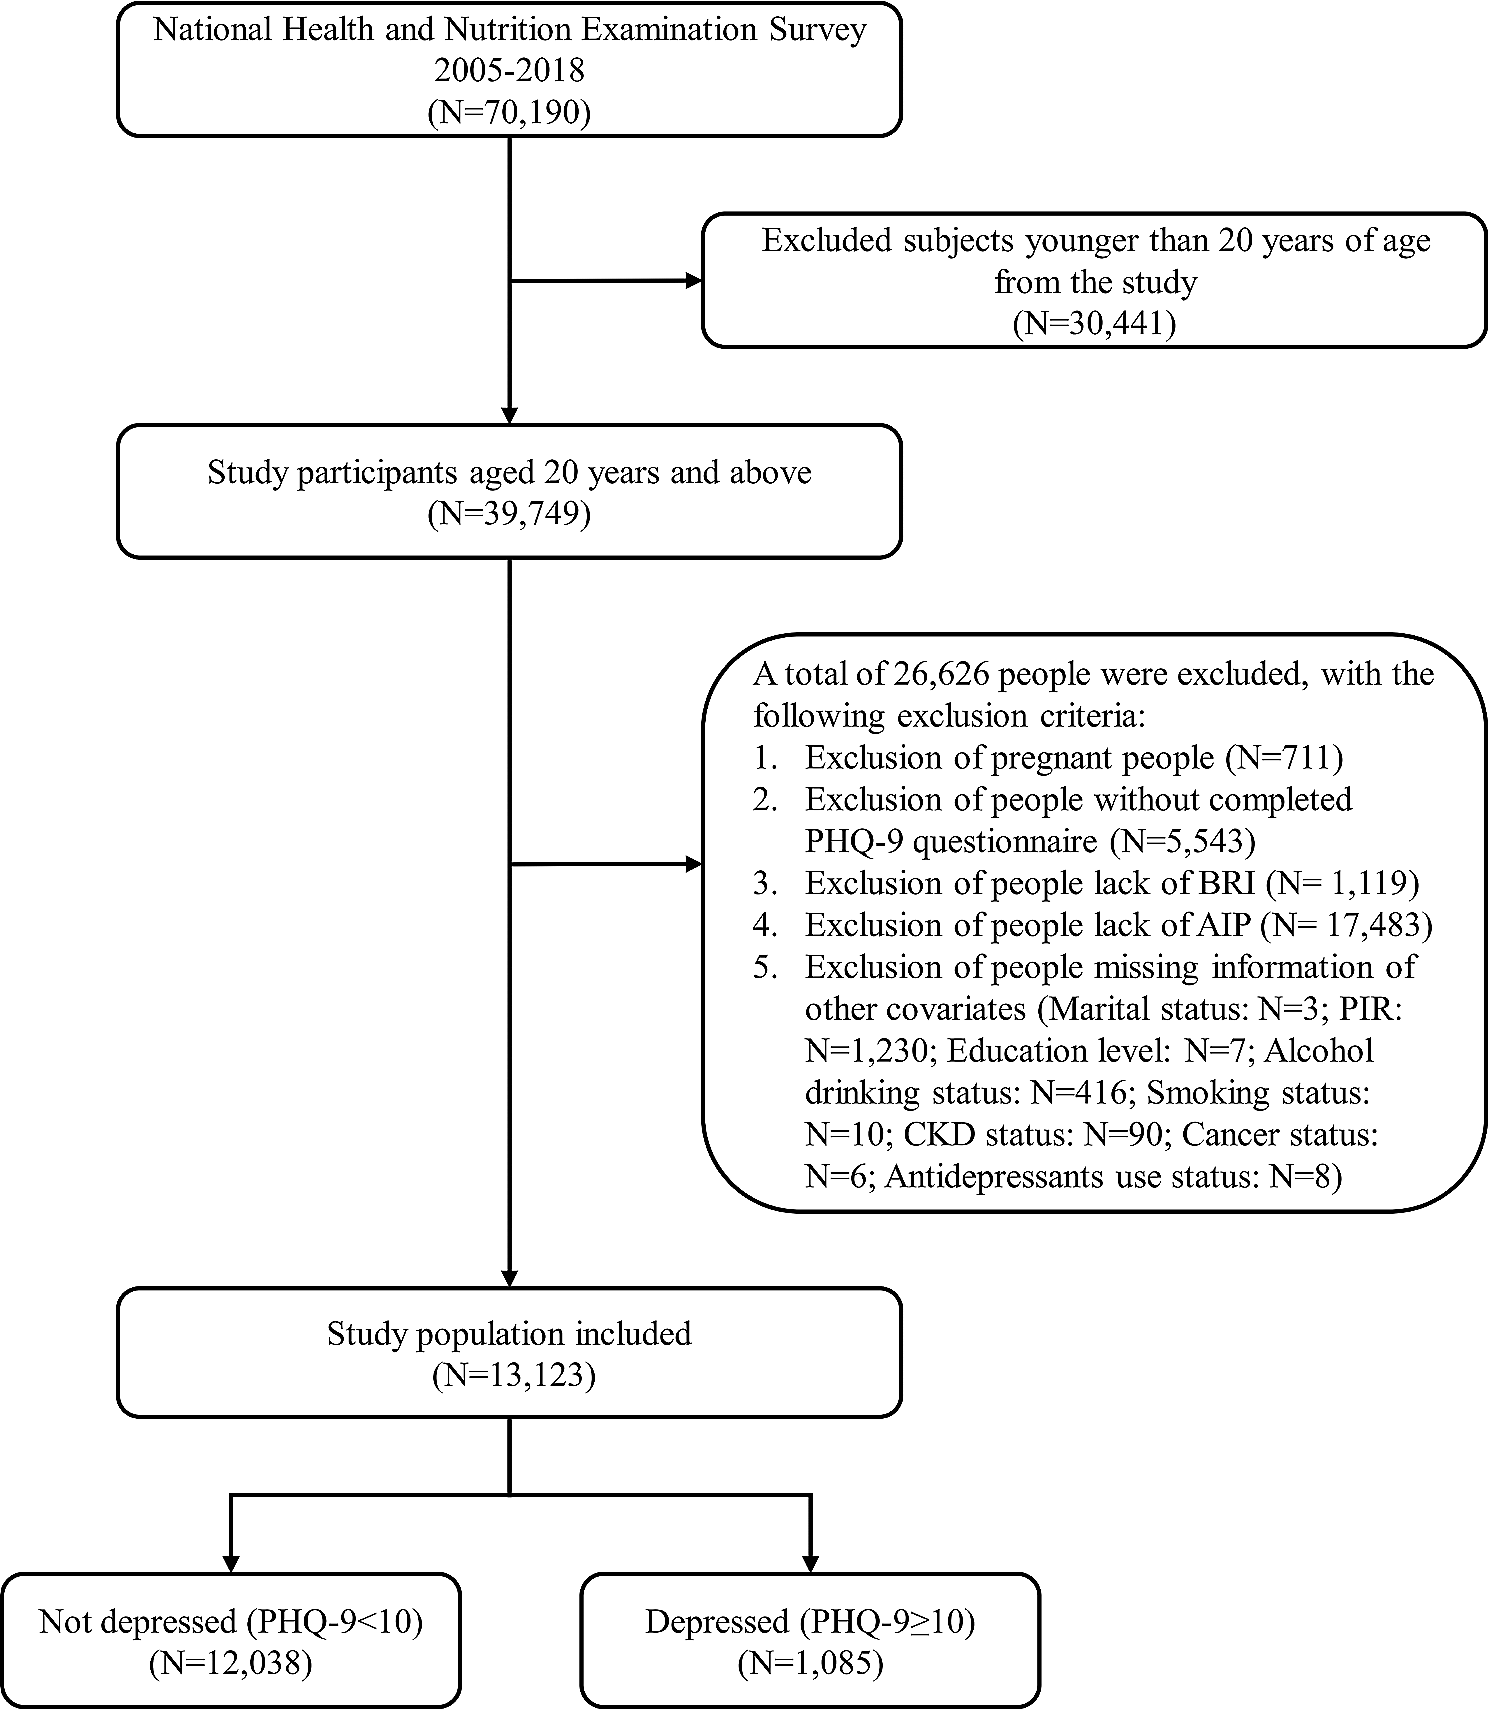
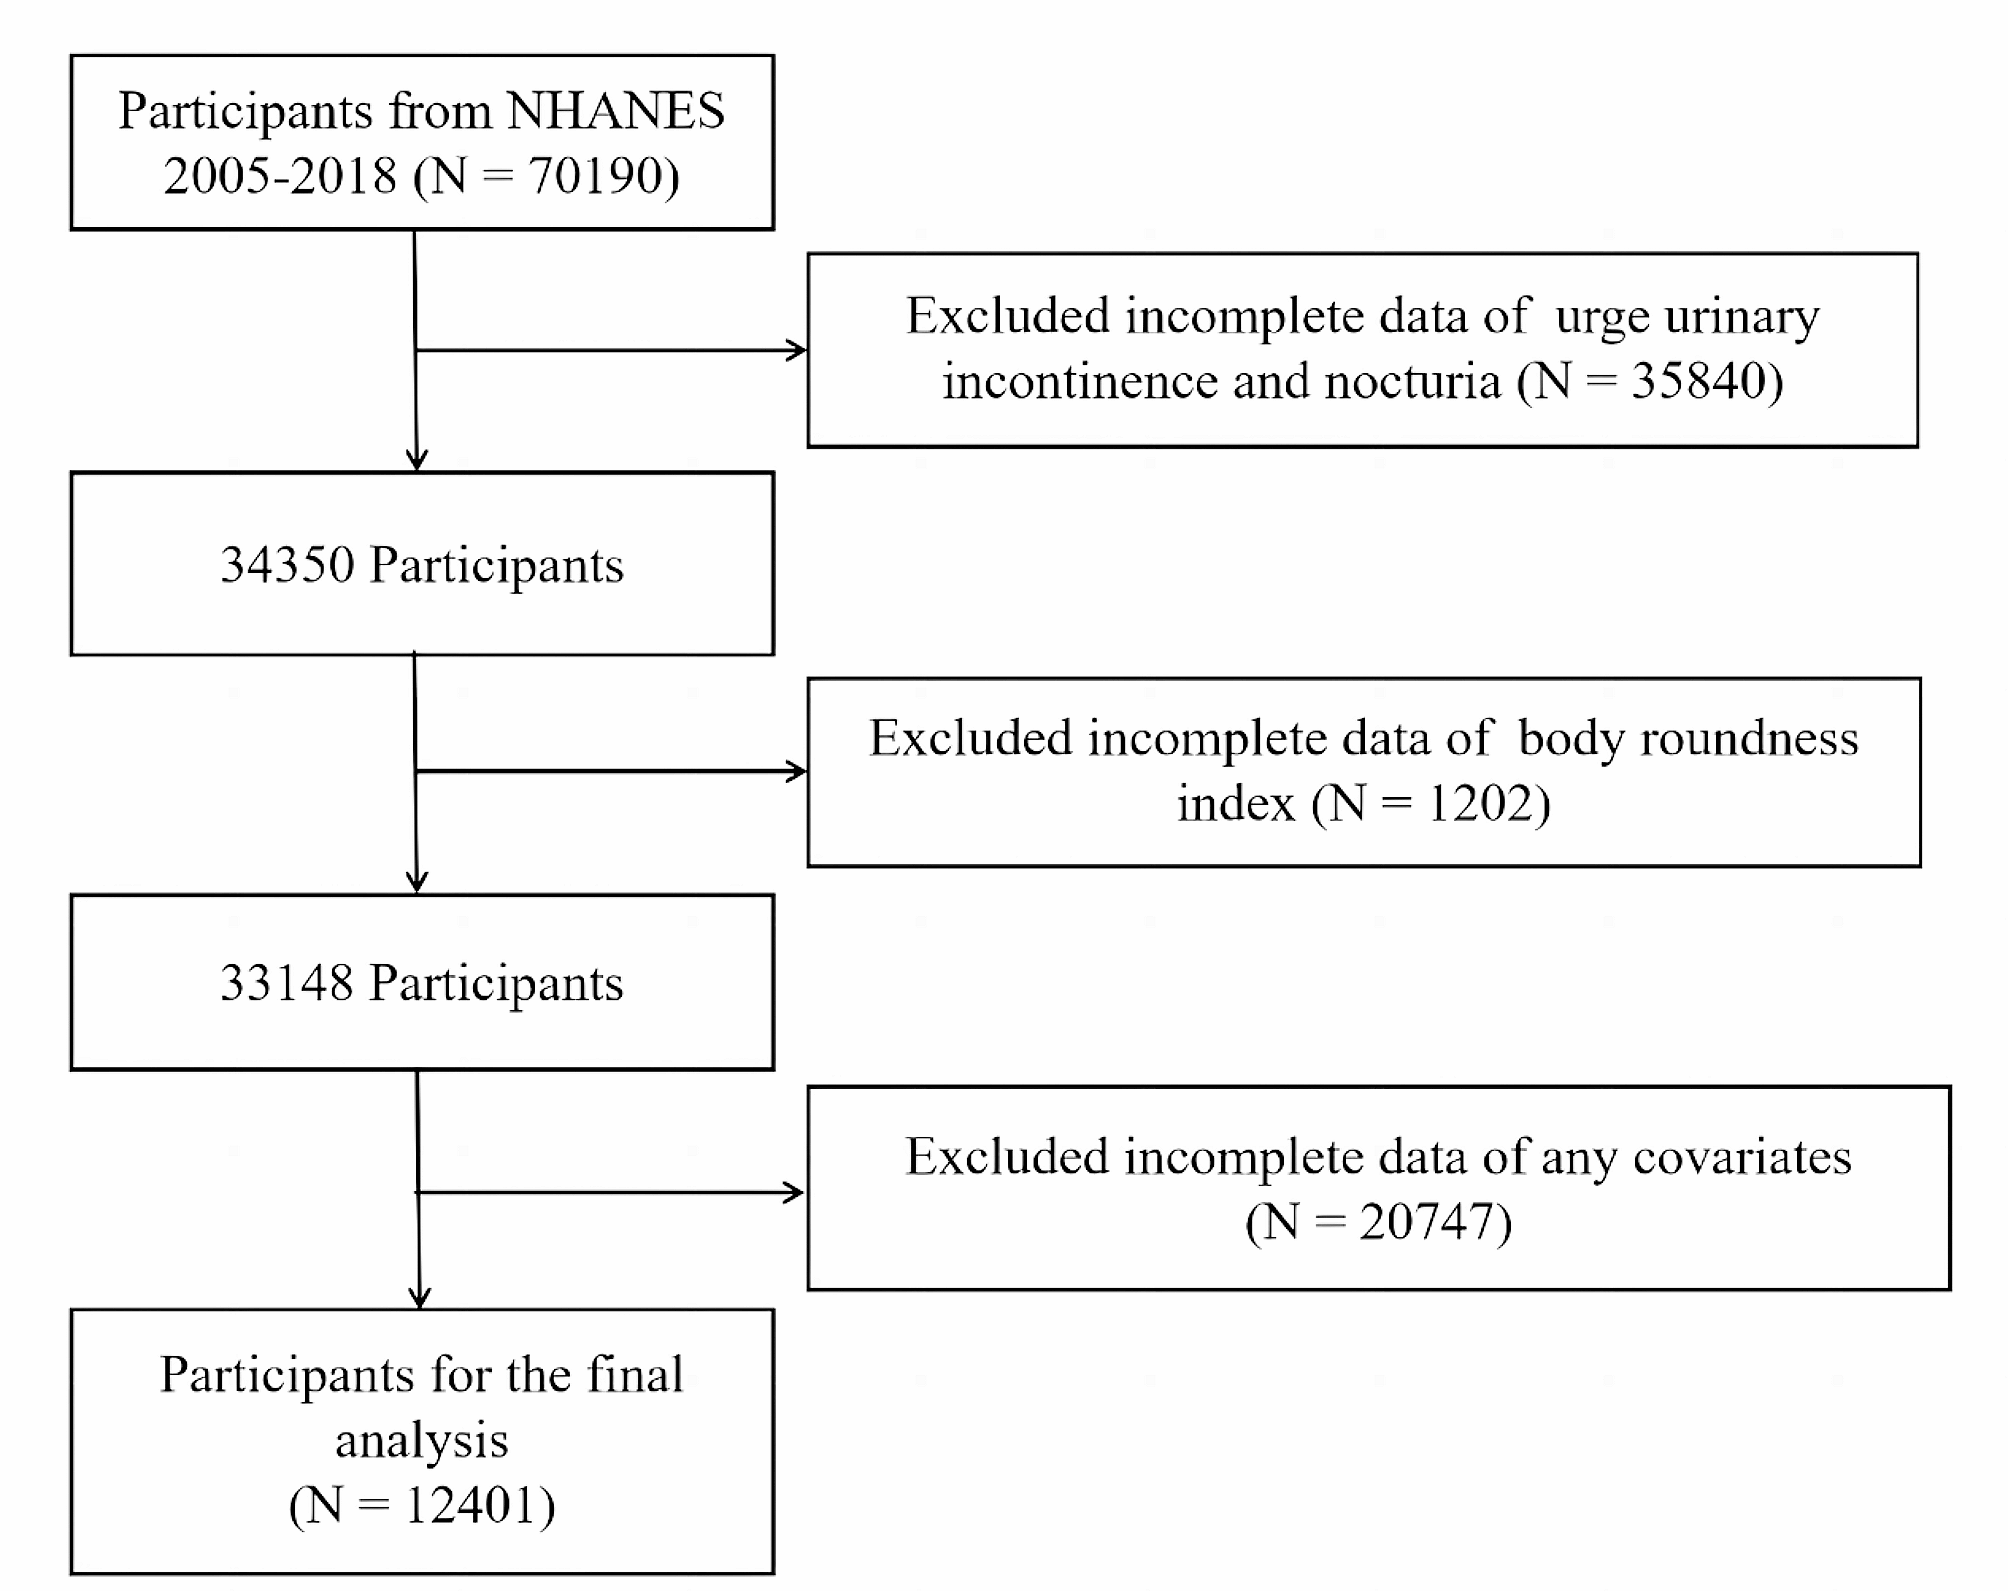
This study utilized data from the NHANES cycles from 2005 to 2018, aligning with the availability of Patient Health Questionnaire-9 (PHQ-9) from 2005 to 2018. The present investigation included a total of 70,190 participants from these cycles. In the analysis, 30,441 participants under the age of 20 years were excluded. Additionally, 771 pregnant individuals were excluded due to alterations in blood lipid profiles, WC, and depression status. Those with missing PHQ-9 data (n = 5,543), BRI data (n = 1,119), and AIP data (n = 17,483) were also omitted. Individuals without information on covariates such as alcohol consumption status, smoking status, poverty income ratio (PIR), marital status, and education level were excluded (n = 1,770) (Fig. 1). Ultimately, this study included 13,123 individuals.
Fig. 1
Flowchart of the sample selection from NHANES 2005–2018
Ascertainment of depressionThe PHQ-9 [21] is a questionnaire widely used for screening depression. It consists of a total of 9 questions, graded on criteria from 0 to 3, resulting in a cumulative score scale from 0 to 27. A total score of 10 or higher was indicative of the presence of depression [21]. This cut-off point is commonly used in epidemiological research for the identification of individuals with depression and has been validated through clinical assessment [21].
Ascertainment of the BRIThe model proposed by Thomas et al. was used to calculate the BRI [8]. This model incorporates two primary variables (height, and WC), to evaluate visceral fat content. A higher BRI indicates a greater accumulation of visceral fat. The specific mathematical formula for BRI calculation is as follows: 364.2-365.5 × (1-[WC (m)/2π]2/[0.5×height(m)]2)½. The BRI is categorized into four levels, ranging from low to high with the quartile intervals as follows: Q1 (1.19 ~ 3.82), Q2 (3.82 ~ 5.07), Q3 (5.07 ~ 6.67), and Q4 (6.67 ~ 19.00).
Ascertainment of the AIPThe calculation of the AIP is based on indicators of high-density lipoprotein cholesterol (HDL-C) and triglyceride (TG) levels in the blood. The specific mathematical formula for AIP calculation is as follows: log10 [TG (mmol/L)/HDL-C (mmol/L)] [14].
CovariatesIn this study, the covariates included demographic characteristics (age, sex, and race), socioeconomic indicators (marital status, PIR, and education level), alcohol consumption status, smoking status, antidepressant use, and health conditions. Marital status was categorized as coupled (including married or living with a partner) and single/separated (including never married, separated, divorced, or widowed). Race was classified as non-Hispanic Black, non-Hispanic Asian, non-Hispanic White, other Hispanic (including Mexican American), or other. The participants’ education level was divided into three levels: less than high school, high school, and above high school. The PIR was grouped into three categories: < 1.30, 1.31 ~ 3.50, and > 3.50, with a higher PIR reflecting a better family economic status [22, 23]. Alcohol consumption condition was categorized into three groups: never drinkers (those who had consumed < 12 times in their lifetime), former drinkers (those who had consumed ≥ 12 times in a year but had not consumed any alcohol in the past year or did not consume alcohol in the last year but had consumed ≥ 12 times in their lifetime), and current drinkers (those who currently consumed at least one drink) [24, 25]. Detailed information on smoking status, diabetes status, CVD status, chronic kidney disease (CKD) status, cancer status, and antidepressant use is provided in Table S1.
Statistical analysisTo enhance the representativeness of the research results, we followed the NHANES official recommended weighted procedures to process the data in this study. Based on the PHQ-9 scores of the participants, this study classified them into two groups: depression and non-depression [21]. Statistical analysis was conducted using Student t tests to compare the continuous variables and chi-square tests to compare the categorical variables between the two groups. To explore the relationship between the BRI and depression, weighted linear regression models (for continuous PHQ-9 scores) and logistic regression models (for depression) were used in the three statistical models to estimate the 95% confidence intervals (CIs) and adjusted odds ratios (ORs). Model 1 served as a crude model with no adjustments of variables. Model 2 was adjusted for sociodemographic factors (age, sex, and race) [26]. Model 3 was more adjusted for the PIR, marital status, education level, alcohol consumption status, smoking status, CVD status, diabetes status, CKD status, cancer status, and antidepressant use. In these models, when the BRI was considered an ordered four-category variable, trend tests were also conducted. Additionally, restricted cubic spline (RCS) analysis was conducted to determine whether the association between BRI and depression is linear. We also conducted subgroup analyses to assess the influence of the BRI on depression concerning several stratified covariates, including age (category), sex, PIR, education level, and disease status (diabetes, CVD, CKD, and cancer).
The two-step mediation analysis was used to evaluate the mediating effect of AIP. Firstly, a fully adjusted regression model was employed to investigate the impact of the BRI on AIP as well as the impact of the AIP on depression, aiming to ascertain the potential of the AIP to serve as a mediating factor between the BRI and depression. Subsequently, mediation analysis was conducted using the RMediation package to assess the indirect, direct, and overall effect of the BRI on depression mediated by the AIP [27]. After dividing the indirect effect by the total effect, the percentage of the mediating effect mediated by the AIP was determined. The 95% CI for the mediated proportion was estimated through nonparametric bootstrapping with 1000 iterations.
All statistical analyses were conducted using the R software (version 4.2.3). When the two-sided P value ≤ 0.05, it is considered statistically significant.
留言 (0)