
記住我


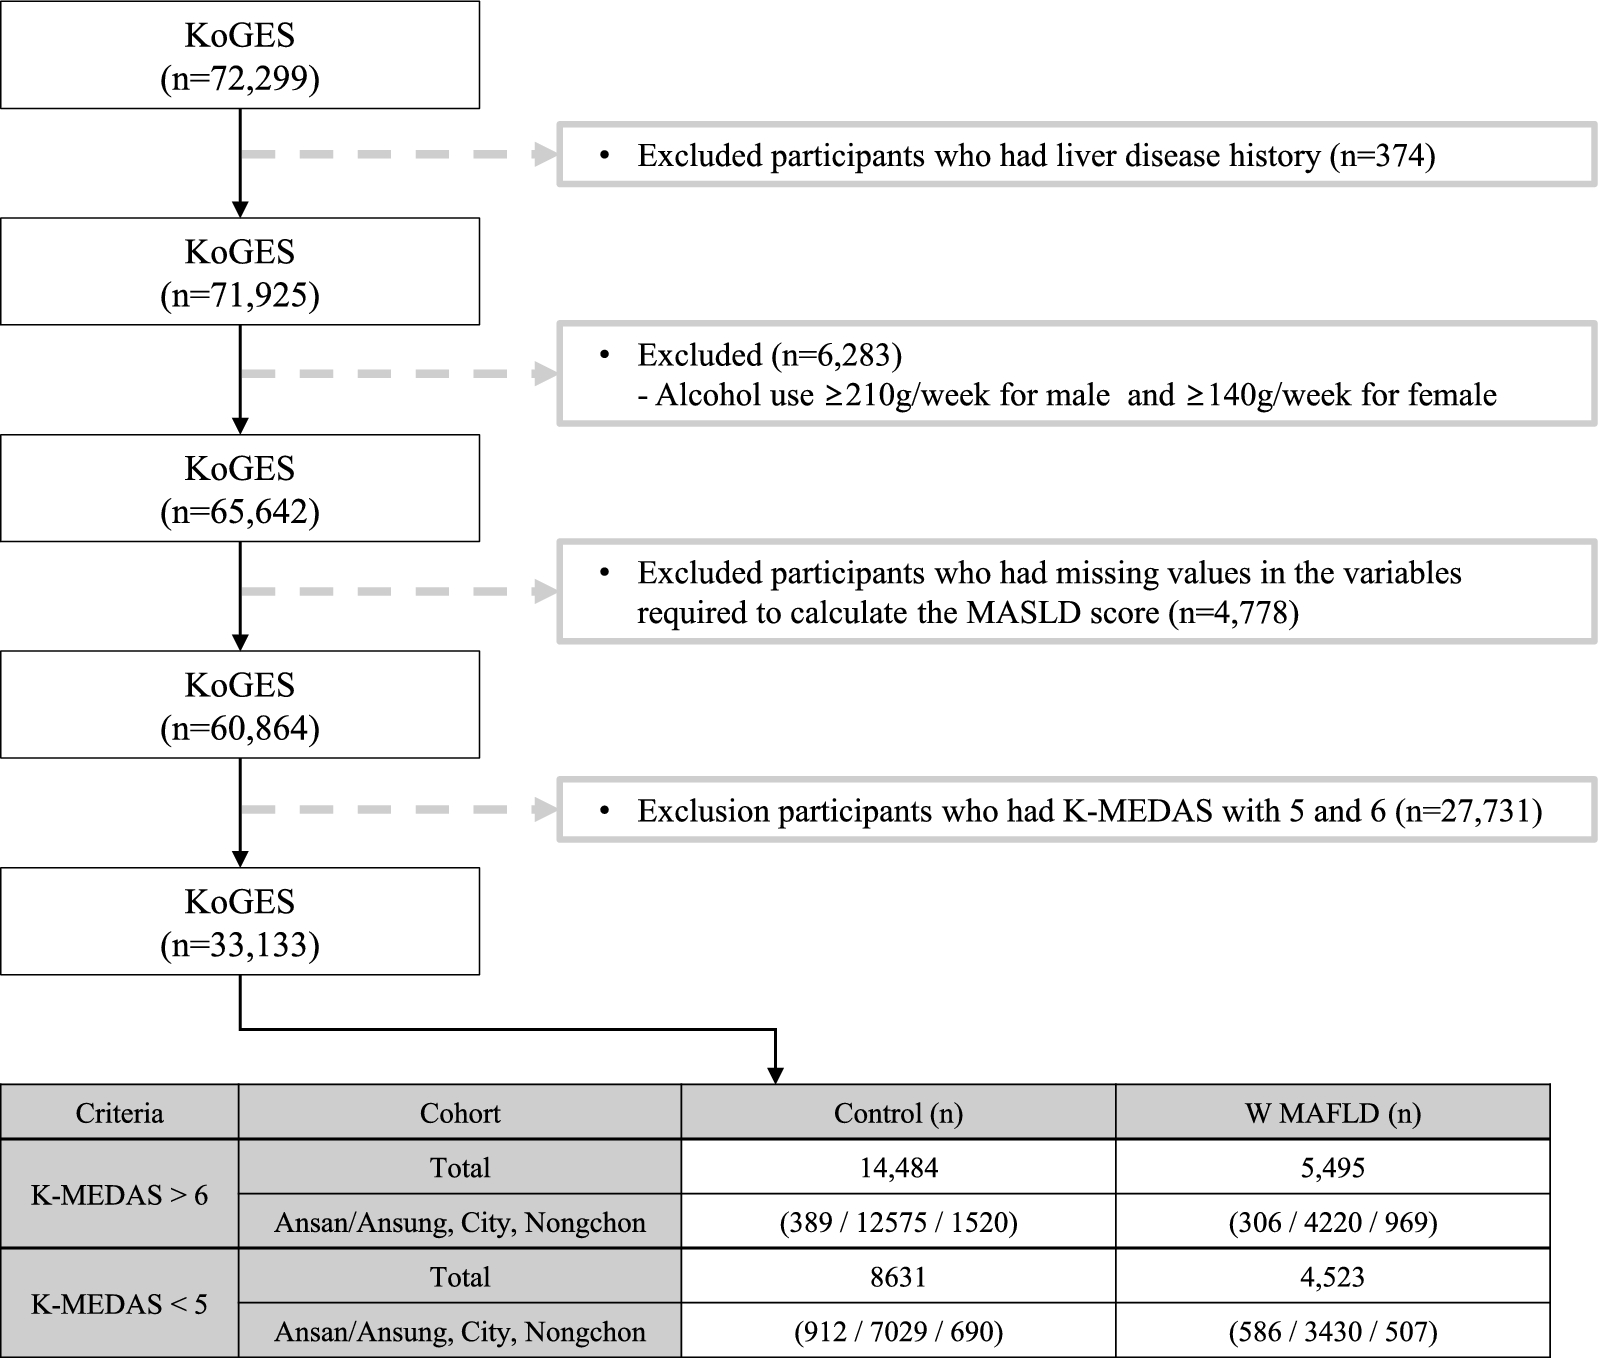

The study flowchart was shown in Fig. 1. Baseline characteristics of the 519 EOC patients in the discovery phase and 520 EOC patients in the validation phase were exhibited in Additional file 1: Table S2. After quality control, up to 19,290 (1,135 genotyped and 18,155 imputed) SNPs in 199 genes were available for further analysis in the discovery stage. In the single-locus analysis using an additive genetic model with adjustment for clinical variables, including age at diagnosis, stage, histology, grade, residue (optimal debulking < 1 cm), ascites and neoadjuvant chemotherapy, a total of 1,083 OS-associated SNPs were identified after multiple test correction by BFDP. However, none of these SNPs remained significant for FDR due to a high level of LD among these SNPs after imputation. These results were summarized in a Manhattan plot (Additional file 2: Fig. S1). Furthermore, we validated the most promising SNPs identified from the discovery group. Ultimately, two SNPs passed the BFDP correction in the validation stage for final analysis. Additionally, both SNPs showed significance in the meta-analysis of the two datasets with no observed heterogeneity (Table 1).
Fig. 1
The study analysis flowchart
Table 1 SNPs of DSB repair pathway associated with survival of EOC patientsThen, we performed the LD analysis between these two SNPs by using haploview, and GEN1 rs56070363 was chosen as the tag-SNP for further analysis, which was significantly associated with OS of EOC patients (adjusted HR = 2.50, 95% CI 1.57–3.97, and P < 0.001) in an additive genetic model in the combined dataset using stepwise multivariate Cox regression analysis (Table 2).
Table 2 Stepwise multivariate Cox regression analysis for the identification of significant SNPs in EOC patientsGenetic associations of GEN1 rs56070363 with EOC survivalAmong all patients, the frequencies of GEN1 rs56070363 genotype (CC, CT, TT) were 94.7%, 5.1% and 0.2% respectively, and the allele frequencies (C and T) were 97.2% and 2.8% respectively. Univariate analysis indicated a significant reduction in OS for patients with the GEN1 rs56070363 mutant genotype (CT + TT). The Kaplan Meier survival curves of different groups were shown in Additional file 3: Fig. S2. In the multivariable analysis, adjusting for clinical variables and significant principal components, the GEN1 rs56070363 CT + TT genotype was associated with poorer OS compared to the CC genotype (adjusted HR = 2.37, 95% CI 1.53–3.66 and P < 0.001, Table 3). Subsequently, we evaluated the impact of GEN1 rs56070363 on OS using different genetic models. The results revealed a significant correlation between GEN1 rs56070363 and OS under the dominant model, leading us to employ this model in subsequent analyses.
Table 3 Genetic associations of GEN1 rs56070363 with survival of EOC patientsStratified analysis between unfavorable genotypes and EOC survivalTo optimally identify patients who would most benefit our survival prediction model, we performed stratified Cox regression analysis. This analysis aimed to pinpoint subgroups among all EOC patients who might experience prolonged survival, with adjustments made for various covariates. The results of this stratified analysis for GEN1 rs56070363 were shown in Table 4. No interactive effects between other covariates and OS were identified, suggesting that significant associations with OS were more evident in patients with high-grade (adjusted HR = 2.04, 95% CI 1.29–3.24, P = 0.002), serous adenocarcinoma (adjusted HR = 2.48, 95% CI 1.56–3.94, P < 0.001), FIGO III-IV (adjusted HR = 2.63, 95% CI 1.66–4.17, P < 0.001), residual lesions ≤ 1 cm (adjusted HR = 2.57, 95% CI 1.49–4.43, P = 0.001), and ascites (adjusted HR = 2.75, 95% CI 1.67–4.54, P < 0.001).
Table 4 Stratified analysis for associations between unfavorable genotypes and survival of the patients in combined groupSurvival ROC analysis of SNPs and OSWe used ROC curve to evaluate the sensitivity and specificity of GEN1 rs56070363 in prognosticating the outcomes of EOC patients. First, a Cox regression model incorporating clinicopathological variables was established. Subsequently, GEN1 rs56070363 was integrated into this model using an additive genetic model approach. ROC curves for the discovery group, validation group and a combined group were shown in Additional file 4: Fig. S3. However, we did not observe a statistically significant difference in the AUC between the two groups. The AUC of time-dependent ROC, specifically a 5-year survival timeframe for GEN1 rs56070363, was detailed in Additional file 1: Table S3.
The effect of GEN1 rs56070363 C > T on the binding ability of hsa-miR-1287-5p and 3′-UTR of GEN1Utilizing the online prediction tools SNPInfo (https://snpinfo.niehs.nih.gov/) and ensemble (http://www.ensembl.org/), we found that GEN1 rs56070363 was located at the 3 '- UTR region of GEN1, which was the critical binding site of microRNA. We hypothesized that the GEN1 rs56070363 C > T change might alleviate the binding affinity of miRNA, thereby affecting GEN1 expression and the prognosis of EOC patients. To identify specific microRNAs that interact with the GEN1 3 'UTR, we used online tools such as MirSNP (http://bioinfo.bjmu.edu.cn/mirsnp/search/), TargetScan (http://www.targetscan.org/vert_71/) and PicTar (http://pictar.mdc-berlin). According to these predictions, we speculated that the transition from the C to T allele at rs56070363 could weaken the binding capacity of GEN1 3′-UTR with hsa-miR-1287-5p (Fig. 2A). To validate this hypothesis, we constructed Psi-CHECK2 vector plasmids containing either the wild-type (GEN1 rs56070363 C) or mutant (GEN1 rs56070363 T) allele of the 3 '- UTR region. The sequencing results of these Psi-CHECK2 vectors were shown in Fig. 2B. The luciferase reporter assay revealed that in the presence of hsa-mir-1287-5p, there was a decreased in luciferase activity for the rs56070363 T allele compared to the C allele in two ovarian cell lines (Fig. 2C, D). Furthermore, overexpression of hsa-mir-1287-5p significantly inhibited both the mRNA and protein expression levels of GEN1 (Fig. 2E, F). Taking into account the impact of the rs56070363 C > T change on hsa-mir-1287-5p binding efficiency, we concluded that the alternation in binding affinity may lead to the upregulation of GEN1 expression.
Fig. 2
The GEN1 rs56070363 C > T contributed to the decreased binding affinity of miRNA-1287a-5p to GEN1 3′-UTR. A Graphic representation of the detailed location of rs56070363 in the 3′UTR of GEN1, which was also at the miRNA-binding site with the C allele. B Schematic drawing of the luciferase reporter system and sequencing results of the Psi-CHECK2 vector containing rs56070363 C or T allele. C, D Luciferase activity in the presence of the miRNA-1287a-5p transfected into SKOV3 and OVAC-433 cell lines. E Expression of GEN1 was detected by the qRT-PCR assay in SKOV3 and OVAC-433 cells overexpressing miRNA-1287a-5p and control cells. F Expression of GEN1 was detected by western blot assay in SKOV3 and OVAC-433 cells overexpressing miRNA-1287a-5p and control cells. *P < 0.05. **P < 0.01. Error bars, ± SEM from three biological replications
Functional prediction of genetic variants of GEN1To validate the role of GEN1 rs56070363 in regulating gene expression, we searched GTEx database, which includes mRNA expression data for GEN1 rs56070363. The GEN1 rs56070363 C > T change was associated with a significant increase in GEN1 mRNA expression, both in whole blood cells (P = 0.002, Fig. 3A) and normal ovarian tissues (P < 0.001, Fig. 3B).
Fig. 3
Functional prediction of genetic variants GEN1 rs56070363. A The GEN1 rs56070363 polymorphism influenced the mRNA expression of GEN1 from GTEx database in whole blood. B The GEN1 rs56070363 polymorphism influenced the mRNA expression of GEN1 from GTEx database in ovary tissue. C GEN1 expression in normal ovarian tissues (n = 88, right) and human epithelial ovarian carcinoma (n = 419, left) from TCGA database. TPM, Transcripts Per Kilobase of exon model per Million mapped reads. D. GEN1 expression in Bordline Ovarian Surface Epithelial-Stromal Tumor (n = 18, left) and Ovarian Carcinoma (n = 171, right) from Tothil ovarian dataset. E GEN1 expression in Borderline Ovarian Serous Neoplasm (n = 20, left), Borderline Ovarian Serous Tumor, micropapillary variant (n = 10, middle) and Ovarian Serous Adenocarcinoma (n = 60, right) from Anglesio ovarian dataset. F GEN1 expression in LMP (low malignant potential, n = 18) tumor and malignant tumor (n = 277) from GSE9899 ovarian dataset. G The correlation between the mRNA expression of GEN1 and tumor stage in GSE9899 ovarian dataset. H The correlation between the mRNA expression of GEN1 and tumor grade in GSE9899 ovarian dataset. I Kaplan–Meier analyses with the log-rank test for overall survival stratified by GEN1 mRNA expression levels
To further support our hypothesis, we examined GEN1 mRNA expression data from the Oncomine database (https://www.oncomine.org/) and the GEPIA online tool (http://gepia.cancer-pku.cn). The results showed an increase in expression level of GEN1 in ovarian cancer tissues, compared with normal ovarian tissues (P < 0.001, Fig. 3C). Additionally, a significant difference in GEN1 mRNA expression was observed between ovarian cancer tissues and borderline tumor tissues (Fig. 3D, E) or low malignant potential tumor tissues (P < 0.001, Fig. 3F). Notably, the mRNA expression level of GEN1 was also correlated with clinicopathologic characteristics such as tumor stage (P = 0.012, Fig. 3G) and tumor grade (P < 0.001, Fig. 3H). We also initiated a comprehensive search for the expression of GEN1 protein in ovarian cancer tissues from The Human Protein Atlas datasets (Additional file 5: Fig. S4A–D). Our findings suggested that while we could hypothesize an elevated GEN1 protein expression in ovarian cancer patients, the data was insufficient for conclusive statements due to the limited number of samples. To extend our investigation, we assessed GEN1 protein expression levels of cell lines and observed that ovarian cancer cell lines exhibited higher expression level compared with normal ovarian epithelial cell line (Additional file 5: Fig. S4E).
Furthermore, we used Kaplan Meier plotter to analyze the relationship between the GEN1 mRNA expression levels and survival outcomes in ovarian cancer patients. Consistent with our earlier findings, patients with higher GEN1 expression levels exhibited shorter OS (P = 0.011, Fig. 3I).
GEN1 promoted cell proliferation and metastasis in ovarian cancer cellsTo explore the effect of GEN1 on ovarian cancer pathogenesis, we transiently transfected the GEN1 cDNA plasmid into SKOV3 and OVCA-433 cell lines, which exhibited relatively low baseline expression of GEN1. The increased levels of GEN1 mRNA and protein levels were verified by qPCR and Western blot.
To investigate the role of GEN1 in regulating cell proliferation, we performed CCK-8 assays and colony formation assays. Compared with wild type and control cells, the overexpression of GEN1 promoted cell growth (Fig. 4A, B) in all cell lines. The colony formation assay further confirmed this finding, revealing an increase in both the number and size of colonies in cells overexpressing GEN1 (Fig. 4C, D). Additionally, we used transwell assay to explore the invasion and metastasis ability of ovarian cancer cells after GEN1 overexpression. The results showed that the ability of the migration and invasiveness was enhanced after overexpression of GEN1 in SKOV3 and OVCA-433 cell lines (Fig. 4E–H).
Fig. 4
GEN1 promoted cell proliferation and metastasis. A, B Cell viability determined by CCK8 assay in SKOV3 and OVAC-433 cell lines. C, D Representative images and number of colonies in SKOV3 and OVAC-433 cell lines. E, F Detection of cell migration and invasion by transwell assay. G, H Quantitative analysis of migration and invasion cells. Error bars, ± SEM from three biological replications. WT, wild type. **P < 0.01. ***P < 0.001
Overexpression of GEN1 may constructed an immunosuppressive environment by regulating neutrophilThe TIME is a complex ecosystem comprising tumor cells, immune cells, stromal cells, fibroblasts, extracellular matrix, and blood vessels. The intricate interplay, coexistence, and competition among these components create a unique environment that varies with the tumor type and adapt to the physiological and biochemical processes of the tumor. Dynamic change in the TIME exerts profound influence on tumor development [22]. Recent studies have shown that numerous oncogenes regulate the biological process of tumor cells by affecting the TIME. Therefore, we speculated that GEN1 might promote the malignant phenotype of ovarian cancer cells by influencing the cellular immune process. To explore this hypothesis, we performed GO and KEGG enrichment analyses focused on GEN1 using the CAMOIP database (http://www.camoip.net/) among ovarian cancer patients. We found that GEN1 was involved in various immune biological process (BP, Fig. 5A). Alongside GO and KEGG analyses, Gene Set Enrichment Analysis (GSEA) analysis was also implemented to uncover potential biological functions associated with upregulated GEN1 expression. The results indicated that increased GEN1 expression was negatively correlated with lymphocyte mediated immunity, leukocyte mediated immunity and positive regulation of immune system process (Fig. 5B). Further investigations revealed a relationship between GEN1 expression and various immunological regulator molecules and immune checkpoint molecules, including chemokines, receptors, MHC (major histocompatibility complex), immunostimulator and immunoinhibitor (Additional file 6: Fig. S5).
Fig. 5
In silico analysis of GEN1 manifest its close correlation with TIME. A Significantly enriched biological processes (BP) correlated with GEN1. B Gene set enrichment analysis (GSEA). The most involved significant hallmark correlated with GEN1 in ovarian ancer. NES: normalized enrichment score. C Scatterplot showing stromal, immune and ESTIMATE (Estimation of STromal and Immune cells in MAlignant Tumor tissues using Expression data) scores for each sample in ovarian cancer. TCGA-OV, The Cancer Genome Atlas ovarian cancer- Ovarian Serous Cystadenocarcinoma. D Boxplot showing the comparison of antigen presentation, effector cells, suppressor cells and checkpoint scores between GEN1 expression high and low group. E Correlation between GEN1 expression and various tumor cells based on TIMER, QUANTISEQ and MCP method
In the tumor microenvironment, immune cells and stromal cells represent the primary non-tumor components, with their proportions showing significant prognostic implications. Utilizing the ESTIMATE algorithm, we derived immune and stromal scores to quantify these components within tumors. As was shown in Fig. 5C, elevated expression of GEN1 in ovarian cancer correlates with a reduced abundance of both stromal cells and immune cells. Further, to visualize different immunophenotypes within ovarian tumor samples, IPS scores were calculated, serving as proxies for immune activation. As expected, higher GEN1 expression was associated with lower MHC molecules scores and higher suppressor cell scores, suggesting a dampened immune activation (P < 0.05, Fig. 5D). Additionally, a negative relationship between GEN1 expression and IPS z-scores was observed, indicating reduced immunogenicity with increased GEN1 expression level. To refine our understanding of immune cell subtype infiltration, we employed multiple quantification methods including TIMER, quanTIseq and MCP-counter. All methods concordantly indicated an enrichment in neutrophils in line with GEN1 expression levels (P < 0.05, Fig. 5E).
Previous studies have demonstrated that the high neutrophil-to-lymphocyte ratio (NLR) as a robust biomarker for adverse clinical outcomes in ovarian cancer. A retrospective analysis at our cancer center affirmed that a heightened NLR is a detrimental prognostic factor for OS (Fig. 6A). Moreover, in a multivariate analysis of 1036 EOC patients, an elevated NLR remained a significant variable post-adjustment for clinical parameters, as depicted in the forest plot (Fig. 6B).
Fig. 6
The relationship between GEN1 expression and neutrophil. A Kaplan–Meier analyses with the log-rank test for OS of neutrophil-to-lymphocyte ratio in EOC patients. B The forest plot of multivariate analysis concerning OS. C Expression of neutrophil markers was detected by the qRT-PCR assay in EOC patients. D Expression of N1/N2 and PMN-MDSCs related markers markers was detected by the qRT-PCR assay in EOC patients. OS, overall survival. EOC, epithelial ovarian cancer
To validate the predictive capability of bioinformatic approaches, we investigated the relationship between GEN1 mRNA expression and neutrophil markers in 20 EOC patients, observing positive association with CEACAM8(CD66b) and ITGAM(CD11b) expression (Fig. 6C). Given neutrophils' dualistic nature in inflammation, capable of either anti- or pro-tumorigenic responses, we posited that GEN1 might modulate the expression of immunosuppressive molecules, consequently hindering immune cell function and fostering an immunosuppressive TME. Indeed, GEN1 appeared to affect the expression of SIGLEC5(CD170), PD-L1 and ADORA2A (Fig. 6C).
Neutrophils can polarize into antitumorigenic phenotype (N1) and protumorigenic phenotypes (N2). However, our investigation into the impact of GEN1 on neutrophil polarization in 20 EOC patients did not reveal significant differences in N1/N2 marker expression (Fig. 6D).
Furthermore, pathologically activated neutrophils, also known as polymorphonuclear myeloid-derived suppressor cells (PMN-MDSCs), which exhibit potent immunosuppressive activity, play pivotal roles in tumorigenesis. CD300ld is specifically expressed in normal neutrophils and is upregulated in PMN-MDSCs upon tumour-bearing. Recent studies identified CD300ld as tumor immune suppressor in the recruitment of PMN-MDSCs into tumors and its function to suppress T cell activation [23]. In our study, we found that GEN1 expression positively correlated with the expression of the PMN-MDSCs marker CD300ld (P < 0.05, Fig. 6D). Above results demonstrated a potential relationship between GEN1 expression and PMN-MDSCs which called for a further validation in the future study.
Taken together, our findings suggested that GEN1 may promote ovarian cancer cell proliferation, invasion and migration by influencing the expression of immune inhibitory factors, thereby presumably elevating the proportion of PMN-MDSCs and constructing an immunosuppressive tumor microenvironment. Further mechanistic researches are desperately in need.
留言 (0)