
記住我

In order to reach a suitable set-up for assessing the thermal stability of BAA, different temperatures were first utilized for BAA inactivation. Ultimately, we chose 65 °C (Fig. S1), since regular decrease of enzyme activity was achieved at a relatively short time.
Aromatic amino acids Trp, Tyr, and Phe, and the basic Arg were used as potential thermal stabilizer additives.
Using a range of concentrations (from millimoles to moles), we tried to find additives that were best able to alter the steep profile of BAA thermal inactivation in a dose-dependent manner, while doing it at minimum concentration. In this experiment, we have measured the percentage of the residual activity of BAA over time.
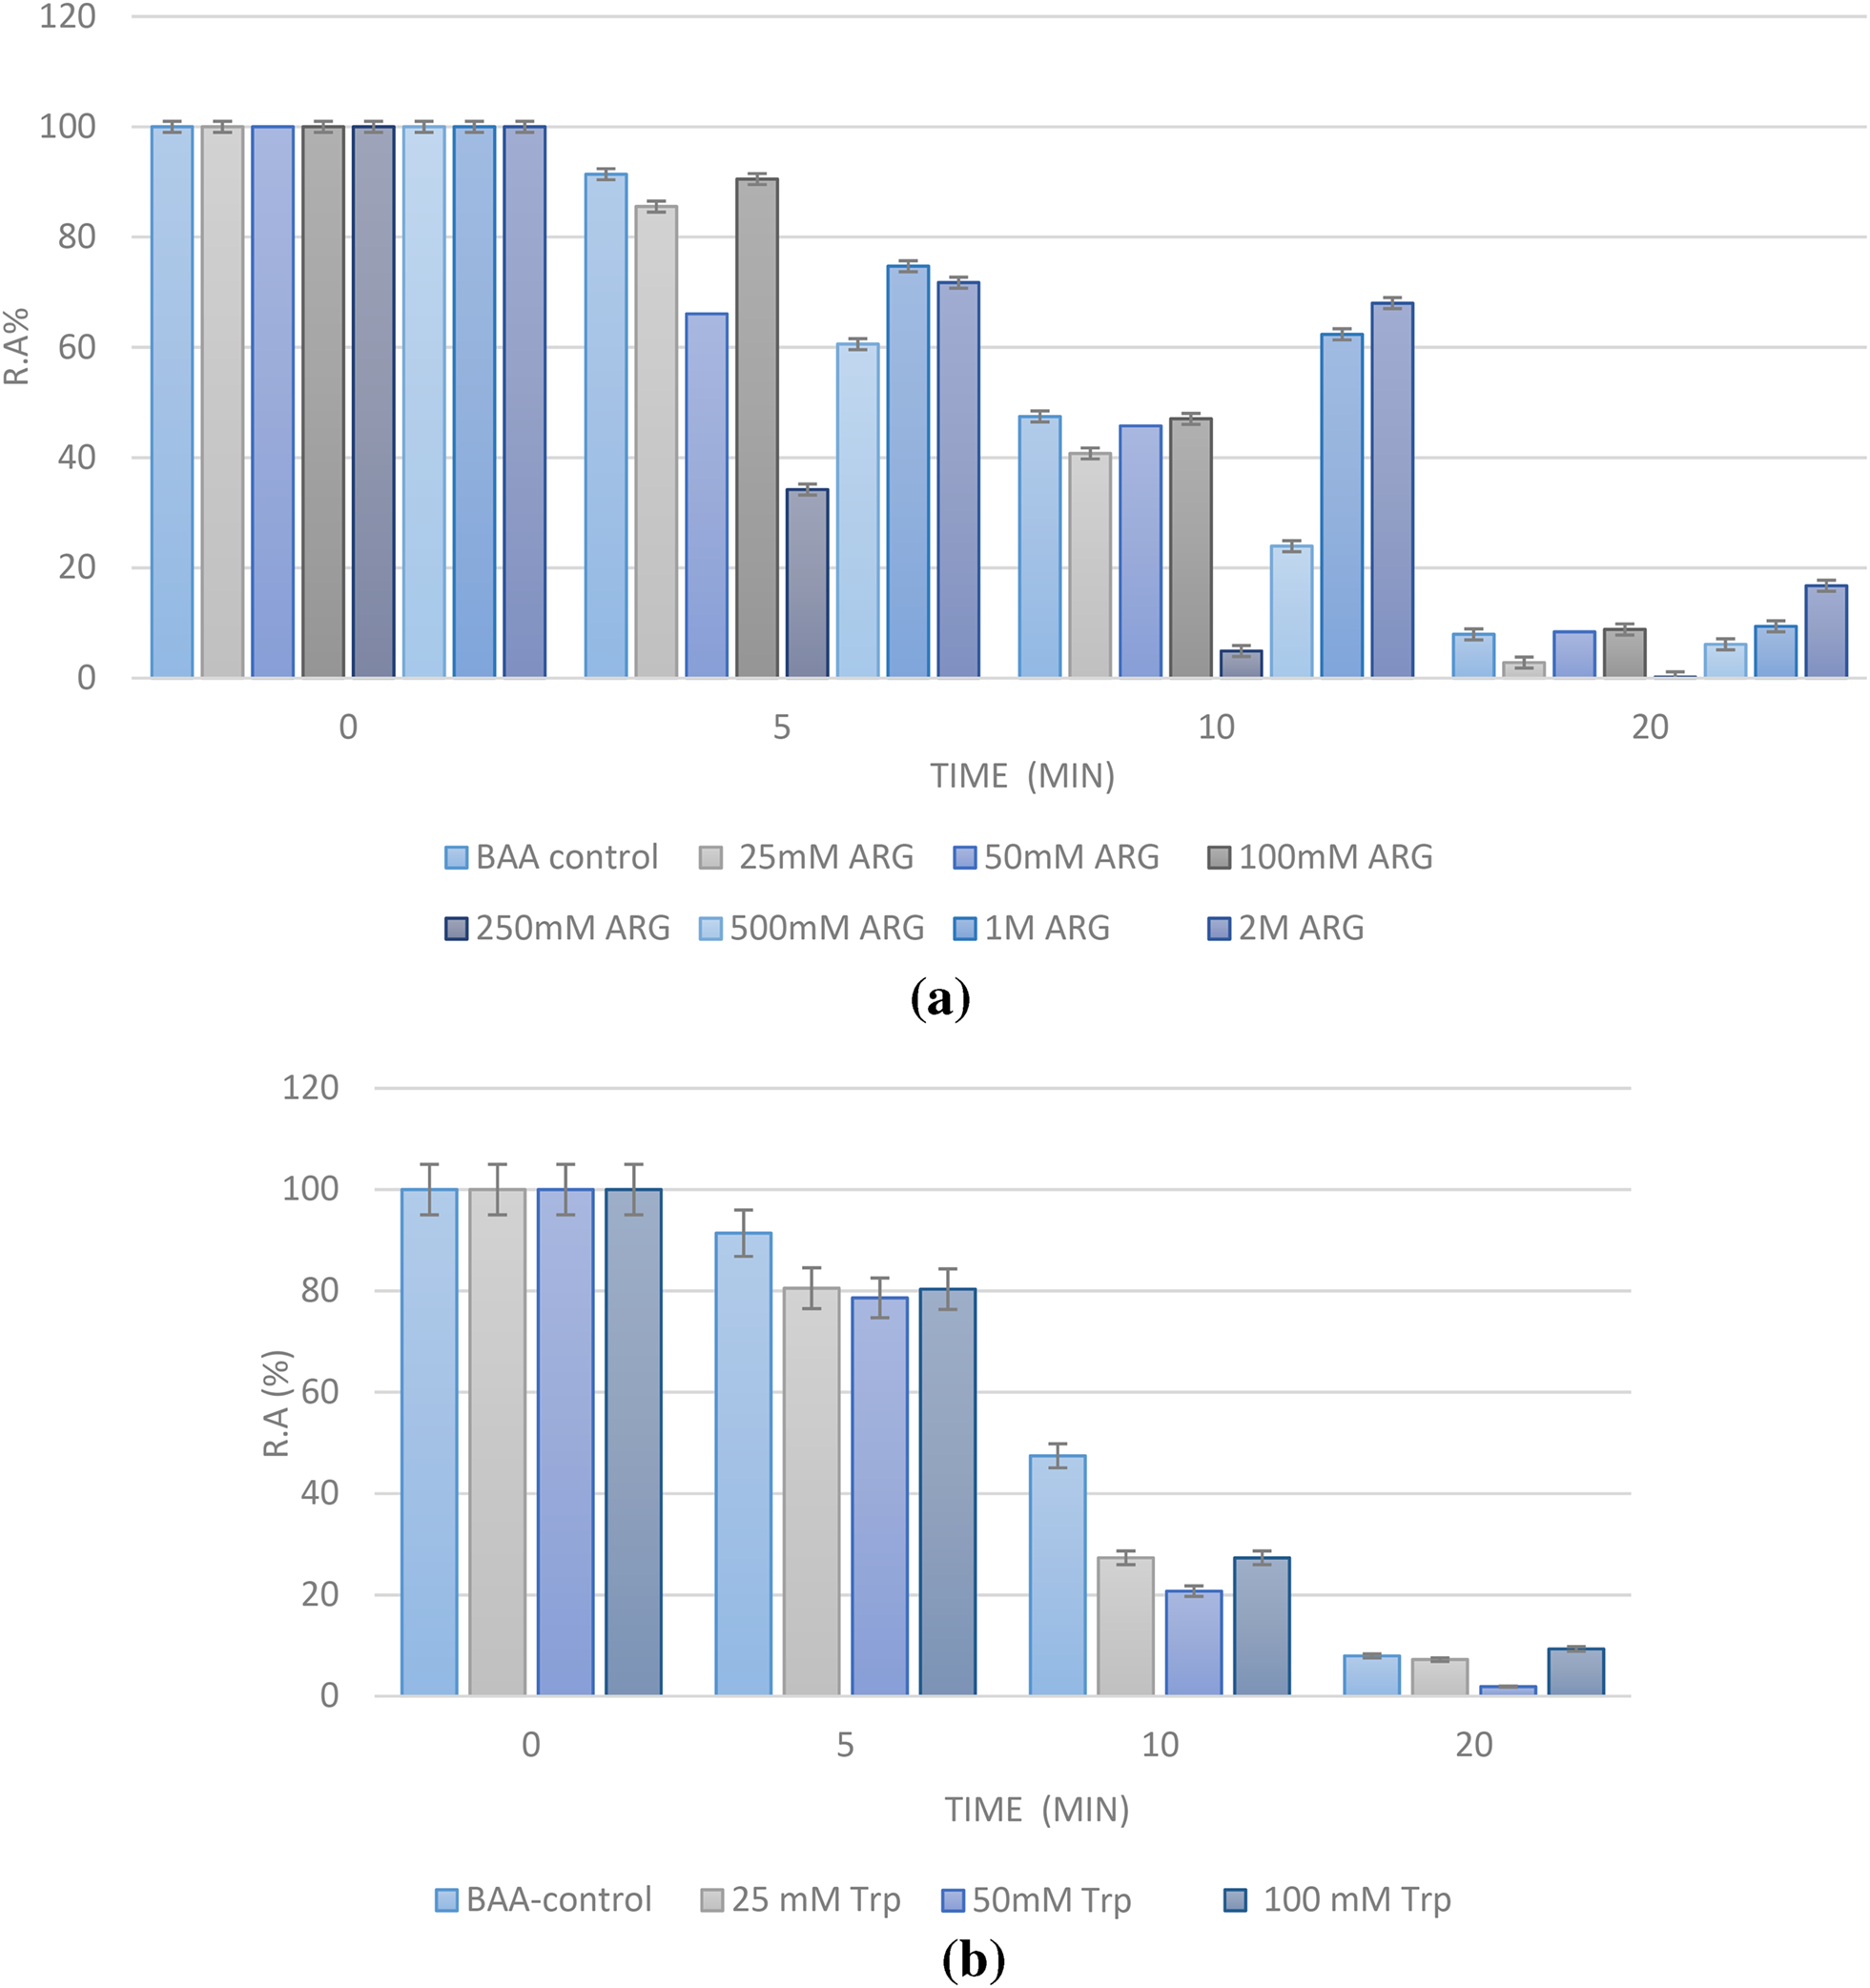
As shown in Fig. 1a, Arg is not able to prevent thermal inactivation over time, unless used at very high concentrations (higher than 500 mM, and especially at 2 M) as seen in the 10 and 20 min checkpoints. At 2 M, Arg is still able to keep around 16% of BAA activity (vs. 8% for the control enzyme) at the end. The problem with this high amount of Arg is that it affects the enzyme’s intrinsic activity. The reported percentages of Fig. 1a are relative to the first activity assessed for the enzyme in presence or absence of the additive. This means that although Arg at 2 M is able to maintain BAA activity, it does so in comparison to its first activity obtained in the presence of Arg (Table S1). As shown in Table S1, BAA activity remains intact in the presence of Arg up to 100 mM, after which it begins to decline. We considered adding other additives to Arg to balance its effect on BAA activity, but none of aspartate (Asp), glutamate (Glu), or lysine (Lys) could help (results not shown).
Fig. 1a Effect of various concentrations of Arg (25 mM-2 M) on BAA activity expressed as residual activity percentage (R.A%). b Effect of various concentrations of Trp (25–100 mM) on BAA activity expressed as residual activity percentage (R.A%). c Effect of various concentrations of Tyr (25mM -1 M) on BAA activity expressed as residual activity percentage (R.A%). d Effect of various concentrations of Phe (25mM -2 M) on BAA activity expressed as residual activity percentage (R.A%).
With Trp, the problem was its solvation in an aqueous buffer. Since we did not wish to add an organic solvent to the amino acids, the concentration range used for Trp was limited to 100 mM. As shown in Fig. 1b, the used concentrations were not able to counteract thermal denaturation of BAA, but seem to activate the enzyme to a little extent (Table S2).
When used at concentrations between 25 mM and 1 M, Tyr was also not effective as a BAA stabilizer (Fig. 1c). Even if it was the case, it could not be a suitable additive for BAA, since it has an even more pronounced effect on BAA activity compared to Arg. As shown in Table S3, the presence of Tyr at a concentration of 50 mM is already decreasing BAA activity to around 86%, while a sharp decline happens after this concentration reaches 100 mM (Table S3). The plotted Tyr concentration vs. activity percentage of BAA is shown in Fig. S2, and is suggestive of an inhibitory potential for Tyr.
Finally, Phe, which moderately affects BAA intrinsic activity (Table S4) was able to maintain BAA residual activity at the same level of the control sample in the initial period of thermal incubation, while it could preserve a higher level of activity in the latest segment, especially when used at higher concentrations (from 100 mM onward) (Fig. 1d).
As an additional experiment, we measured the amount of released ammonia in BAA environment over thermal incubation. This amount was 162.60 µg/dl for BAA alone and decreased to 9.56 µg /dl when BAA was incubated in presence of Phe (100 mM). BAA has 24 N residues and 23 Q residues. The sequence and predicted deamidation propensities for Q and N residues of BAA are also reported in Fig. S4.
Since Phe seemed to be a suitable candidate for further studies, we chose the 100 mM concentration, in order to have the least amount of additive that appeared to be effective as stabilizer.
Phenylalanine and amorphous aggregates formation in BAAIn the next step, we checked Phe ability to affect the formation of amorphous aggregates from BAA. As mentioned in the Methods section, the optimal conditions were first sought after, and we found out that aggregation would best occur at pH = 5. Absorbance spectra of BAA vs. time were then plotted. In these graphs, the maximal absorbance (plateau region on the plot) is indicative of an overall higher bulk of aggregates (Haghighi-Poodeh et al. 2020). As shown in Fig. 2, Phe at all concentrations used reduced the amount of aggregates in a dose-dependent manner, with a concentration of 50 mM performing best.
Fig. 2Aggregation plot of BAA (absorbance vs. time) in presence and absence of Phe (10–100 mM)
The next step was to confirm the amorphous nature of the produced aggregates. When Congo red dye is bound to amyloid structures, its absorbance spectrum is usually shifted with a change in intensity. This makes it a probe to detect amyloid aggregates (Buell et al. 2010). In our experiment, since the spectra of the dye alone, the protein alone, and the aggregated protein were almost identical, we may conclude that only amorphous aggregates were present in our samples (Fig. S3).
As a supplementary experiment, TEM experiment was performed to give a better visual proof for the amorphous nature of BAA aggregates. BAA aggregates were find to have typical disordered shapes (Fig. S5) similar to other previously detected amorphous species (e.g. Saadati-Eskandari et al. 2019).
In vivo effects of BAA aggregates formed in presence and absence of phenylalanine: histological studiesThere are scarce reports on the in vivo deleterious effects of amorphous aggregates. Actually, the most widely studied protein aggregates are the amyloid structures, which are related to pathologies such as Alzheimer’s and Parkinson’s diseases (Salahuddin et al. 2021). However, proteins’ amorphous aggregates can also be a cause of damage in the organs. In our previous works, we have started to assess the pathologic effect of various model proteins amorphous aggregates, alongside with investigation of aggregates attenuators on these processes (Saadati-Eskandari et al. 2022).
As reported in the Methods section, we have compared the effect of subcutaneous injection of native BAA, BAA aggregates, and BAA aggregates formed in the presence of phenylalanine. A subcutaneous injection of aggregates or amyloids for around three weeks has been shown to lead to the formation of a subcutaneous mass or at least an inflamed area (Azarfar et al. 2022) (Saadati-Eskandari et al. 2022). This mass is not formed in the absence of aggregates, i.e. with an injection of the native protein alone.
A comparative staining of the injected area was performed with hematoxylin and eosin (H&E) (Fig. 3a–f) as well as Sudan black (Fig. 4a–f).
Fig. 3Results of H&E staining in control, sham, and the three experimental groups (a–e). f shows a statistical comparison between all groups macrophage numbers. *** p < 0.001, ****p < 0.0001
Fig. 4Results of Sudan black staining in control, sham, and the three experimental groups (a–e). f shows a statistical comparison between all groups lipid droplets numbers. *** p < 0.001, ****p < 0.0001
The H&E images (Fig. 3) consist of cross-sectional views of mouse skin tissue with the epidermis, dermis, and hypodermis, as well as fibroblastic cells and differently arranged collagen bundles. In this staining, cell nuclei appear purple, while cell cytoplasm is pink. In addition, inflammatory cells, including lymphocytes and neutrophils with rounded and multi-lobed nuclei were observed. A quantified analysis was performed on the number of macrophages, which could be an indication of the inflammatory state of a tissue (Oishi et al. 2018).
As shown in Fig. 3f, in the control and sham (injection stress) groups, the population of these cells was very low and considered normal. This is in contrast with the BAA2 group (aggregated protein), where the population of macrophage cells responsible for phagocytosis was very high. In BAA3 (aggregates formed in presence of Phe) and BAA1 (native protein), this population was lower, with no significant difference between the two groups. In summary, in a 200-micrometer area the number of macrophage cells in the BAA1 study group was approximately 6, while being 17 in the BAA2 group, and 7 in the BAA3 group. One-way parametric ANOVA (Analysis of Variance) with a significant level of P value < 0.0001 was used for comparisons between and within groups.
The Sudan dyes have a wide range of applications for lipid staining in the microstructures of organisms and Sudan Black B is widely used for lipid staining in tissues. With Sudan Black, we found that the highest values of lipid accumulation were observed in the BAA2 group. There was a significant difference in terms of lipid droplet accumulation between the control group and the BAA2 group (Fig. 4). However, no significant difference was observed between the control group and both BAA1 and BAA3. A significant difference in terms of lipid accumulation values was observed between the Sham and the BAA2 group, but no significant difference was observed with the other two groups (BAA1 and BAA3). Other analyses showed that there was a significant difference in terms of lipid accumulation values between the BAA1 and BAA3 groups compared to the BAA2 group, but no significant difference was observed between the BAA1 and BAA3 groups (Fig. 4f).
In vivo effects of BAA aggregates formed in presence and absence of phenylalanine: biochemical parametersBiochemical parameters, i.e., fasting blood glucose, cholesterol, triglycerides, as well as SGPT and SGOt (hepatic enzymes) levels were investigated in the serum of control, sham, and experimental groups (Fig. 5).
Fig. 5Comparison of fasting blood glucose, triglycerides (TG), cholesterol (CHOl), SGPT and SGOT serum levels between control, sham, and experimental groups. **p < 0.01, ***p < 0.001, ****p < 0.0001
Glucose levels averages were 81.89 mg/dL in the BAA1 group, 245.3 mg/dL in the BAA2 group, and 87.55 mg/dL in the BAA3 group. Cholesterol levels averages were 174 mg/dL in the BAA1 group, 205 mg/dL in the BAA2 group, and 180.3 mg/dL in the BAA3 group. Triglyceride levels average were 189.7 mg/dL in the BAA1 group, 212 mg/dL in the BAA2 group, and 192 mg/dL in the BAA3 group.
Statistical analysis showed that there was a significant difference between the control group and the BAA2 group for all these parameters, but no significant difference was observed between the control and other groups. The Sham and the BAA2 groups showed also a significant difference, but no significant difference was observed with the other two groups (BAA1 and BAA3). Intra-group comparison showed a significant difference in triglyceride levels between the BAA1 and BAA2 groups, but no significant difference was found between the BAA1 and BAA3 groups. A significant difference was also observed between the BAA2 and BAA3 groups. P levels were different, though, depending to the biochemical parameter that was measured, and the glucose levels of BAA2 were remarkably increased (Fig. 5).
Average levels of SGOT were 87.33 IU/L in the BAA1 group, 242 IU/L in the BAA2 group, and 98.67 IU/L in the BAA3 group, while average levels of SGPT were 61 IU/L in the BAA1 group, 157 IU/L in the BAA2 group, and 67.33 IU/L in the BAA3 group. These results show a difference between all groups and BAA2 while no significant difference was found between the other groups themselves (Fig. 5).
Phenylalanine and BAA amorphous aggregates in vivo: cytokine changesSerum levels of Tumor necrosis factor alpha (TNFα) and Interleukin-6 (IL-6) were also investigated and compared (Fig. 6). TNF-α average level was 35.48 ng/L in the BAA1 group, 69.85 ng/L in the BAA2 group, and 33.73 ng/L in the BAA3 group, while IL-6 levels were 18.11 pg/mL in the BAA1 group, 89.81 pg/mL in the BAA2 group, and 28.51 pg/mL in the BAA3 group.
Fig. 6TNF-α (A) and interleukin 6 (B) concentrations compared in the different groups. *p < 0.05, **p < 0.01, ***p < 0.001
Statistical analysis showed that a significant difference could be observed between BAA2 and the other groups, while for BAA1 and BAA3, there was no significant difference between them or with control and sham groups (Fig. 6).
留言 (0)