
記住我
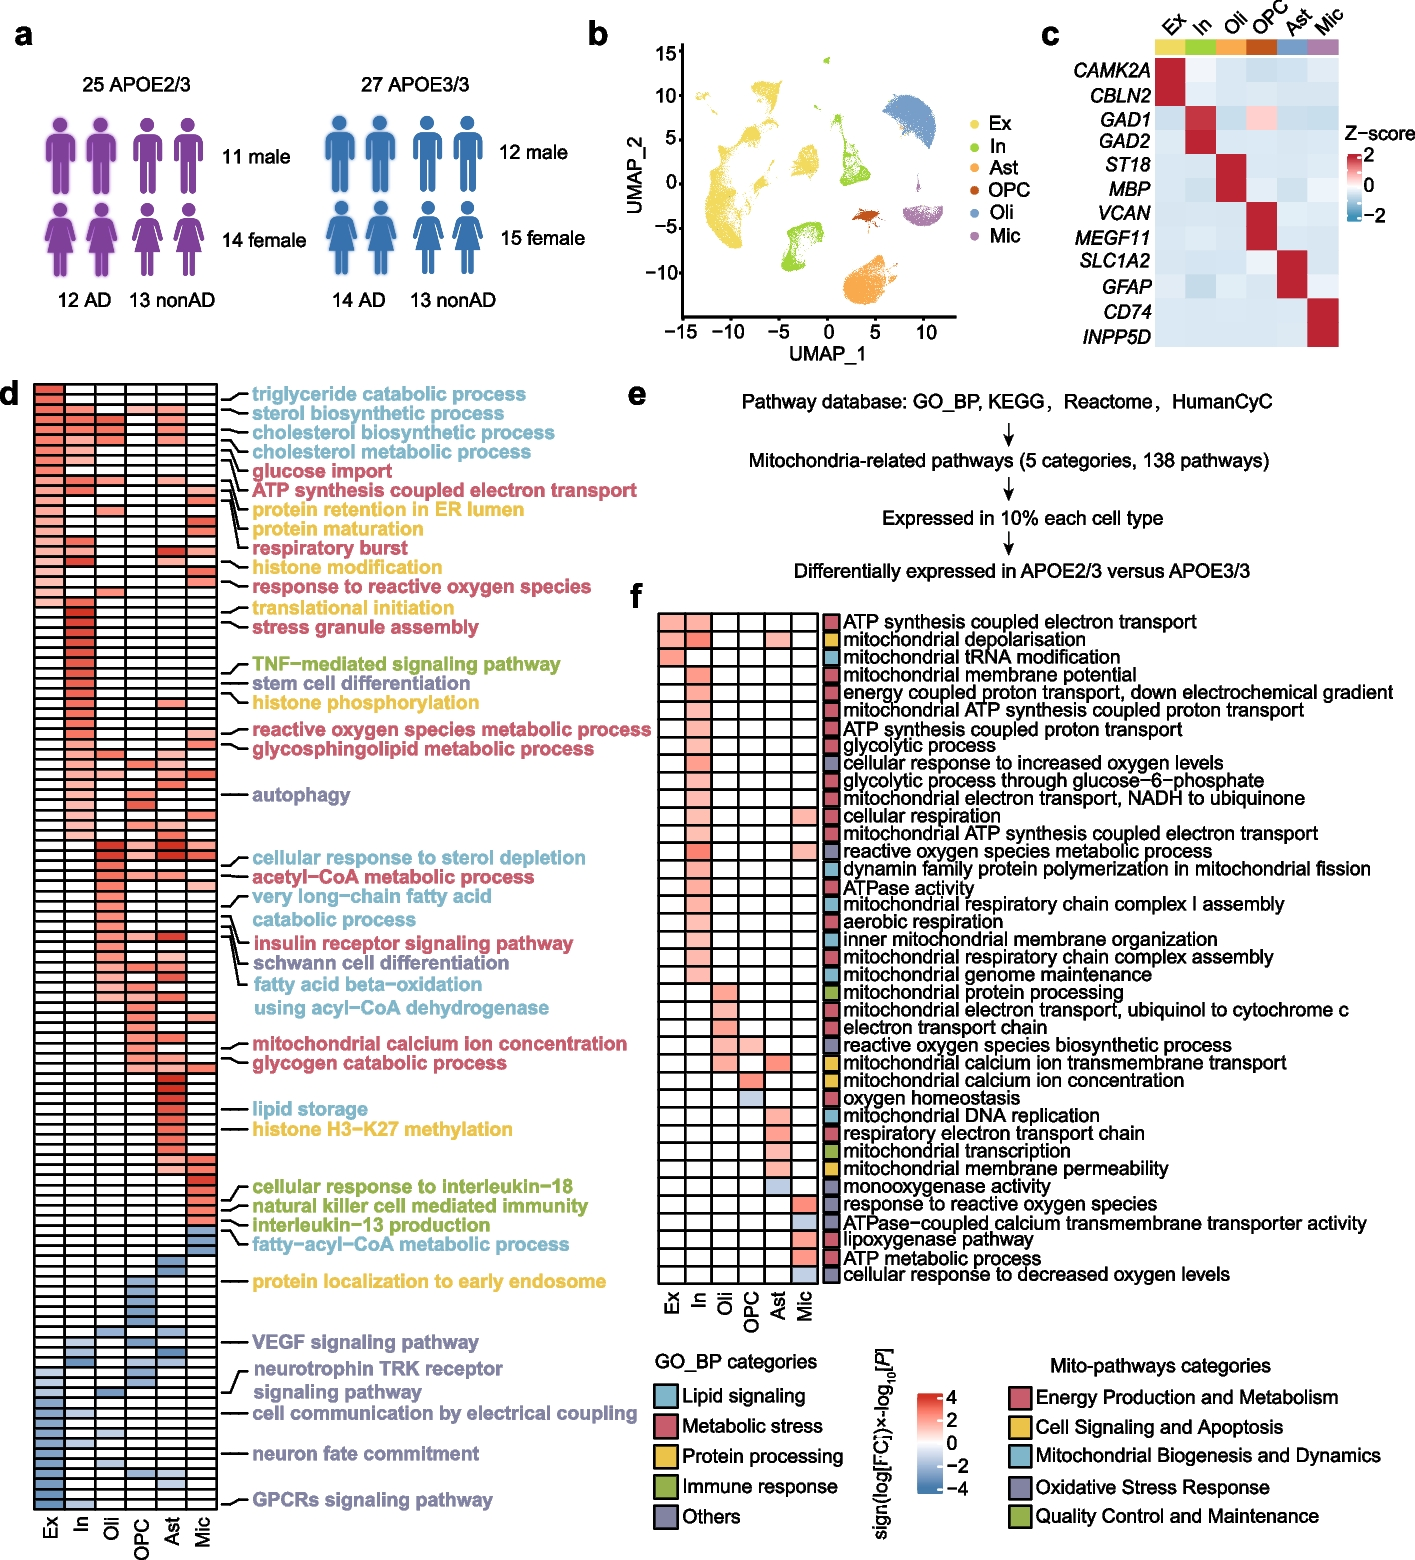

To examine the effect of APOE2 in the aging human brain, we investigated the single-nucleus RNA sequencing dataset of 52 individuals, which included 25 APOE2/3-carriers and 27 APOE3/3-carriers, randomly chosen from the ROSMAP. Among the 52 individuals, half exhibited high levels of β-amyloid and other pathological hallmarks of Alzheimer’s disease ('AD-pathology', 'AD'), while the remaining half showed either no or low β-amyloid burden ('non-AD-pathology', 'nonAD'), which aligned with the NIA-AA criteria [18, 38, 39]. Both APOE3/3 and APOE2/3 groups maintained a balance in terms of AD pathology, gender (APOE2/3: 11 males and 14 females, APOE3/3: 12 males and 15 females), age (median: 86.78 APOE2/3, 85.76 APOE3/3), years of education (median: 16.20 APOE2/3, 16.04 APOE3/3), and post mortem interval (PMI) (median: 7.245 APOE2/3, 8.026 APOE3/3) (Fig. 1a). Detailed clinical data are provided in Supplementary Table S1.
Fig. 1
APOE2 single-nucleus profiling and pathway-level alterations. a Detailed information of APOE carriers from The Religious Orders Study and Memory and Aging Project (ROSMAP) (Created with https://www.biorender.com). b The UMAP plot displayed six main cell types in DLPFC. Ex: excitatory neurons; In: inhibitory neurons; Oli: oligodendrocytes; OPC: oligodendrocyte precursor cells; Ast: astrocytes; Mic: microglia. c Heatmap showed the expression of representative marker genes in each cell type. d Heatmap showed top Gene Ontology biological processes with expression changes associated with APOE2 (nominal P < 0.05, linear model, APOE32/3 versus APOE3/3), with red indicating APOE2 upregulation and blue indicating APOE2 downregulation. The color scale represented sign (log [FC]) × log10[P] values. e The curation process of mitochondrion-associated pathways, GO_BP, GO_Biological_Process_2021 database; KEGG, KEGG_2021_Human database; Reactome: Reactome_2022 database; HumanCyc: HumanCyc_2016 database. f Heatmap showed mitochondrion-associated pathways altered across major six cell types in APOE2 versus APOE3 individual (nominal P < 0.05, linear model). Red indicated APOE2 upregulation and blue indicated APOE2 downregulation. The color scale represents sign (log [FC]) × log10[P] values. Pathways with absolute value of sign (log [FC]) × log10[P] > 1.3 were shown in the heatmap
After pre-processing, the single-nucleus RNA sequencing dataset was found to contain 17,829 genes across 102,316 nuclei (Fig. 1b). As demonstrated by the UMAP graph and the heatmap, these nuclei were assigned to 6 main cell types according to established gene markers [40, 41] including excitatory neurons (Ex, CAMK2A, CBLN2), inhibitory neurons (In, GAD1, GAD2), astrocytes (Ast, SLC1A2, GFAP), microglia (Mic, CD74, INPP5D), oligodendrocytes (Oli, ST18, MBP) and oligodendrocyte precursor cells (OPC, VCAN, MEGF11) (Fig. 1b, c). Vascular cells and peripheral immune cells were excluded considering that they have a small number and are not present in each sample.
APOE2 pathway-level alterationsWe investigated the transcriptomic effects of APOE2 on molecular processes by calculating pathway activity scores for each individual and cell type. This was done by combining pseudo-bulk approaches with Gene Set Variation Analysis (GSVA), focusing on Gene Ontology biological processes. The scores for APOE2/3 and APOE3/3 pathways were compared using a multivariate linear model, which adjusted for factors such as sex, post-mortem interval (PMI), age at death, and CERAD score. This analysis identified 111 potential APOE2-associated molecular processes (shown in Fig. 1d), each with a nominal P value of less than 0.05, as determined by the linear model comparing APOE2/3 to APOE3/3.
In APOE2 carriers, we observed several cell-type-specific alterations in biological processes (Fig. 1d; Supplementary Table S2, a detailed atlas of APOE2-related pathway changes in each cell type). Immune-related pathways (marked in green), including response to interleukin-18 and natural killer cell mediated immunity, were upregulated in microglia. In inhibitory neurons, there was an increase in tumor necrosis factor (TNF)-mediated signaling (Fig. 1d). Additionally, protein processing pathways (marked in yellow) varied across cell types; for instance, upregulation of protein retention in the ER lumen and protein maturation in neurons, and enhanced histone modification and histone H3-K27 methylation in astrocytes were noted. We also detected a decrease in processes linked to growth and nutritional factors, including the vascular endothelial growth factor signaling pathway and neurotrophin TRK receptor signaling pathway (Fig. 1d). Notably, these alterations in immune response, protein processing, and other pathways were evident not only in glial cells, typically most affected by APOE genotypes, but also in neurons.
Importantly, APOE2 was associated with energy metabolism in multiple cell types. A number of pathways related to lipid signaling (marked in blue) and metabolic stress (marked in red) were changed almost in all six cell types. For example, triglyceride catabolic process was enhanced in excitatory neurons, cholesterol biosynthetic and metabolic process were upregulated among neurons, oligodendrocytes, and astrocytes, while fatty-acyl-CoA metabolic process was downregulated in microglia (Fig. 1d). Remarkably, we observed a substantial increase in the number of mitochondrial energy metabolism pathways in APOE2-carriers. Glucose imports and ATP synthesis coupled electron transport were enhanced in both types of neurons, regulation of respiratory burst and reactive oxygen species were upregulated in neurons and microglia, acetyl-CoA metabolic and glycogen catabolic process were strengthened in both astrocytes and OPC (Fig. 1d). Consequently, the regulation of cellular metabolism, including mitochondrial bioenergetics and energy production, may serve as central protective mechanisms of APOE2.
APOE2 influences neuronal mitochondrial function especially in the presence of AD pathologyWe further analyzed the different pathways associated with mitochondrion across six major cell types in APOE2 and APOE3 individuals. A selection of 5 categories, 138 mitochondrial-associated pathways, from gene sets containing at least one of the following terms: oxygen, mitochondrial, energy, respiration, glycolytic, NADH, oxidative phosphorylation, ATP, aerobic respiration, electron transfer, and electron transport, were filtered from the union of pathways from different four pathway databases (Fig. 1e, Supplementary Table S3). Out of these, 40 mitochondrial-associated pathways showed alterations across different cell types, with 21 regulating neural function (Fig. 1f). Among these altered mitochondrial-related pathways, most of them are related to energy production and metabolism (marked in red), which suggests that APOE2 might be involved in neuronal mitochondrial energy metabolism (Fig. 1f, Supplementary Table S4).
To validate our findings, we further analyzed an additional single-nucleus RNA sequencing data containing the same brain region of 11 APOE2/3 and 23 APOE3/3 individuals [18]. As depicted by the UMAP plot, we also identified six primary cell types (Fig. S1a). Upregulated differentially expressed genes (DEGs) of excitatory and inhibitory neurons in APOE2/3 carriers showed a strong connection with mitochondrial functions in GO pathway analysis, when compared to who carries APOE3/3 (Fig. S1b, c). Moreover, we utilized Scissor to integrate the single-nucleus data and bulk transcriptome data of 470 individuals (86 APOE2 carriers and 384 APOE3 carriers) to identify APOE2-associated cells (Fig. S1d). The UMAP plot displayed APOE2 positive cells (cells positively correlated with APOE2 phenotypes), APOE2 negative cells (cells negatively correlated with APOE2 phenotypes), and background cells (cells uncorrelated with APOE2 phenotypes). The heatmap showed top20 marker genes of APOE2 positive cells, including inhibitory neuron markers (PVALB, GAD1, GAD2) and mitochondrial-related genes (Fig. S1e, f). Pathway analysis of these genes indicated their significant association with mitochondrial functions (Fig. S1g).
Overall, our results suggest that APOE2 is closely associated with cellular stress, as well as energy metabolism across various cell types, particularly in excitatory and inhibitory neurons, and that this association may be mediated through mitochondrial-related signaling pathways.
A separate analysis of the bulk RNA-seq data echoed similar findings and further demonstrated that the dissimilarities in mitochondria-associated pathways between APOE2 and APOE3 brains were partially modified by the presence of Aβ [19] (Fig. 2a, Supplementary Table S5). Therefore, we delved into if Aβ pathology modified APOE2’s impact on neuronal mitochondria. Indeed, in excitatory and inhibitory neurons subject to Aβ, we noticed alterations in mitochondria-associated pathways. Among these, the ‘ATP synthesis coupled electron transport’ pathway appeared most significantly affected by APOE2 in both cell types of neurons in the presence of Aβ (Fig. 2b, Supplementary Table S6). Besides, we conducted differential mitochondria-related gene expression analysis on excitatory and inhibitory neurons of APOE2 and APOE3 carriers and found there was a higher number of DEGs in the presence of Aβ: 119 in excitatory neurons and 17 in inhibitory neurons, respectively (Fig. S2, Supplementary Table S7).
Fig. 2
APOE2 drives mitochondrial changes in neurons especially when accompanied by AD pathology. a, b Heatmap showed mitochondrion-associated pathways altered in APOE2 versus APOE3 brain in bulk RNA-seq (a) and altered in excitatory and inhibitory neurons in APOE2 versus APOE3 individuals (b) stratified by amyloid. Red indicated APOE2 upregulation and blue indicated APOE2 downregulation. The color scale represents sign (log [FC]) × log10[P] values. P < 0.05 indicated (x). c, d Box plots showed pathway activity scores for ‘MITOMAP: Nuclear Mitochondrial Genes (147 genes associated with mitochondrion)’ (c) and for ‘GO: ATP synthesis coupled electron’(d) stratified by APOE genotype and/or AD pathology (nominal P-values, linear model). Boxplots indicates median, 25th and 75th percentiles. e Correlation analysis between oxidative phosphorylation pathway scores and the APOE expression values in excitatory neurons (Ex, APOE2: R = 0.41, P < 2.2e−16; APOE2: R = 0.29, P = 2.2e−16), with APOE2 excitatory neurons demonstrating a more significant correlation in comparison to APOE3 (z = 5.7837, P = 0.0000); ****P < 0.0001. f Correlation analysis between oxidative phosphorylation pathway scores and the APOE expression values in inhibitory neurons (In, APOE2: R = 0.56, P < 2.2e−16; APOE2: R = 0.34, P = 2.2e−16), with APOE2 inhibitory neurons demonstrating a more significant correlation in comparison to APOE3 (Z = 11.7636, P = 0.0000); ****P < 0.0001
Additionally, we computed the pathway activity scores for ‘Nuclear Mitochondrial Genes (MITOMAP)’ (Fig. 2c) [42] and ‘GO: ATP synthesis coupled electron transport’ (Fig. 2d) in both excitatory and inhibitory neurons, considering the stratification by APOE genotypes and/or AD pathology. Our repeated findings suggest that APOE2 may, in comparison to APOE3 individuals, possess a more prominent ability to protect neuronal mitochondria from the damaging effects of amyloid pathology.
Given prior studies indicating a potential correlation between the neuronal APOE expression and the metabolic pathway module [43], we assigned oxidative phosphorylation pathway scores to each neuron utilizing AUCell and performed correlation analysis with the expression value of APOE. In line with previous findings, neuronal APOE expression displayed a positive correlation with the oxidative phosphorylation pathway score, irrespective of the APOE genotypes (Fig. 2e, f; excitatory neurons (Ex), APOE2/3: R = 0.41, P < 2.2e−16; APOE3/3: R = 0.29, P = 2.2e−16; inhibitory neurons (In), APOE2/3: R = 0.56, P < 2.2e−16; APOE3/3: R = 0.34, P = 2.2e−16). A comparative analysis of the correlation degree between APOE2 and APOE3 neurons was conducted utilizing the Cocor [37], revealing a stronger correlation in APOE2 neurons, including both excitatory and inhibitory neurons (Fig. 2e, f; excitatory neurons (Ex),: Z = 5.7837, P = 0.0000; inhibitory neurons (In): Z = 11.7636, P = 0.0000). These findings suggested that neuronal APOE2 could potentially exert greater influence on neuronal mitochondrial metabolism compared to APOE3.
Moreover, other factors like Braak stages, age and gender may relate to the enhanced neuronal mitochondrial pathway in APOE2 individuals. Therefore, we performed a correlation analysis between individual mitochondrial pathway scores in both excitatory and inhibitory neurons and their corresponding Braak stages. The resulting heatmap reveals a significant inverse correlation for many mitochondrial pathways with Braak stage progression in APOE3/3 individuals, such as ‘ATP synthesis coupled electron transport’ and ‘Oxidative phosphorylation’, which appear preserved in APOE2/3 individuals (Fig. S3a, b Supplementary Table S8). Additionally, our analysis of the relationship between mitochondrial pathway scores and age indicates that age might not be a primary factor in APOE2's mitochondrial protection (Fig. S3c, d, Supplementary Table S9). Regarding gender differences, we found that females exhibited a stronger protective effect of APOE2 in certain pathways, such as 'ATP synthesis coupled electron transport' and 'cellular respiration' (Figure. S3e, Supplementary Table S10).
We further focused on subtypes of neurons, where we identified seven cell types of excitatory neurons and five cell types of inhibitory neurons with their markers (Fig. S4a, b) [44, 45]. We additionally carried out mitochondrial pathway scores on these twelve types of neuronal cells and examined the pathway differences between APOE2/3 and APOE3/3 individuals. Our analysis indicates that excitatory pyramidal neurons (Ex-PYR) and parvalbumin-positive basket interneurons (In-PV(Basket)) are likely the primary cell types influenced by APOE2 in terms of mitochondrial function (Fig. S4c, Supplementary Table S11).
APOE2 alters mitochondrial functions in Aβ1-42 -stimulated SH-SY5Y cellsTo verify the protective effects of APOE2 on neuronal mitochondrion in AD pathology, we overexpress human APOE2 or APOE3 gene in mammalian SH-SY5Y cell line through plasmids and 48 h after transfection, SH-SY5Y cells were treated with Aβ1-42 oligomers (10 μM) for another 24 h. Mitochondrion tests including tests for end point of mitochondrial membrane potential, mitochondrial membrane potential dynamics, and mitochondrial superoxide production were conducted 24 h after Aβ1-42 oligomer incubation (Fig. 3a). We used JC-1 kit to investigate dynamic changes in mitochondrial membrane potential (MMP) ΔΨm and found that the MMP was significantly depolarized after Aβ1-42 oligomers incubation (Fig. 3b, c, Pp-hAPOE3+vehicle vs p-hAPOE3 +Aβo < 0.0001), which was restored in APOE2 groups (Fig. 3b, c, Pp-hAPOE2+Aβo vs p-hAPOE3 +Aβo < 0.0001). We also used MitoTracker Red CMXRos Kit to specifically label biologically active mitochondria and to measure the MMP in SH-SY5Y cells. According to the fluorescence imaging, MMP was significantly decreased in hAPOE3 groups after Aβ1-42 oligomers treatment (Fig. 3d, e, Pp-hAPOE3+vehicle vs p-hAPOE3+Aβo < 0.0001; Pp-hAPOE2+vehicle vs p-hAPOE2+Aβo < 0.0001), while we found elevated of MMP in APOE2 overexpressing cells compared to APOE3 overexpressing cells after Aβ1-42 oligomers treatment (P p-hAPOE2+Aβo vs p-hAPOE3 +Aβo < 0.0001). Similarly, there was an increase in the MMP of APOE2 overexpressing cells after Aβ1-42 oligomers treatment by measuring fluorescence intensity (Fig. 3f, Pp-hAPOE2+Aβo vs p-hAPOE3 +Aβo = 0.0007). In addition, we examined the ROS level in the mitochondria using MitoSox-Red fluorescent probes. The fluorescence imaging showed that ROS accumulated in mitochondria after Aβ1-42 oligomers treatment (Fig. 3g, h, Pp-hAPOE3+vehicle vs p-hAPOE3+Aβo < 0.0001; Pp-hAPOE2+vehicle vs p-hAPOE2+Aβo = 0.0738), whereas APOE2 overexpression ameliorated ROS accumulation (Fig. 3g, h, Pp-hAPOE2+Aβo vs p-hAPOE3 +Aβo < 0.0001). Similar decrease in ROS level of APOE2 overexpressing cells after Aβ1-42 oligomers treatment was observed by measuring MitoSOX Red fluorescence intensity (Fig. 3i, Pp-hAPOE2+Aβo vs p-hAPOE3 +Aβo < 0.0001). Together, these results suggested that APOE2 could ameliorate Aβ-induced mitochondrial abnormalities in neuron-like cells.
Fig. 3
APOE2 alters mitochondrial functions in Aβ1-42 stimulated SH-SY5Y cells. a Experimental design for detecting mitochondrial functions of overexpressed APOE2 or APOE3 in Aβ1-42 or vehicle treated SH-SY5Y cells (Created with https://www.biorender.com). b Representative fluorescence images of JC-1in Aβ1-42 or vehicle treated SH-SY5Y cells. JC-1 aggregates (red) and monomers (green) distributions after loading with JC-1 (1 μg/ml). Scale bars, 100 μm. c Ratios of the fluorescence intensities of JC-1 labelling. JC-1 aggregates and JC-1 monomers were measured by average cell fluorescence intensity by fluorescence microscopy. d Representative fluorescence images of mitochondrial membrane potential (MMP) in SH-SY5Y cells using end-point assay. DAPI (blue) and MitoTracker (red). Scale bars, 100 μm. e, f Quantification of MMP using MitoTracker-Red fluorescent probes. The MMP was measured by average cell fluorescence intensity by fluorescence microscopy (e) and fluorescence light intensity tested by fluoresce microplate reader (f). g. Representative fluorescence images of mitochondrial levels of reactive oxygen species (ROS) in SH-SY5Y cells. DAPI (Blue) and MitoSox (Red). Scale bars, 100 μm. h, i. Quantification of mitochondrial ROS levels using MitoSox-Red fluorescent probes. The ROS level was measured by average cell fluorescence intensity by fluorescence microscopy (h) and fluorescence light intensity tested by fluoresce microplate reader (i). c, e, h Data are presented as the mean ± S.E. The experiment had three independent biological replicates (Kruskal-Wallis test). *P < 0.05; ***P < 0.001; ****P < 0.0001. f, i Data are presented as the mean ± S.E. The experiment had three independent biological replicates (One-way ANOVA). *P < 0.05; ***P < 0.001; ****P < 0.0001
ApoE2 interacts with ERRα to influence neuronal mitochondrial functionsTo investigate the mechanism by which APOE2 influences neuronal mitochondrial functions, we used SCENIC to reconstruct gene regulatory networks and assessed the enrichment of transcription factors (TFs) and the activity of regulons [26]. We calculated the transcription factor activity of each neuron under AD pathology and utilized limma for differential analysis to screen out 14 transcription factors as potential APOE targets that exhibited differential activities in APOE2/3 and APOE3/3 neurons (Fig. 4a).
Fig. 4
ApoE2 interacts with ERRα. a SCENIC analysis of different transcription factors (TFs) activity between APOE2 versus APOE3 neurons under AD pathology (adjusted. P value < 0.05). b The predicted target genes of ESRRA. c The distribution of ESRRA gene expression in dorsolateral prefrontal cortex (DLPFC). d Co-localization of the ERRα protein (green) with the neuronal marker NeuN (red) in mouse cortex. Scale bars, 100 μm for low magnification, 25 μm for high magnification. e Co-localization of the ERRα protein (green) with ApoE (red) in mouse cortex. Scale bars, 100 μm for low magnification, 25 μm for high magnification. f, g Binding mode of ApoE2 (e) or ApoE3 (f) and ERRα predicted by HDOCK. Left: overall structure of ApoE2 or ApoE3 bound to ERRα in cartoon view. ApoE2, ApoE3, and ERRα were colored in pink, dark green, and orange, respectively. Right: detailed interaction network between ApoE2 or ApoE3 and ERRα. Key residues of ApoE2 (pink) or ApoE3 (green) and ERRα (orange) were displayed as sticks. H-bonds are displayed in black dashed lines, and the distances (acceptor to donor heavy atom) of H-bonds are labeled. h, i Co-IP indicating the direct bind of ERRα protein and ApoE2 protein in HEK-293 T cells (h) and hAPOE2-TR mouse cortex (i). j Representative immunoblotting images of ERRα protein expression after APOE2 or APOE3 plasmid transfection and Aβ1-42 stimulation. Data were presented as the mean ± S.E.M. The experiment had three independent biological replicates (One-way ANOVA); *P < 0.05; **P < 0.01. k The correlation between ESRRA activity and CERAD pathology between APOE genotypes in Ex-PYR neurons (APOE2: R = 0.0073, P = 0.88; APOE3: R = 0.14, P = 0.00053). A significant difference between these two groups was confirmed through Cocor (Z = -2.1449, P = 0.0320); *P < 0.05. l The correlation between ESRRA activity and CERAD pathology between APOE genotypes in In-PV (Basket) neurons (APOE2: R = -0.053, P = 0.3; APOE3: R = 0.11, P = 0.023). A significant difference between these two groups was confirmed through Cocor (Z = -2.2957, P = 0.0217); *P < 0.05
Among 14 candidates, ESRRA, which encodes estrogen-related receptor alpha (ERRα), has been reported to be central for mitochondrial biogenesis and ROS detection [46, 47]. Meanwhile, our analysis showed ESRRA regulated downstream molecules related to mitochondrial and neuronal functions (Fig. 4b) and was specifically highly expressed in human neurons (Fig. 4c). Immunofluorescent analysis proved co-localization of the ERRα protein with the neuronal marker NeuN (Fig. 4d). We found that under AD pathology, neuronal ESRRA expression significantly decreased (Fig.S5a). Even though there was no difference in ESRRA expression between males and females in the overall population (Fig.S5b), ESRRA expression in females significantly declined, whereas in males, it appeared to be unaffected under AD pathology (Fig.S4c–d).
Due to the co-localization of ERRα and ApoE in the cytoplasm of mouse cortical neurons (Fig. 4e), we hypothesized that ERRα might induce downstream effects through a direct interaction with ApoE. Molecular docking analysis indicated a possible interaction between ApoE2/ApoE3 and ERRα (Fig. 4f, g). The interaction between ApoE2 and ERRα was confirmed by co-IP assays both in HEK-293 T cells and in the cortex of hAPOE2-TR mice (Fig. 4h, i). We also found the binding between ERRα and ApoE3 in the cortex of hAPOE3-TR mice (Fig. S6a). Interestingly, ApoE2 overexpression can increase ERRα protein expression level in SH-SY5Y cells (Fig. 4j). Owing to the dropout characteristic of single-cell sequencing, we compensated for the missing expression values of ESRRA in neurons using the SAVER method [23]. Our analysis revealed a pronounced expression of ESRRA predominantly in Ex-PYR and In-PV(Basket) neurons. Notably, these neuron types are the most significantly impacted by APOE2 (Fig. S5d). This observation might suggest that the protective mechanism of APOE2 is potentially mediated through ESRRA. To elucidate differential influences exerted by ApoE2 and ApoE3 on ESRRA, we investigated the correlation between ESRRA activity and CERAD pathology in different APOE genotypes, particularly focusing on Ex-PYR and In-PV (Basket) neurons. The findings indicated a decline in ESRRA activity correlating with aggravated pathology in individuals with APOE3/3 genotype (Fig. 4k, l, Ex-PYR: R = 0.14, P = 0.00053; In-PV (Basket): R = 0.11, P = 0.023). Conversely, ESRRA activity levels were relatively stable in APOE2/3 individuals (Fig. 4k, l, Ex-PYR: R = 0.0073, P = 0.88; In-PV (Basket): R = -0.053, P = 0.3). A significant difference between these two groups was confirmed using the R package Cocor (Fig. 4j, k, Ex-PYR: Z = -2.1449, P = 0.0320; In-PV (Basket): Z = -2.2957, P = 0.0217). These results imply the potential disparities in the effects of ApoE2 and ApoE3 on ERRα.
Therefore, ApoE2 interacted with ERRα and then regulated mitochondria-related molecules, especially in neurons.
Elevated ERRα expression restores mitochondrial function in Aβ1-42 stimulated SH-SY5Y cellsTo figure out the role of ERRα mediated ApoE2 protective effect, we used human ESRRA overexpression plasmids or ERRα agonist to verify the influence of ApoE2-ERRα signaling on mitochondrial function in Aβ1-42 stimulated SH-SY5Y cells.
Firstly, we investigated whether overexpression of human ESRRA could affect mitochondrial function in Aβ1-42 treated SH-SY5Y cells by detecting mitochondrial membrane potential ΔΨm using JC-1 kit. We found that the ΔΨm was depolarized after Aβ1-42 oligomers incubation, which was reversed by ESRRA overexpression (Fig. 5a, b, Pp-con+vehicle vs p-con+Aβo < 0.0001; Pp-hESRRA+vehicle vs p-hESRRA+Aβo < 0.0001; Pp-con+Aβo vs p-hESRRA+Aβo < 0.0001). We also used MitoTracker Red CMXRos Kit to detect MMP in SH-SY5Y cells. According to the fluorescence imaging, MMP was significantly decreased by Aβ1-42 oligomers in control groups (Fig. 5c, d, Pp-con+vehicle vs p-con+Aβo < 0.0001; Pp-hESRRA+vehicle vs p-hESRRA+Aβo < 0.0001) and significantly increased by ESRRA overexpression (Fig. 5c, d, Pp-con+Aβo vs p-hESRRA +Aβo < 0.0001). We also observed a similar decrease of MMP in Aβ1-42 oligomers treated cells (Fig. 5e, Pp-con+vehicle vs p-con+Aβo = 0.0178; Pp-hESRRA+vehicle vs p-hESRRA+Aβo = 0.0416) and that was increased in ESRRA overexpressing cells after Aβ1-42 oligomers treatment (Fig. 5e, Pp-hESRRA+ vehicle vs p-hESRRA +Aβo = 0.0490) according to the fluorescence intensity. Additionally, we measured the ROS level in SY5Y cells using MitoSox-Red fluorescent probes. The fluorescence imaging showed that ROS accumulated in mitochondria after Aβ1-42 oligomers treatment (Fig. 5f, g, Pp-con+vehicle vs p-con+Aβo < 0.0001; Pp-hESRRA+vehicle vs p-hESRRA+Aβo < 0.0001), whereas ESRRA overexpression ameliorated ROS accumulation (Fig. 5f, g, Pp-con+Aβo vs p-hESRRA+Aβo < 0.0001). Similarly, decrease ROS level was observed in ESRRA overexpressing cells after Aβ1-42 oligomers treatment by measuring MitoSOX Red fluorescence intensity (Fig. 5h, Pp-con+Aβo vs p-hESRRA+Aβo = 0.0191). Therefore, overexpressed human ESRRA showed protective effects on mitochondrial function in Aβ1-42 oligomers treated SH-SY5Y cells, which was similar to APOE2 overexpression.
Fig. 5
ESRRA overexpression affects mitochondrial function in Aβ1-42-stimulated SH-SY5Y cells. a Representative fluorescence images of JC-1 in SH-SY5Y cells. JC-1 aggregates (red) and monomers (green) distributions after loading with JC-1 (1 μg/ml) probes. Scale bars, 100 μm. b Ratios of the fluorescence intensities of JC-1 labelling. JC-1 aggregates and JC-1 monomers were measured by average cell fluorescence intensity by fluorescence microscopy. c Representative fluorescence images of MMP in SH-SY5Y cells. DAPI (blue) and MitoTracker (red). Scale bars, 100 μm. d, e Quantification of MMP using MitoTracker-Red fluorescent probes. The MMP was measured by average cell fluorescence intensity by fluorescence microscopy (d) and fluorescence light intensity tested by fluoresce microplate reader (e). f Representative fluorescence images of mitochondrial levels of ROS in SH-SY5Y cells. DAPI (blue) and MitoSox (red). Scale bars, 100 μm. g, h Quantification of mitochondrial ROS levels using MitoSox-Red fluorescent probes. The ROS level was measured by average cell fluorescence intensity by fluorescence microscopy (g) and fluorescence light intensity tested by fluoresce microplate reader (h). e, h Data are presented as the mean ± S.E. The experiment had three independent biological replicates (Kruskal-Wallis test). *P < 0.05; ***P < 0.001; ****P < 0.0001. b, d, g Data were presented as the mean ± S.E. The experiment had three independent biological replicates (One-way ANOVA); *P < 0.05; ****P < 0.0001
We then used 1-[4-(3-tert-Butyl-4-hydroxyphenox) phenyl] ethan-1-one (Fig. 6a), an ERRα agonist, to elevate the function of ERRα [33]. After treated with ERRα agonist at 0–20 μM, SH-SY5Y cells showed no significant change in cell viability (Fig. 6b). The expression level of ERRα was increased after the ERRα agonist treatment (Fig. 6c). Therefore, the safety and effectiveness of the ERRα agonist were validated. Then we also test the mitochondrial function of Aβ1-42 oligomers treated SH-SY5Y cells after ERRα agonist treatment (5 μM). Similar to overexpression of ESRRA, the depolarized MMP ΔΨm was reversed by ERRα agonist in SH-SY5Y cells after Aβ1-42 oligomers incubation (Fig. 6d, e, Pvehicle+Aβo vs ERRα agonist+Aβo < 0.0001). We also observed increased MMP (Fig. 6f, g, Pvehicle+Aβo vs ERRα agonist+Aβo < 0.0001; Fig. 6h, Pvehicle+Aβo vs ERRα agonist+Aβo = 0.0409) and reduced ROS (Fig. 6i, j, Pvehicle+Aβo vs ERRα agonist+Aβo < 0.0001; Fig. 6k, Pvehicle+Aβo vs ERRα agonist+Aβo = 0.0466) after ERRα agonist treatment. Together, these results indicate ERRα activation ameliorate Aβ-induced mitochondrial abnormalities in neuron-like cells.
Fig. 6
ERRα agonist alters mitochondrial functions in Aβ1-42 stimulated SH-SY5Y cells. a The structural formula of 1-[4-(3-tert-Butyl-4-hydroxyphenox) phenyl] ethan-1-one (ERRα agonist). b Cell viability of SH-SY5Y cells treated with ERRα agonist at indicated concentrations was determined by CCK8 assay. c Representative immunoblotting images of ERRα protein expression after agonist treatment in SH-SY5Y cells. d Representative fluorescence images of JC-1. JC-1 aggregates (red) and monomers (green) distributions after loading with JC-1 (1 μg/ml). Scale bars, 100 μm. e Ratios of the fluorescence intensities of JC-1 labelling. JC-1 aggregates and JC-1 monomers were measured by average cell fluorescence intensity by fluorescence microscopy. f Representative fluorescence images of end-point MMP in SH-SY5Y cells. DAPI (blue) and MitoTracker (red). Scale bars, 100 μm. g, h Quantification of MMP using MitoTracker-Red fluorescent probes. The MMP was measured by average cell fluorescence intensity by fluorescence microscopy (g) and fluorescence light intensity tested by fluoresce microplate reader (h). i Representative fluorescence images of mitochondrial ROS levels in SH-SY5Y cells. DAPI (blue) and MitoSox (red). Scale bars, 100 μm. j, k Quantification of mitochondrial ROS levels using MitoSox-Red fluorescent probes. The ROS level was measured by average cell fluorescence intensity by fluorescence and fluorescence light intensity tested by fluoresce microplate reader. e, g, j Data were presented as the mean ± S.E. The experiment had three independent biological replicates (Kruskal–Wallis test); *P < 0.05; **P < 0.01; ***P < 0.001; ****P < 0.0001. b, h, k Data were presented as the mean ± S.E. The experiment had three independent biological replicates (One-way ANOVA); *P < 0.05; **P < 0.01; ***P < 0.001; ****P < 0.0001
ERRα agonist ameliorates cognitive deficits in AD model miceTo figure out whether ERRα agonist rescue the cognitive decline in AD mice. We established an Aβ-induced AD model by intracerebroventricular (ICV) injection of Aβ oligomer (400 pmol/mouse) in ICR mice [34]. Then, the Aβ-induced AD mice were treated with ERRα agonist (1 mg/kg) or vehicle intranasally twice, on the third and sixth days after induction (Fig. 7a). Y maze and novel object recognition test were performed on the ninth day after Aβ injection to assess the cognitive performance (Fig. 7a). Considering the potential sex differences associated with ERRα, we included an equal number of male and female mice in our study. The Aβ-induced AD mice showed lower spontaneous alternations in Y maze test (Fig. 7b, c), while ERRα agonist treatment improve the Y maze performance of mice compared to the vehicle-treated group (Fig. 7b, c), with similar changes observed in both male and female mice (Fig. 7d, e). Moreover, the loss performance for novel object of Aβ-induced AD mice were restored by ERRα agonist in novel object recognition test (Fig. 7f, g). Similarly, this improvement was seen in both male and female mice (Fig. 7h, i). We discovered that Aβ caused a decrease in ERRα protein levels in the cortex of female mice without significant changes in males (Fig. 7j–l), consistent with previous human brain ESRRA expression analyses (Fig. S5d), indicating a more noticeable decrease in females affected by AD pathology. Regardless of changes in ERRα protein expression, activating ERRα enhanced its expression in the cortex, offering protective effects (Fig. 7j–l). Intranasal administration, allowing delivery to different brain regions [48], ERRα immunofluorescent staining of male mice showed significant ERRα positive cell number increase in the perirhinal cortex and hippocampal dentate gyrus region, but not in the CA1 area, suggesting the agonist’s effectiveness might be mediated through effects on the cortex and hippocampus (Fig. S7a–f). Post-treatment with the ERRα agonist, we observed significant recovery of PSD95 levels in the cortex of Aβ-induced mice (Fig. 7m–o), while cortex synaptophysin and Homer1 levels showed no significant changes (Fig. S7g–j). Additionally, an increase in PSD95 expression was observed in the hippocampus post ERRα agonist administration (Fig. S7k, l). Therefore, the improved cognitive performance in ERRα agonist treated mice might derive from the upregulation of PSD95.
Fig. 7
ERRα agonist treatment ameliorate cognitive function in Aβ1-42 ICV injected mice. a Experimental design for Aβ1-42 injection and behavioral test (Created with https://www.biorender.com). b Schematic representation of Y-maze task. c–e The spontaneous alternation rates of all mice (c, n = 13, sham group; n = 13, Aβ + vehicle group; n = 14, Aβ + agonist group), male mice (d, n = 7, sham group; n = 7, Aβ + vehicle group; n = 7, Aβ + agonist group), and female mice (e, n = 6, sham group; n = 6, Aβ + vehicle group; n = 7, Aβ + agonist group) in Y-maze were showed. f Schematic representation of NOR task. g–i The novel objective recognition rates of all mice (g, n = 13, sham group; n = 13, Aβ + vehicle group; n = 14, Aβ + agonis
留言 (0)