
記住我
The NHANES, conducted by the National Center for Health Statistics (NCHS) in the United States, aims to evaluate the status of health and nutrition for both adults and children throughout the entire nation, covering a broad spectrum of domains including demographics, socioeconomic factors, dietary behaviour and health-related inquiries. Comprising two parts—an interview and a physical examination—the NHANES was administered by highly trained medical professionals, conducted either at participants' residences or within a mobile examination centre. The study protocol for the NHANES received approval from the NCHS Ethics Review Board of the Centers for Disease Control and Prevention, ensuring adherence to ethical guidelines. Prior to their involvement in the survey, written informed consent was obtained from each participant.
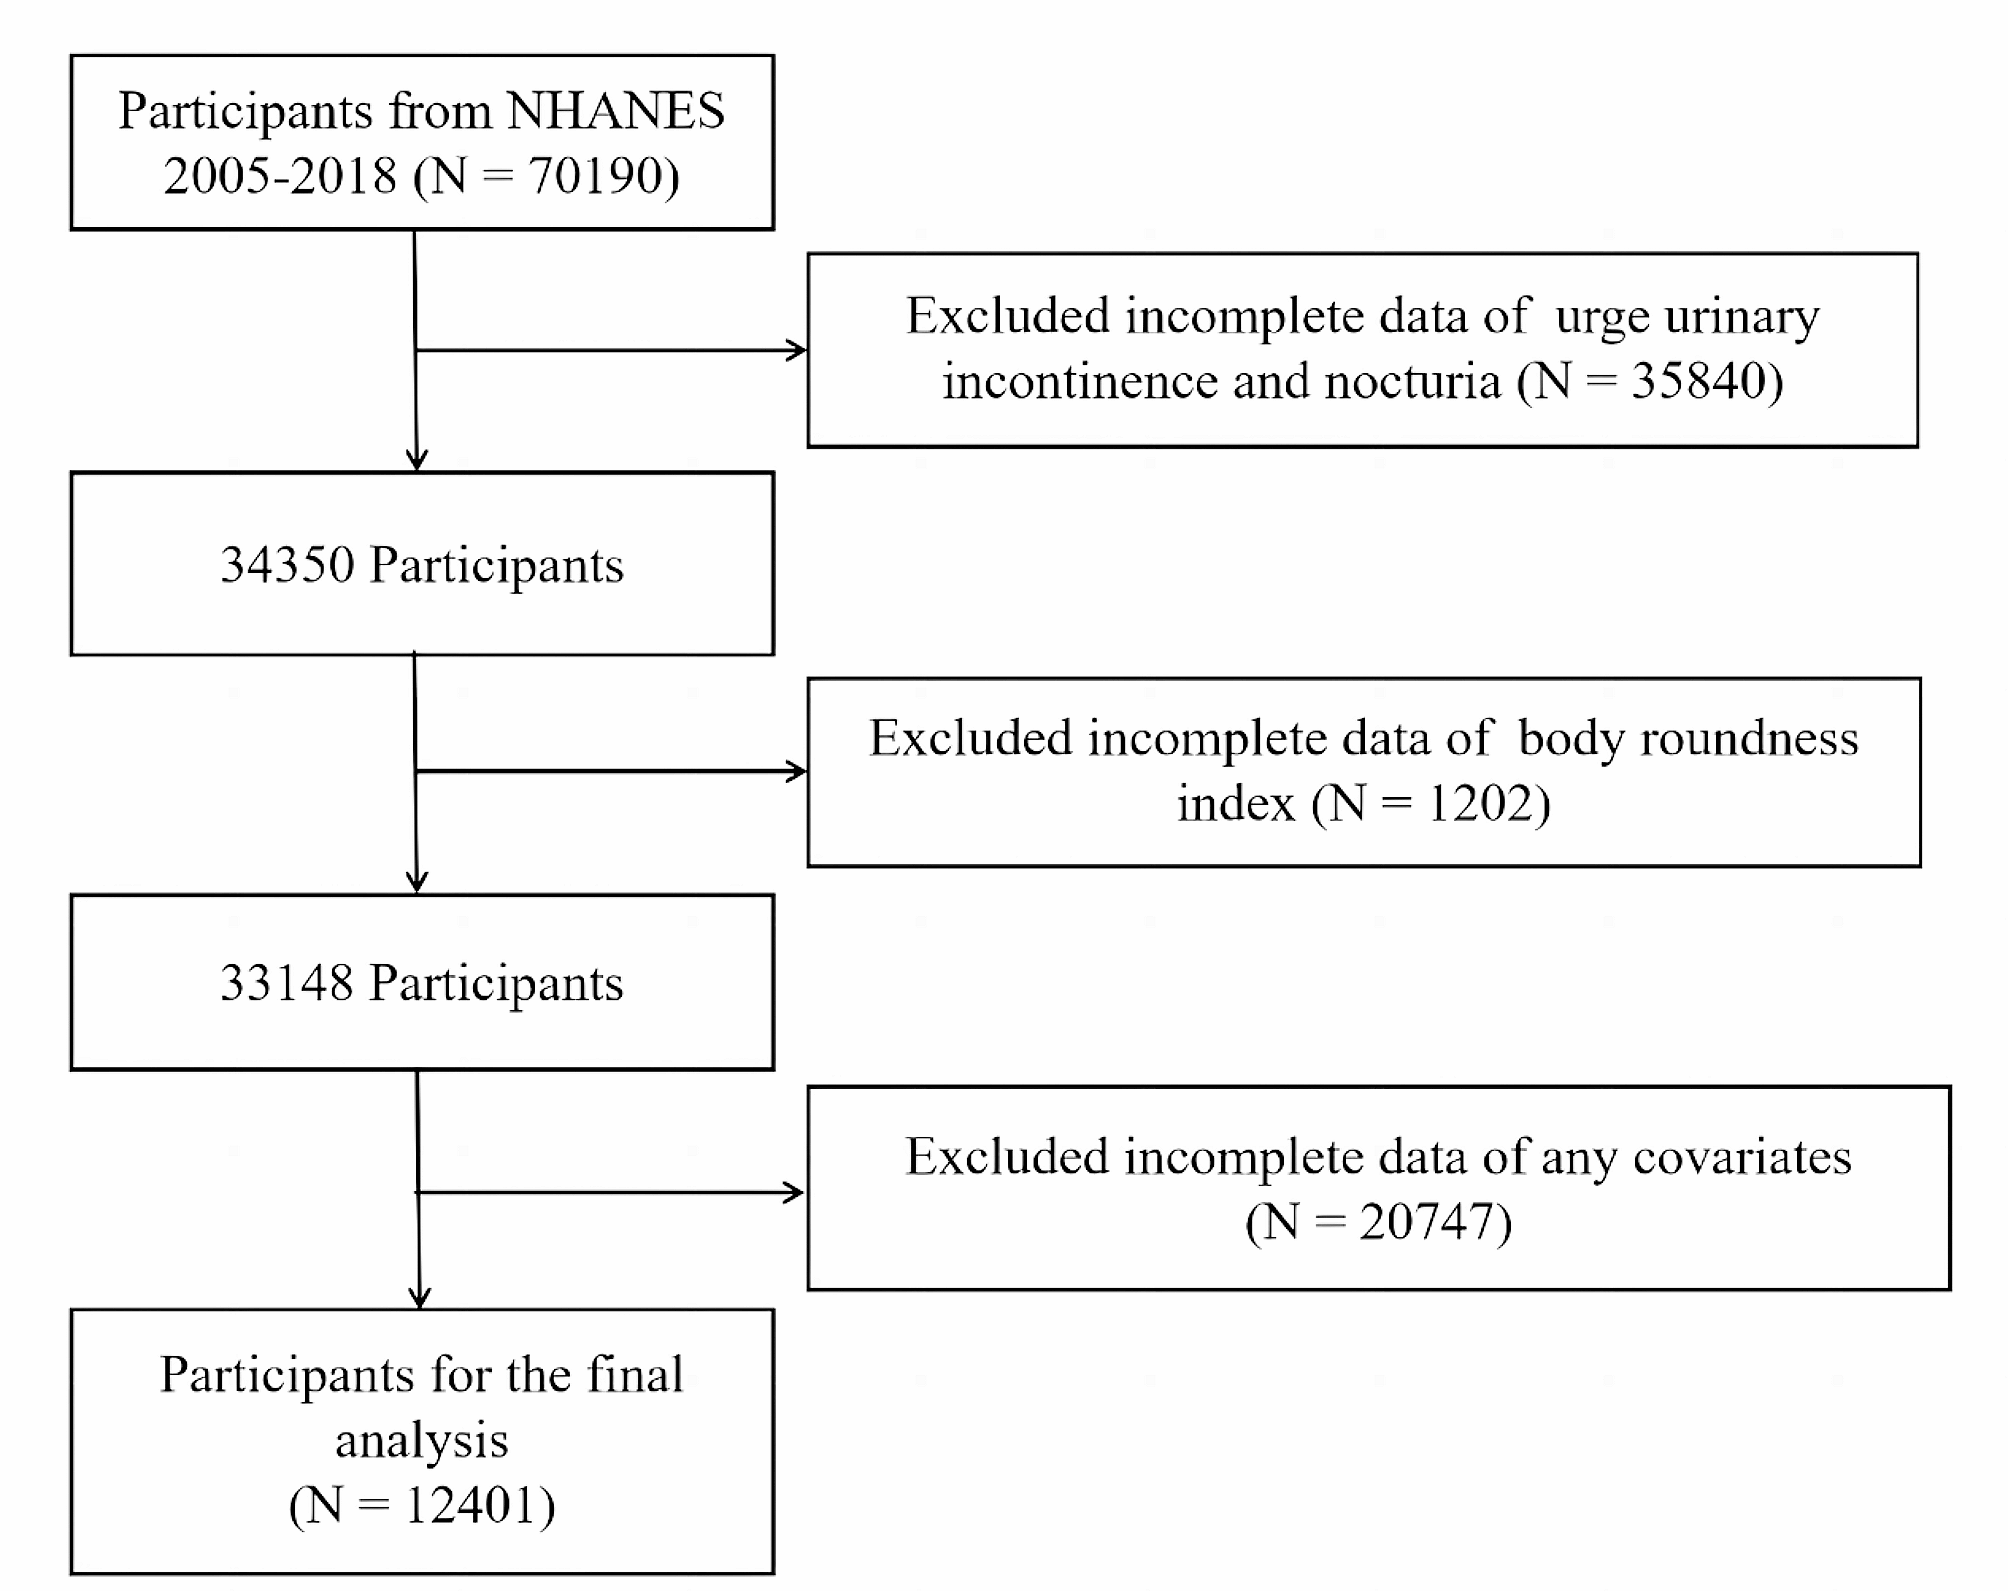
Datasets from the NHANES cycles of 2013–2014, 2015–2016 and 2017–2018 were utilized in this study, as these were the only three cycles for which complete relevant data were available. Initially, 29,400 subjects were enrolled, containing 4,323 females aged 18 to 45 years. Rigorous criteria were applied to exclude subjects from the analysis. This involved excluding individuals who had missing information on the infertility questionnaire, those who refused to answer the questions and those who were unaware of the answers. Moreover, individuals with positive or missing results in the urine pregnancy test were also excluded, as were those with a history of hysterectomy or oophorectomy or an absence of relevant information regarding these procedures. Additionally, those without a history of pelvic inflammatory disease or without complete cholesterol (TC) or high-density lipoprotein (HDL) data were not taken into consideration for inclusion. Finally, individuals with missing information on the depression questionnaire were also excluded. After the screening process, a final sample size of 2,668 eligible subjects remained for the follow-up analysis. Among them, 305 were identified as infertility patients, while 2,363 served as controls. The detailed screening process is visually presented in Fig. 1.
Fig. 1
The flowchart of the study populations screened from the 2013–2018 NHANES cycles. a There is an overlap between the populations
Assessment of infertilitySelf-reported infertility was defined using the reproductive health item in the questionnaire data module (RHQ074). Individuals who responded affirmatively ("Yes") were categorized into the infertility group, while those who responded negatively ("No") were allocated to the control group. Participants who declined to answer or were unaware of their status were systematically excluded from the analysis to ensure the integrity and accuracy of the findings.
Evaluation of depression statesThe Patient Health Questionnaire-9 (PHQ-9) was utilized to evaluate the participants' depression states in the mental health section of the questionnaire data module. Comprising nine items, the PHQ-9 serves as a screening tool intended to assess the degree of depression that a person has experienced during the last two weeks. It also provides valuable insights into a variety of issues related to the emotional well-being of the participants. Participants' responses to each item on the PHQ-9 were recorded on a scale from "not at all" (0 points) to "nearly every day" (3 points), allowing for an assessment of depression levels. The scores from each participant's answers to the nine questions were then summed to calculate their depression score, which ranged from 0 to 27. These scores were subsequently categorized into three levels: no depression (0–4 points), minimal-to-mild depression (5–9 points) and moderate-to-severe depression (10 or more points) [22].
Calculation of the NHHRThe following equation was used to determine the NHHR based on the fasting participants' lipid profiles: NHHR = non-HDL-C/HDL-C, where non-HDL-C = TC-HDL-C. Prior to blood collection, each participant underwent a comprehensive venepuncture assessment, which included an interview and a fasting questionnaire. The venepuncture protocols varied based on factors such as the participant's age, appointment type and session time. Specifically, the appropriate Nipro 19-, 21-, or 23-gauge × ¾ Butterfly Needle, along with the corresponding Nipro Luer adapter for use with the 19/21/23-gauge Saf-TEZ® set, were carefully selected depending on the subject's vein condition. The obtained specimens were securely stored in Vacutainer® tubes of suitable size and type and preserved under optimal frozen conditions (–30 °C) until their transportation to the University of Minnesota for analysis using the Cobas 6000 Chemistry Analyzer. All the procedures strictly adhered to the quality assurance and quality control (QA/QC) protocols of NHANES, in accordance with the standards outlined in the Clinical Laboratory Improvement Act of 1988.
Selection of covariablesTo explore the relationships between depression, the NHHR and infertility, potential confounding factors were adjusted based on the previous literature and clinically relevant variables. Potential covariables in the demographic data module included age (as continuous), race (categorized as Mexican American, other Hispanic, non-Hispanic black, non-Hispanic white, non-Hispanic Asian and other/multiracial), educational level (categorized as less than high school, high school and more than high school), marital status (categorized as married/living with partner, widowed/divorced/separated and never married) and poverty income ratio (PIR, as continuous). All these demographic data were directly accessible from the NHANES database without necessitating any form of transformation or manipulation, which ensured the integrity and fidelity of the data.
Additionally, covariables in the dietary data module included dietary cholesterol intake (as continuous) and caloric intake (as continuous). These data were determined using the means of two 24-h retrospective surveys that provided comprehensive data on nutrient consumption, including total nutrient intake and total dietary supplements. BMI covariables were derived from the examination data module and categorized into four levels: underweight (< 18.5 kg/m2), normal weight (18.5 to < 25 kg/m2), overweight (25 to < 30 kg/m2) and obese (≥ 30 kg/m2).
Furthermore, potential covariables from the laboratory data module encompassed serum levels of cotinine, vitamin D, aspartate aminotransferase (AST), alanine aminotransferase (ALT), triglyceride (TG), uric acid (UA) and creatinine (Cr). These variables were considered continuous. The covariables in the questionnaire data module contained drinking status (categorized as never, former and current drinker), smoking status (categorized as never, former and current smoker), history of pelvic infection (categorized as yes and no), regular periods (categorized as yes and no), sleeplessness (categorized as yes and no), history of diabetes (categorized as yes and no), history of hypertension (categorized as yes and no), physical activity (categorized as insufficient and sufficient) and sedentary behaviour (categorized as low sedentary time and high sedentary time).
The classification of history of pelvic infection, regular periods and sleeplessness can be directly divided according to the answer "yes" or "no". Participants' drinking status was ascertained through two pivotal inquiries: "Have you consumed at least 12 alcohol drinks in the past year?" and "Have you had at least 12 alcohol drinks in your lifetime?" Based on their responses, individuals were stratified as follows: those qualifying as current drinkers had consumed a minimum of 12 alcoholic drinks within the past year; former drinkers were defined as someone who had imbibed at least 12 alcoholic beverages in their lifetime but fewer than 12 drinks in the previous year; while those not meeting these criteria were categorized as never drinkers. Smoking status was assessed through two vital inquiries: "Have you smoked at least 100 cigarettes in your lifetime?" and "Do you currently smoke cigarettes?" Former smokers were classified as individuals who had smoked at least 100 cigarettes in their lifetime but were not presently smoking, while current smokers were those who were presently smoking. Individuals not meeting these criteria were categorized as never smokers. The history of diabetes was delineated as either receiving a diagnosis from a medical professional or utilizing insulin or diabetic pills to regulate blood sugar levels. Only those who met any of these conditions were considered to have diabetes. The history of hypertension was classified based on whether an individual had been diagnosed with hypertension by a doctor or was taking prescribed medications for hypertension. Only those who met any of these conditions were considered to have a history of hypertension.
In addition, the calculation of physical activity was derived from the metabolic equivalent (MET) scores indicated by the NHANES and the duration of the corresponding activity in a week (min). Individuals who were categorized as sufficiently active were those who met or above the cut-off point of 450 MET·min/week, while those who fell below this barrier were considered insufficiently active [23]. Sedentary behaviour was defined based on self-reported sedentary time, with a threshold of 6 h per day [23].
Statistical analysisThe statistical analysis was performed in accordance with the protocols specified in the NHANES, which take into account the complexity of multistage cluster surveys and incorporate the weighting of pertinent samples. Depending on the nature of the data, continuous variables were evaluated using either the weighted Student's t test or the Wilcoxon rank-sum test, and the outcomes are reported as the weighted mean (SE) ± standard deviation (SD). Categorical variables were analysed with the weighted chi-square test with Rao & Scott's second-order correction, and the results are represented as the unweighted number of cases (n) and percentage (%).
To examine the associations between depression and infertility, as well as between the NHHR and infertility, a multivariable logistic regression analysis was employed with the calculation of odds ratios (ORs) and 95% confidence intervals (CIs). In addition, a multivariable linear regression analysis was also utilized to explore the relationship between depression states and the NHHR, with the calculation of β and 95% CIs. Three different models were used for these analyses: the crude model (without any adjustment for covariables), Model 1 (with adjustment for age, BMI and race) and Model 2 (with further adjustment for educational level, PIR, marital status, smoking status, sleeplessness, drinking status, history of pelvic infection, regular periods, physical activity, sedentary behaviour, dietary cholesterol, calories, serum cotinine, serum vitamin D, history of diabetes, history of hypertension, creatinine, ALT, AST, TG and UA). The data types for these covariables were consistent with those described in "Selection of covariables" section.
In addition, to further elucidate whether the NHHR levels mediated the connection between depression states and female infertility, mediation analysis was also carried out. The total effect denotes the direct association between depression states and female infertility, independent of the mediating variable (the NHHR). The mediation effect (ME) refers to the impact of depression on infertility through the NHHR, while the direct effect denotes the effect of depression on infertility after for the management of the NHHR. A significant ME suggests the existence of a mediating effect. In addition, subgroup analyses that take age and BMI into account were utilized to further explore the association between depression and infertility. Age categorization was defined by the tertiles of the continuous data.
The statistical analyses in this study were carried out with R (version 4.2.2, available at http://www.R-project.org). In particular, the "car" package was utilized to estimate multicollinearity, with variance inflation factors (VIFs) greater than 2 deemed suggestive of potential multicollinearity. In the present study, all the VIFs were less than 2, ruling out multicollinearity. Statistical significance was defined as a two-sided P value less than 0.05.
留言 (0)