
記住我


Emerging evidence suggests that a MCD diet can induce MAFLD and lead to liver ferroptosis, which worsens liver damage [21]. To confirm the therapeutic efficacy of SWT in the treatment of MAFLD, we established MCD diet-induced mouse models and given different concentrations of SWT daily for 5 weeks (Fig. 1A). As the MCD diet continued, the mice gradually lost weight but SWT treatment did not improve this situation (Fig. S1A). However, compared to the MCD group, SWT treatment resulted in a concentration-dependent decrease in elevated serum alanine transaminase (ALT) and aspartate aminotransferase (AST) levels, indicating the hepatoprotective effect of SWT. Furthermore, SWT significantly reduced the levels of intrahepatic total cholesterol (TC), TG, and hydroxyproline (HYP) induced by the MCD diet. The decrease in liver SOD content caused by MCD was also restored after SWT treatment (Fig. 1B and Fig. S1B). Histological changes in the liver were also examined using hematoxylin and eosin (H&E) and sirius red staining. The MCD group showed significant hepatocyte steatosis, balloon-like degeneration, inflammatory response, and collagen deposition. However, all these phenomena were significantly improved after SWT administration, even surpassing the therapeutic effect of the positive drug silymarin (Fig. 1C and Fig. S1C). ADRP is located on the surface of cellular lipid droplets and is one of the main components of lipid droplets. Our ADRP staining results indicated that MCD but not MCD plus SWT administration significantly increased the number and size of lipid droplets in the liver. Staining of Fibronectin (FN1) and Albumin (ALB) also confirmed that MCD diet-induced liver fibrosis and hepatocyte damage, both of which were improved after SWT treatment (Fig. 1D–F and Fig. S1D). Additionally, the qPCR results of gene including interleukin 1 beta (Il1β), tumor necrosis factor alpha (Tnfα), actin alpha 2 (Acta2), collagen type I alpha 1 (Col1a1) and Fn1 also supported the anti-inflammatory and antifibrotic effects of SWT (Fig. 1G).
Fig. 1
SWT protected mice against MCD diet-induced liver injury. A Animal experimental flowchart. B Serum ALT, AST and liver TC, TG levels. C Representative images of H&E and Sirius Red staining of liver tissues. Scale bar = 100 μm. D Representative images of immunohistochemistry staining against ADRP staining of liver tissues. Scale bar = 100 μm. Representative images of immunofluorescence staining for FN1 E, ALB F and nuclear staining by DAPI. Scale bar = 50 μm. G Relative mRNA levels of Il1β, Tnfα, Acta2, Col1a1 and Fn1 in the livers. Statistical significance: ***P < 0.001, compared with control group; #P < 0.05, ##P < 0.01, ###P < 0.001, compared with MCD group. One-way ANOVA with Tukey’s post-hoc tests (n = 6)
Transcriptomic and lipidomic analysis of SWT treatment in MCD diet-fed miceRNA sequencing analysis was utilized to investigate potential mechanisms of SWT in combating MAFLD. In comparison to the MCS group, a total of 3544 differentially expressed genes (DEGs) were identified with a significance level of p < 0.05. Among these DEGs, there were 1933 up-regulated genes and 1611 down-regulated genes. Following SWT treatment, a comparison with the MCD group revealed 195 DEGs, consisting of 124 up-regulated genes and 71 down-regulated genes (Fig. S2A and S2B). Subsequently, enriched GO pathways in both the MCD and SWT groups were associated with FA metabolism, oxidative stress, inflammatory response, and AA metabolism. These GO pathways were significantly enriched in the SWT group as well (Fig. 2A, B). Additionally, KEGG enrichment analysis revealed that the pathways of unsaturated FA biosynthesis (mmu00061), AA metabolism (mmu00590), metabolic dysfunction-associated fatty liver disease (mmu04932) and ferroptosis (mmu04216) were enriched in both the MCD and SWT groups (Fig. 2C, D). These transcriptome results indicate that FA metabolism, particularly AA, may serve as a target for SWT treatment of MAFLD. Furthermore, the anti-MAFLD effect of SWT may also involve ferroptosis. To identify the key metabolites targeted by SWT in combating MAFLD, untargeted lipidomic analysis (ULA) were performed. The results showed that the abnormal accumulation of FAs, specifically AA, was reversed by SWT. Additionally, the abnormal accumulation of TG in the liver, which was characteristic of MAFLD, was significantly reduced after SWT treatment (Fig. 2E, F).
Fig. 2
SWT modulated gene expression in the transcriptome of liver tissues. A GO enrichment analysis of MCD group vs MCS group. B GO enrichment analysis of MCD + SWT group vs MCD group. C KEGG enrichment analysis of MCD group vs MCS group. D KEGG enrichment analysis of MCD + SWT group vs MCD group. E Metabolites of MCD group vs MCS group. F Metabolites MCD + SWT group vs MCD group. Statistical significance: *P < 0.05, **P < 0.01, ***P < 0.001, compared with control group. One-way ANOVA with Tukey’s post-hoc tests (n = 6)
SWT improves hepatic lipid accumulation by inhibiting TG synthesisAs shown in Fig. 3A, further analysis of different lipid profiles in ULA data revealed that TG (particularly TG containing AA) significantly accumulated in the MCD group. However, the use of SWT improved this situation. GSEA analysis demonstrated a significant decrease in DEGs associated with TG synthesis in the SWT group when compared to MCD stimulation (Fig. 3B). Additionally, we measured the levels of NEFA in the liver. The results of Fig. 3C illustrated that SWT reduced the abnormal accumulation of NEFA in a dose-dependent manner. FAs accumulated in the liver can be synthesized into TG in the endoplasmic reticulum through a series of regulatory enzymes including glycerol-3-phosphate acyltransferase (GPAT, Gpat3/Gpat4), 1-acylglycerol-3-phosphate O-acyltransferase (AGPAT, Agpat1), lipid phosphate phosphohydrolase (LIPIN, Lpin1) and diacylglycerol-O-acyltransferase (DGAT, Dgat1). These excess TG are subsequently stored in lipid droplets, resulting in hepatocyte steatosis in MAFLD (Fig. 3D). Then we performed qPCR to assess the mRNA content of the aforementioned TG synthesis-related enzymes in the liver. The mRNA levels of various regulatory enzymes involved in lipid metabolism, including Dgat1, were significantly down-regulated after SWT treatment compared to the MCD group (Fig. 3E). Immunofluorescence co-localization analysis of CALNEXIN and ADRP revealed that SWT inhibited lipid droplet synthesis in the endoplasmic reticulum in a dose-dependent manner (Fig. 3F, G). Furthermore, SWT administration increased the levels of reduced high-density lipoprotein (HDL) and very low-density lipoprotein (VLDL) in the serum (Fig. 3H), suggesting less TG was transferred into the liver. Interestingly, the mRNA contents of lipoprotein lipase (Lpl), apolipoprotein B (Apob), and apolipoprotein E (Apoe) in the liver were significantly reduced after SWT treatment, possibly due to the substantial decrease in TG synthesis in the liver and the efflux of HDL and VLDL (Fig. 3I).
Fig. 3
SWT reduced lipid accumulation in the livers by inhibiting TG synthesis and promoting its extrahepatic excretion. A The heatmaps of different TG content in the livers. B GSEA analysis of glycerolipid biosynthetic process-related pathway. C Liver NEFA levels. D Schematic diagram of TG synthesis. E Relative mRNA levels of GK, Gpat3, Gpat4, Agpat1, Lpin1 and Dgat1 in the livers. F Representative images of immunofluorescence staining for CALNEXIN, ADRP and nuclear staining by DAPI. Scale bar = 20 μm. G The diameter of Lipid droplets in the livers. H Serum HDL and VLDL levels. I Relative mRNA levels of Lpl, Apob and Apoe in the livers. Statistical significance: **P < 0.01, ***P < 0.001, compared with control group; #P < 0.05, ##P < 0.01, ###P < 0.001, compared with MCD group. One-way ANOVA with Tukey’s post-hoc tests (n = 6)
SWT improves MAFLD by inhibiting fatty acid synthesisFAs including FA (20:4), FA (22:4), and FA (22:5) were found to be significantly upregulated in the MCD group. However, after SWT treatment, the levels of these FAs were significantly down-regulated (Fig. 4A, B). Additionally, upon further analysis, we observed that almost all FAs and (O-acyl)-hydroxy fatty acids (OAHFAs) were up-regulated in the MCD group but downregulated after SWT treatment. Among these, the most notable change was observed in FA (20:4) (Fig. 4C, D), which aligned with the previous GO/KEGG enrichment results (Fig. 2A–D). GSEA analysis revealed a significant enrichment of DEGs related to FA metabolism in the MCD group but not in the MCD + SWT group (Fig. 4E). To further investigate the effect of SWT on FA synthesis, we conducted qPCR to measure the mRNA levels of sterol regulatory element binding transcription factor 1 (SREBP1, Srebf1), fatty acid synthase (Fasn), ATP-citrate lyase (Acly) and acetyl-CoA carboxylase alpha (Acaca). The results depicted in Fig. 4F demonstrated that SWT dose-dependently inhibited the abnormally elevated expression of genes involved in FA synthesis. This conclusion was further supported by the protein content detection results of FASN, precursor (Pre)-SREBP1, nuclear (N)-SREBP1 and peroxisome proliferator-activated receptor gamma (PPARγ) (Fig. 4G).
Fig. 4
SWT decreased lipid accumulation in the livers by inhibiting fatty acids synthesis. A The heatmap of differential metabolites of MCD group vs MCS group in the liver. B The heatmap of differential metabolites of MCD + SWT group vs MCD group in the liver. C The bubble plot of differential metabolites of MCD group vs MCS group in the liver. D The bubble plot of differential metabolites of MCD + SWT group vs MCD group in the liver. E GSEA analysis of fatty acid derivative metabolic process-related pathway. F Relative mRNA levels of Srebf1, Fasn, Acly and Acaca in the livers. G The protein levels of FASN, Pre-SREBP1, N-SREBP1, PPARγ and β-ACTIN in the livers. Statistical significance: *P < 0.05, **P < 0.01, ***P < 0.001, compared with control group; #P < 0.05, ##P < 0.01, ###P < 0.001, compared with MCD group. One-way ANOVA with Tukey’s post-hoc tests (n = 6)
SWT improves MAFLD by repairing damaged fatty acid β oxidationFAs, which are absorbed by transporters, bind to CoA in the cytoplasm and undergo degradation into fatty acyl-CoA. Subsequently, acyl-CoA is transferred to mitochondria by transferases including carnitine palmitoyl transferase 1 (CPT1), acylcarnitine translocation enzyme (CACT) and CPT2, which further participates in the β-oxidation of fatty acids (Fig. 5A) [22]. The mRNA levels of fatty acid binding protein 1 (Fabp1), Cpt1a, Cact, acyl-CoA dehydrogenase long chain (Acadl), enoyl-CoA hydratase short chain 1, (Echs1), hydroxyacyl-CoA dehydrogenase subunit alpha (Hadha), etc. were increased after SWT treatment, suggesting that SWT primarily affected the β-oxidation of long-chain fatty acids (LCFAs) (Fig. 5B, C). Additionally, the protein of CPT1A, the rate-limiting enzyme of FA β-oxidation, was also increased after SWT administration. Furthermore, our hypothesis was further supported by immunofluorescence results of increased CD36 and TOM20 after SWT treatment (Fig. 5D). Meanwhile, the level of acetyl CoA in the liver was decreased in a dose-dependent manner after SWT treatment (Fig. 5E). Given acetyl-CoA is the primary raw material for ATP production in the tricarboxylic acid cycle (TCA), we hypothesize that SWT promotes energy production in mitochondria by consuming acetyl-CoA produced through fatty acid β oxidation. After treated with SWT in AML12 cells, we observed a significant increase in the mitochondrial oxygen consumption rate (OCR), mitochondrial spare respiratory capacity and ATP production (Fig. 5F). Further, we investigated the effect of SWT on mitochondrial autophagy in AML12 cells to confirm its protective effect on mitochondria. Our findings revealed that SWT inhibited the fusion of mitochondrial autophagosomes and lysosomes in AML12 cells in a dose-dependent manner (Fig. 5G). In addition, the reduction of ROS in the liver also confirmed the protective effect of SWT on mitochondrial damage (Fig. 5H).
Fig. 5
SWT promoted hepatic fatty acid β-oxidation by improving mitochondrial damage of mice fed MCD diet. A Schematic diagram of fatty acid β-oxidation. B Relative mRNA levels of Fabp1, Cpt1a, Cact, Acadl, Echs1 and Hadha in the livers. C The protein levels of CPT1A and β-ACTIN in the livers. D Representative images of immunofluorescence staining for CD36, TOM20 and nuclear staining by DAPI. Scale bar = 20 μm. E Liver acetyl coenzyme A levels. F OCR influxes of AML12 cells detected by seahorse (n = 3/group). G Representative images of immunofluorescence staining for mKeima at 488 nm and 594 nm. Scale bar = 20 μm. H Representative images of immunofluorescence staining for ROS. Scale bar = 50 μm. Statistical significance: *P < 0.05, **P < 0.01, ***P < 0.001, compared with control group; #P < 0.05, ##P < 0.01, ###P < 0.001, compared with MCD group. One-way ANOVA with Tukey’s post-hoc tests (n = 6)
SWT inhibits MCD diet-induced ferroptosis by inhibiting arachidonic acid esterificationThen, we conducted a comprehensive analysis combining transcriptome and ULA. The findings revealed that SWT primarily influenced the metabolism of AA, linoleic acid, glycerophospholipids and choline (Fig. 6A, B). Notably, the content of AA significantly increased in MCD group but decreased after SWT administration, indicating that SWT primarily modulated AA metabolism in the MCD model (Fig. 2E, F). AA is an essential fatty acid that plays a crucial role in the human body, of which regulation is achieved through three metabolic pathways including cyclooxygenases (COX), lipoxygenases (LOX) and cytochrome P450 (CYP450) [23]. These pathways lead to the production of various substances, such as prostaglandins, thromboxanes, lipoxygenase, leukotrienes and hydroxy-eicosatetraenoic acid (Fig. 6C). Prostaglandin-endoperoxide synthase 1 (PTGS1, Ptgs1), the limited enzyme for prostaglandin synthesis, was increased in the MCD group. But SWT did not reverse this phenomenon. Additionally, the mRNA level of arachidonate 5-lipoxygenase activating protein (Alox5ap) was decreased after SWT treatment, indicating an inhibition in the production of pro-inflammatory mediators (Fig. 6D). But the levels of Alox5ap were also reduced in the MCD group, which was inconsistent with the elevated AA levels. Since esterification is another pathway of AA metabolism, we hypothesized that the AA produced in the MCD group was mainly metabolized by esterification and we noticed a significant increase in ACSL4 in the MCD group but decrease after treated with SWT (Fig. 6E). Furthermore, ACSL4 is also considered as one of the indicators of ferroptosis. Notably, there was an increase in the levels of promoting ferroptosis-related genes such as transferrin receptor (Tfr1), solute carrier family 39 member 14 (Slc39a14) and transformation related protein 53 (Trp53) accompanied with an inhibition of solute carrier family 7 member 11 (Slc7a11) in the MCD model group. However, this trend was reversed after SWT treatment, indicating that SWT effectively inhibited ferroptosis induced by MCD (Fig. 6F). The results of Prussian blue staining also confirmed that SWT significantly decreased iron ions in the liver (Fig. 6G). Moreover, the MCD group exhibited a significant increase in iron ions, ferrous ions and lipid peroxidation (LPO), along with a notable decrease in the antioxidant glutathione (GSH) content, which were also effectively reversed by the administration of SWT (Fig. 6H).
Fig. 6
SWT improved MCD diet-induced hepatocyte ferroptosis by regulating arachidonic acid metabolism. A The Venn diagram of RNA and metabolite of transcriptomics and lipidomics analysis. B The enrichment pathways between RNA and metabolite. C The map of arachidonic acid metabolism. D Relative mRNA levels of Ptgs1 and Alox5ap in the livers. E Relative mRNA levels of Acsl4 in the livers. F Relative mRNA levels of Tfr1, Slc39a14, Trp53 and Slc7a11 in the livers. G Representative images of Prussian Blue staining of liver tissues. Scale bar = 20 μm. H Liver iron, Fe2+, GSH and LPO levels. Statistical significance: *P < 0.05, **P < 0.01, ***P < 0.001, compared with control group; #P < 0.05, ##P < 0.01, ###P < 0.001, compared with MCD group. One-way ANOVA with Tukey’s post-hoc tests (n = 6)
SWT inhibits the OAPA and erastin-induced lipid accumulation and ferroptosis in hepatocytesConsidering that the process of lipid metabolism in the liver mainly occurs in hepatocytes, we then treated AML12 cells with OAPA and erastin to induce hepatic lipid accumulation and ferroptosis at the same time and mimic liver damage caused by the MCD diet in this study. Following the stimulation of OAPA and erastin, the mRNA level of glycerol kinase (Gk), Gpat3, Gpat4, Agpat1, Lpin1 and Dgat1 in AML12 cells were significantly increased, which was significantly reduced after SWT administration (Fig. 7A), providing evidence for both the success of our modeling and the inhibitory effect of SWT on TG synthesis. IF analysis of ADRP confirmed that SWT effectively suppressed lipid droplet synthesis and accumulation (Fig. 7B). Furthermore, we assessed the levels of FA synthetases (Fasn, acly, Acaca) and FA β-oxidation-related genes (Fabp1, Cpt1a, Cact, Acadl, Echs1 and Hadha). Our findings indicated that SWT inhibited fatty acid synthesis and promoted fatty acid β-oxidation in AML12 cells (Fig. 7C, D). Additionally, the protein levels of FASN, Pre-SREBP1, N-SREBP1, PPARγ, and CPT1A supported our findings in vivo (Fig. 7E). The IF results of CD36 and TOM20 also verified that SWT promoted the oxidation of LCFAs (Fig. 7F). Flow cytometry results of JC-1 further demonstrated the protective effect of SWT on mitochondrial damage, as evidenced by the increase of JC-1 aggregates after SWT administration (Fig. 7G).
Fig. 7
SWT improved lipid accumulation in AML12 cells by inhibiting TG, fatty acids synthesis and promoting fatty acids β-oxidation. A Relative mRNA levels of GK, Gpat3, Gpat4, Agpat1, Lpin1 and Dgat1 in AML12 cells. B Representative images of immunofluorescence staining for ADRP and nuclear staining by DAPI. Scale bar = 20 μm. C Relative mRNA levels of Fasn, Acly and Acaca in AML12 cells. D Relative mRNA levels of Fabp1, Cpt1a, Cact, Acadl, Echs1 and Hadha in AML12 cells. E The protein levels of FASN, Pre-SREBP1, N-SREBP1, PPARγ, CPT1A and β-ACTIN in the livers. F Representative images of immunofluorescence staining for CD36, TOM20 and nuclear staining by DAPI. Scale bar = 20 μm. G The mitochondrial membrane potential in AML12 cells was detected by flow cytometry using JC-1 dye. Statistical significance: *P < 0.05, **P < 0.01, ***P < 0.001, compared with control group; #P < 0.05, ##P < 0.01, ###P < 0.001, compared with OAPA + erastin group. One-way ANOVA with Tukey’s post-hoc tests (n = 6)
To investigate the effect of SWT in anti-ferroptosis, we performed qPCR to measure the mRNA content of Tfr1, Slc39a14, Trp53, Slc7a11 and Gpx4 in AML12 cells (Fig. 8A). The results of above mRNA reveal the role of SWT in inhibiting ferroptosis. We then examined the expression of gene involved in AA esterification-mediated ferroptosis through the ACSL4 signaling pathway in AML12 cells, including phospholipase A2 group VI (Pla2g6, limited enzyme of AA production), Acsl4, lysophosphatidylcholine acyltransferase 3 (Lpact3, promoting the esterification of PUFAs to phospholipids), arachidonate 15-lipoxygenase (Alox15, mediating phospholipid peroxidation), protein kinase C beta (Prkcb, promoting ACSL4 activation), and glutathione peroxidase 4 (Gpx4, inhibiting the production of lipid peroxides). The results indicated that SWT could inhibit AA-induced ferroptosis through inhibiting ACSL4 (Fig. 8B). Additionally, SWT administration also reduced the protein levels of ACSL4 and PCK2β (a sensor of lipid peroxides) in AML12 cells when compared to OAPA + erastin group (Fig. 8C). The contents of LPO, GSH, total iron ions and ferrous ions in AML12 cells were measured to demonstrate the anti- ferroptosis effect of SWT and results showed that SWT inhibited OAPA and erastin-induced ferroptosis (Fig. 8D, E). Additionally, the use of C11 BODIPY581/591, a fluorescent probe for lipid peroxidation, provided direct evidence of SWT's inhibition of OAPA and erastin-induced ferroptosis with more reduced prototype of C11 BODIPY581/591 and less oxidized C11 BODIPY581/591 (Fig. 8F). Furthermore, the anti-ferroptosis effect of SWT in hepatocytes was also confirmed through Prussian blue staining results (Fig. 8G).
Fig. 8
SWT alleviated ferroptosis of AML12 cells via inhibiting ACSL4-mediated arachidonic acid esterification. A Relative mRNA levels of Tfr1, Slc39a14, Trp53, Slc7a11 and Gpx4 in AML12 cells. B Relative mRNA levels of Pla2g6, Acsl4, Lpcat3, Alox15 and Prkcb in AML12 cells. C The protein levels of ACSL4, PKC2β and β-ACTIN in AML12 cells. D LPO and GSH levels in AML12 cells. E Total Fe and Fe2+ levels in AML12 cells. F Representative images of immunofluorescence staining for C11-BODIPY581/591 dye in AML12 cells. Scale bar = 20 μm. G Representative images of Prussian Blue staining of AML12 cells. Scale bar = 100 μm. Statistical significance: *P < 0.05, **P < 0.01, ***P < 0.001, compared with control group; #P < 0.05, ##P < 0.01, ###P < 0.001, compared with OAPA + erastin group. One-way ANOVA with Tukey’s post-hoc tests (n = 6)
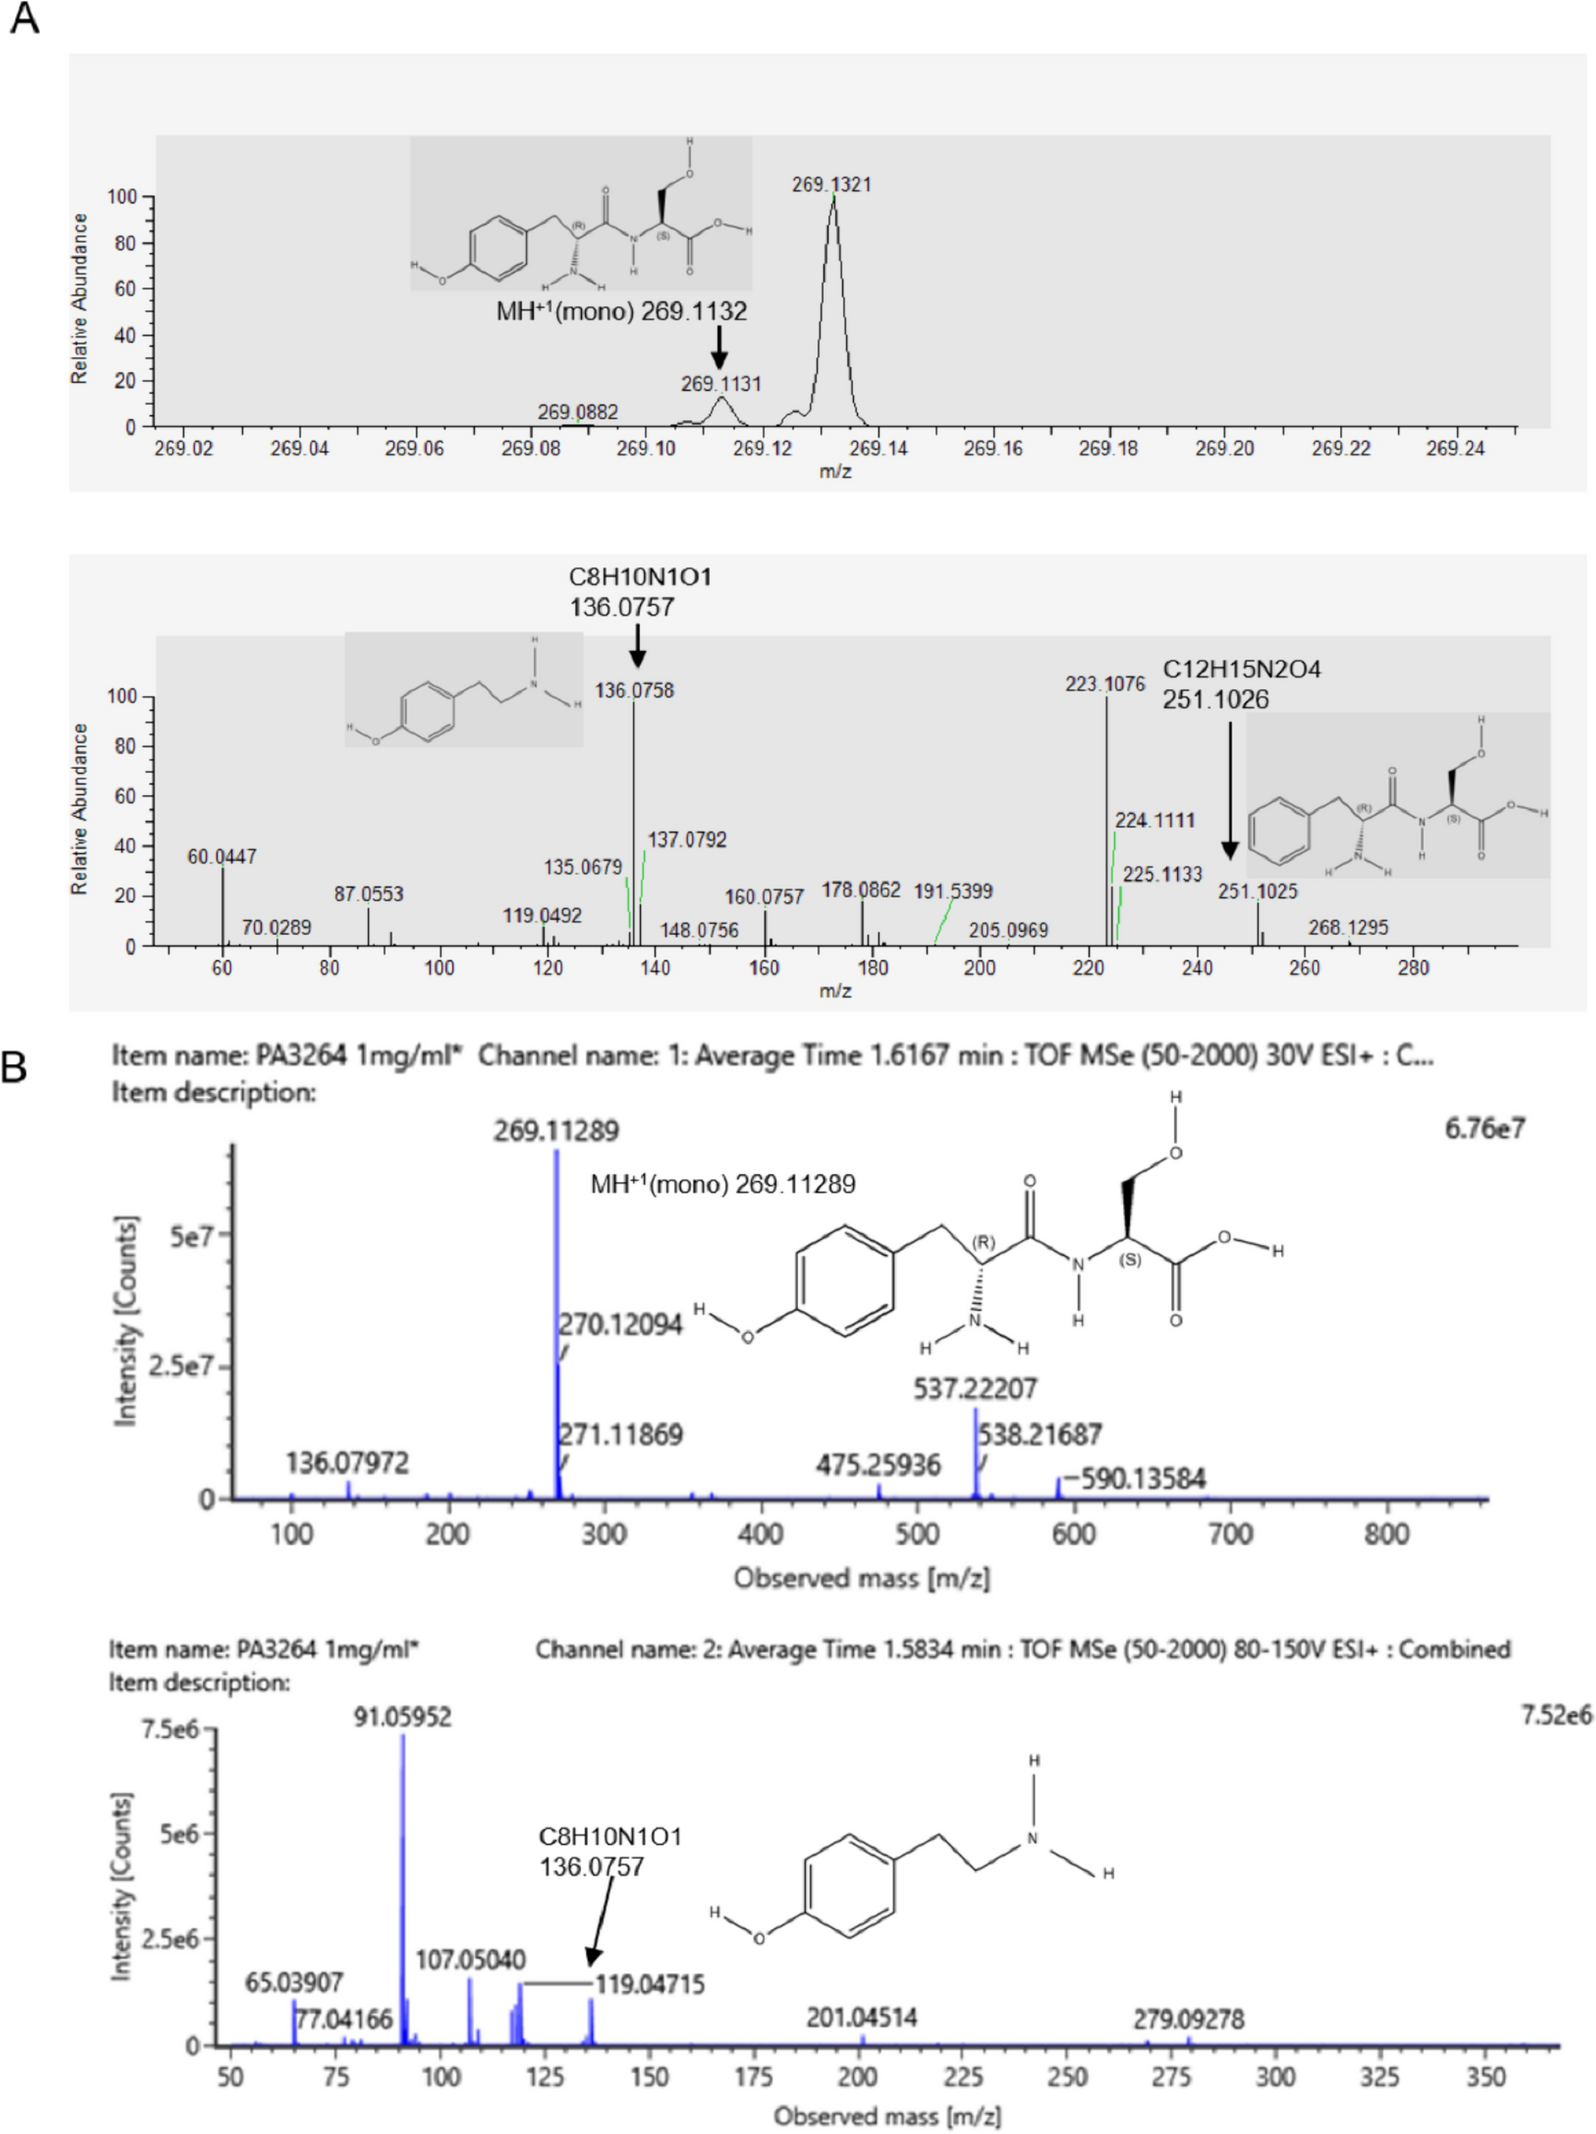
Identification and network pharmacological analysis of active ingredients in SWTTo identify the active ingredients in SWT responsible for the anti-MAFLD and anti-ferroptosis effects, the traditional Chinese medicine (TCM) component analysis was performed. The precursor and production spectrum of four major compounds (albiflorin, 3-N-butyl-4,5-dihydrophthalide, manninotriose and isochlorogenic acid A) identified in SWT were compared with HERB database and shown in Fig. 9A as representatives. The identified compounds in SWT were classified into different categories as shown in Fig. 9B, and the top 20 abundant compounds in SWT (Fig. 9C). According our results, turanose, albiflorin, 3-N-butyl-4,5-dihydrophthalide and other compounds might be the major active ingredients exerting anti-NALFD and anti-ferroptosis effects. Based on the TCMSP database, we further identified 112 target genes of these bioactive ingredients and conducted the “Herb-Ingredient-Gene” network diagram (Fig. 9D). To better understand the multiple component-multiple target mechanisms of SWT in alleviating MAFLD, these target genes of SWT and 1407 MAFLD related genes were collected from relevant databases for further analysis (Fig. 9E). A total 51 target genes were identified and the top 20 target genes were sorted by degree value using Cytoscape (Fig. 9F). Subsequently, GO and KEGG enrichment analysis of these genes were performed (Fig. 9G, H). The results revealed that MAFLD-related signaling pathways including cellular response to lipid (GO: 0071396), inflammatory response (Go: 0006954) and metabolic dysfunction-associated fatty liver disease (mmu04932) were enriched, which also proved the anti-MAFLD effect of SWT.
Fig. 9
Identification and network pharmacological analysis of active ingredients in SWT. A Product ion mass spectrum of albiflorin, 3-N-butyl-4,5-dihydrophthalide, manninotriose and isochlorogenic acid A. B The classification of compounds in SWT. C The top 20 most abundant compounds in SWT. D “Herb-Ingredient-Gene” network diagram of SWT. E The Venn diagram of the targeted genes between SWT and MAFLD. F The top 20 targeted genes sorted by degree value. G Go enrichment analysis results of the targeted genes between SWT and MAFLD. H KEGG enrichment analysis results of the targeted genes between SWT and MAFLD
留言 (0)