Study design and data collection
This retrospective observational study used data from a nationwide inpatient administrative database, as well as medical facility statistics, from Japan. We used the Japanese Diagnosis Procedure Combination inpatient (DPC) database, which contains discharge abstracts and administrative claims data from > 1200 acute-care hospitals in Japan that voluntarily contributed to the database [11]. The database includes the following patient-level data for all hospitalisations: demographics; diagnoses (recorded using International Classification of Diseases, Tenth Revision [ICD-10] codes); daily procedures (recorded using Japanese medical procedure codes); daily drug administrations; and admission and discharge statuses. A previous validation study of the DPC database showed that both the sensitivity and specificity of the procedures were high (> 90%) [12] .
We also used facility information and statistical data from the Survey of Medical Institutions 2018 [13], which was provided by the Ministry of Health, Labour and Welfare of Japan; and included medical facility statistics for all Japanese hospitals as of 1 July, 2018. The Survey of Medical Institutions included information on secondary medical areas, hospital zip codes, ward types, number of hospital beds in each ward, and hospital type. Secondary medical areas in Japan comprise 339 jurisdictions. Regional healthcare systems are planned based on each secondary medical area, to maintain general inpatient medical care, including IMV.
Study population
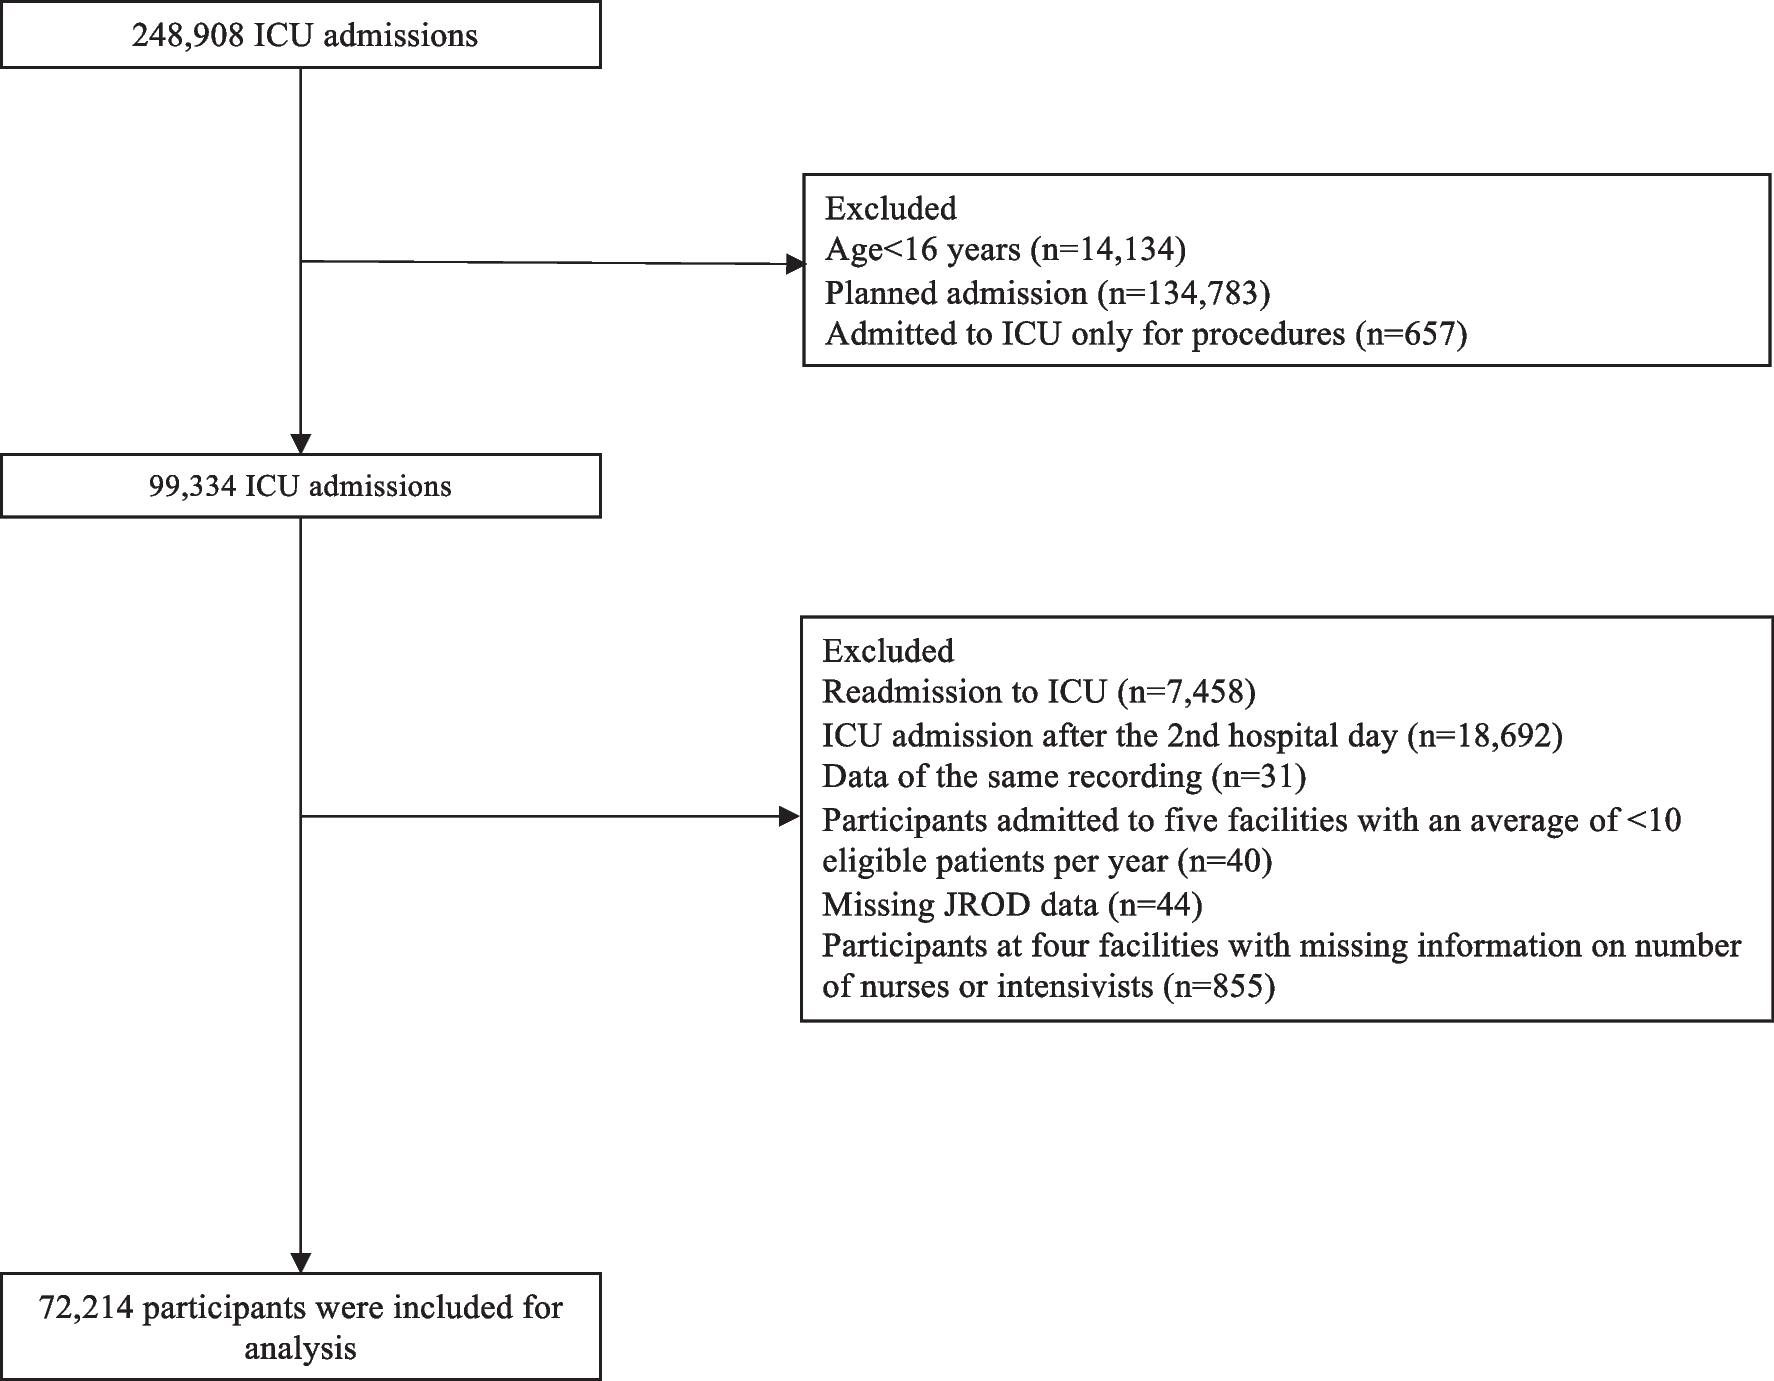
Using DPC data from 1 April, 2018, to 31 March, 2019 we identified all patients aged ≥ 15 years who received IMV during their hospitalisations. The choice of this period was informed by the need to evaluate ICU admissions in a non-disaster setting prior to the coronavirus disease 2019 pandemic. IMV was identified based on the Japanese procedure code J045, which includes IMV during hospitalisation but not during general anaesthesia, cardiopulmonary resuscitation, or at-home mechanical ventilation. The day of IMV initiation was defined as the earliest date of receiving IMV during hospitalization. If a patient received multiple courses of IMV during the same hospitalisation period, only the first course was included. Patients who received IMV only in rehabilitation or chronic beds (nurse-to-patient ratios of 1:13 and 1:15, respectively) were excluded because they were considered ventilator-dependent. Because hospital contributions to the DPC database were voluntary, we excluded patients on IMV who were admitted to hospitals in secondary medical areas—where the DPC database covers < 80% of all acute care beds (nurse-to-patient ratio of 1:10 or higher).
Definition of critical care beds
ICU was defined as a separate unit providing critical care services with at least one physician on site 24 h per day, at least two board-certified intensivists working full-time (only required for recourse-rich ICUs), around-the-clock nursing, the equipment necessary to care for critically ill patients, and a nurse-to-patient ratio of 1:2 [1, 14]. The high-dependency care unit (HDU), also called an ‘intermediate care unit’ or ‘step down unit’, was considered a unit where critical care services are provided to patients whose care level needs fell between those of the ICU and the general wards [15, 16]. HDU was therefore defined as almost identical to ICU but differed from ICU in that it had a nurse-to-patient ratio of 1:4 or 1:5 and did not require board-certified intensivists [14]. A general ward was defined as a general unit in an acute care hospital, with a nurse-to-patient ratio of 1:7 or 1:10, and without the necessary equipment to care for critically ill patients. Details of the Japanese procedure codes are provided in Supplemental Table 1.
Outcome and variables
The primary outcome was ICU admission on the day of IMV initiation. When patients were treated in hospitals without ICU beds and transferred to other hospitals on the day of IMV initiation, this was also considered an outcome because we considered them to have been transferred for ICU admission. The secondary outcomes were ICU or HDU admission after the day of IMV initiation, in-hospital mortality, length of hospital stay, length of IMV, length of ICU stay, and total hospitalisation costs.
The patient-level variables included age, sex, body mass index at admission, Charlson comorbidity index score, cognitive function before admission (no dementia, mild dementia, or moderate/severe dementia), long-term care needs before admission, home medical care before admission, location before hospitalization (home, another hospital, or nursing home), admission on a weekend (i.e. on Saturday or Sunday), ambulance use, emergency admission, surgery under general anaesthesia before IMV, cardiopulmonary resuscitation on the day of IMV initiation, length of hospital stay before IMV, primary diagnosis at admission, and geodetic distance (i.e. the length of the shortest curve between two points along the surface of a mathematical model of the earth) from the patient’s home to the nearest hospital with ICU beds.
Hospital-level variables included hospitals with ICU beds, number of ICU beds, number of HDU beds, number of acute-care beds, academic hospitals, tertiary emergency hospitals, annual number of ambulances, and annual IMV case volume per hospital.
Secondary medical areas were selected at the regional level. The regional-level variables were regions with ICU beds and the number of ICU, HDU, and acute care beds per 100,000 population in the region. Population data were obtained from the 2018 Japanese Population Census, and data for each secondary medical area were age-adjusted, sex-adjusted, and standardised to the general 2018 Japanese population [17].
Statistical analysis
We applied the framework of multilevel analysis to estimate the effects of variables measured at the subject and cluster levels, as described by Austin et al. [18,19,20] The study outcome of ICU admission was analysed using multilevel logistic regression with patients at the subject level, and hospitals or regions at the cluster level. The following three models were applied separately to analyse the hospitals and regions as clusters. Model 1 included only random intercepts for the clusters—that is, we allowed the baseline risk of ICU admission to vary between clusters and quantified the amount of variation in ICU admissions between clusters. Model 2 incorporates patient-level variables and random intercepts for each cluster. Model 3 integrated patient- and cluster-level variables, along with random intercepts for each cluster. The details of the models are presented in Supplemental Table 2. Using Model 3, we plotted the posterior means of the random effects to evaluate the cluster variation.
To estimate the general contextual effects (i.e., the effect of the cluster itself on subject outcomes), we calculated the intraclass correlation coefficient (ICC), median odds ratio (MOR), and proportional change in variance (PCV). An ICC of 0% indicated no cluster effect, whereas values approaching 100% indicated that the cluster itself determined ICU admission [18]. The MOR represents the magnitude of the cluster effect on a familiar odds ratio scale (MOR = 1 indicates lack of effect; larger or smaller values indicate greater variation) [18]. The PCV explained by adding patient- and cluster-level variables was calculated as the difference between Models 1 and 2, and between Models 2 and 3. To estimate the general contextual effects differently, we also calculated the changes in the area under the receiver operating characteristic curve (AUC) between the models, with Model 1 as the reference [18].
To estimate the specific contextual effects (i.e., the effect of cluster-level variables on subject outcomes), we calculated the 80% interval odds ratio (IOR-80%) and proportion of opposed odds ratios (POOR) in Model 3 [21, 22]. IOR-80% and POOR summarise the odds ratios of random comparisons of the exposed and non-exposed clusters. IOR-80% represents the distribution of the odds ratios and POOR is the proportion of odds ratios opposite to the overall odds ratio. Whenever the margins of the IOR cross 1, the effect of the cluster-level variable is considered small relative to the amount of variation between clusters. POOR values can range from 0 to 50%, with larger ones implying that the association is more heterogeneous.
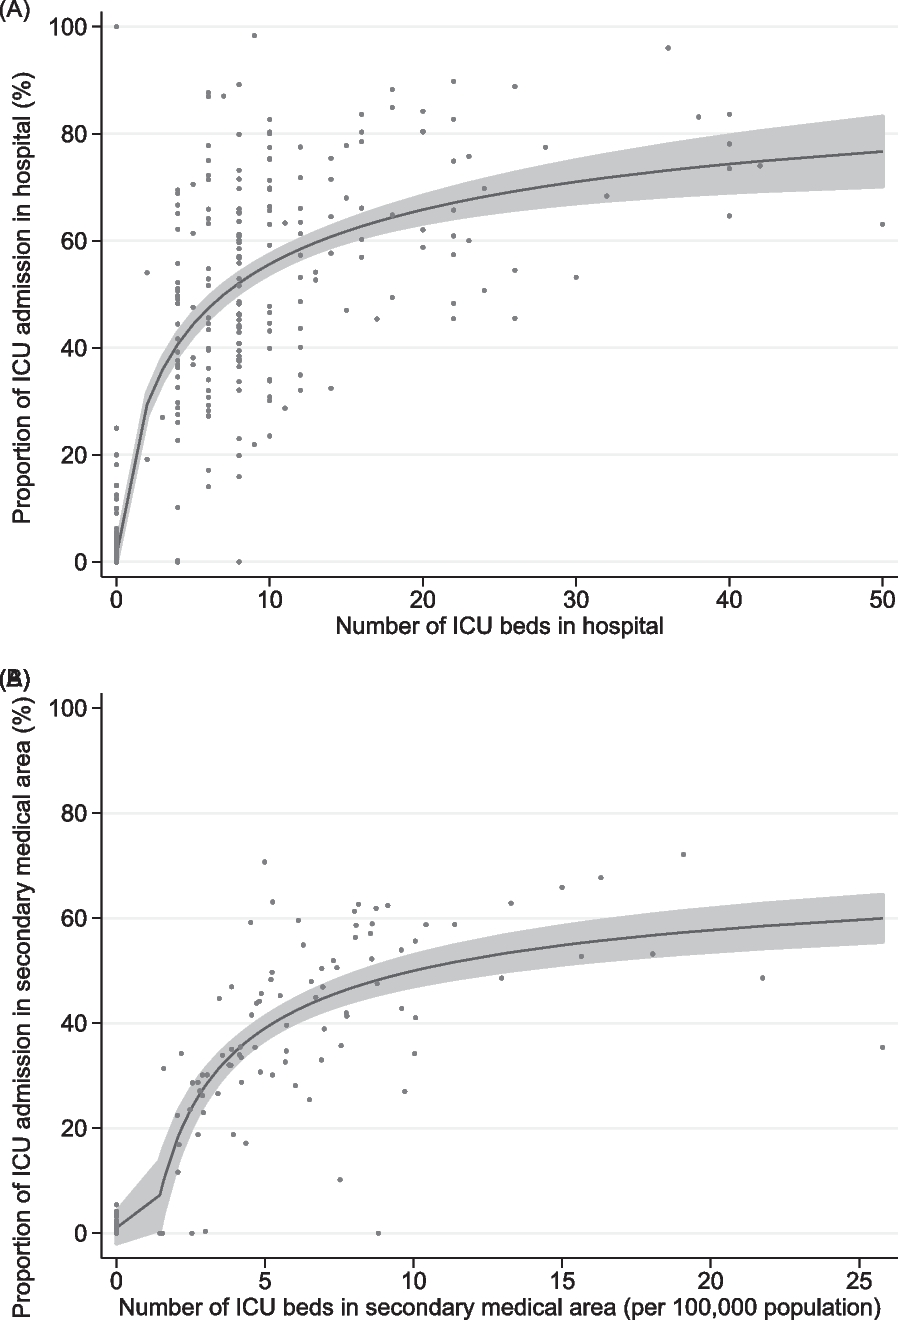
Descriptive statistics of variables are presented as medians and interquartile ranges (IQRs), means and standard deviations (SDs), or counts and percentages, as appropriate. Differences between groups were evaluated using standardised mean differences. The association between the number of ICU beds and the proportion of ICU admissions in a given hospital or secondary medical area is shown graphically using a fractional-polynomial prediction plot. All reported p-values are two-sided, and values of p < 0.05 were considered statistically significant. All analyses were performed using STATA/SE version 17.0 software (StataCorp LLC, College Station, TX, USA).
Sensitivity analyses were performed for hospitals and regions with at least one ICU bed to assess the general and specific contextual effects of hospitals and regions with ICU beds.


留言 (0)