
記住我


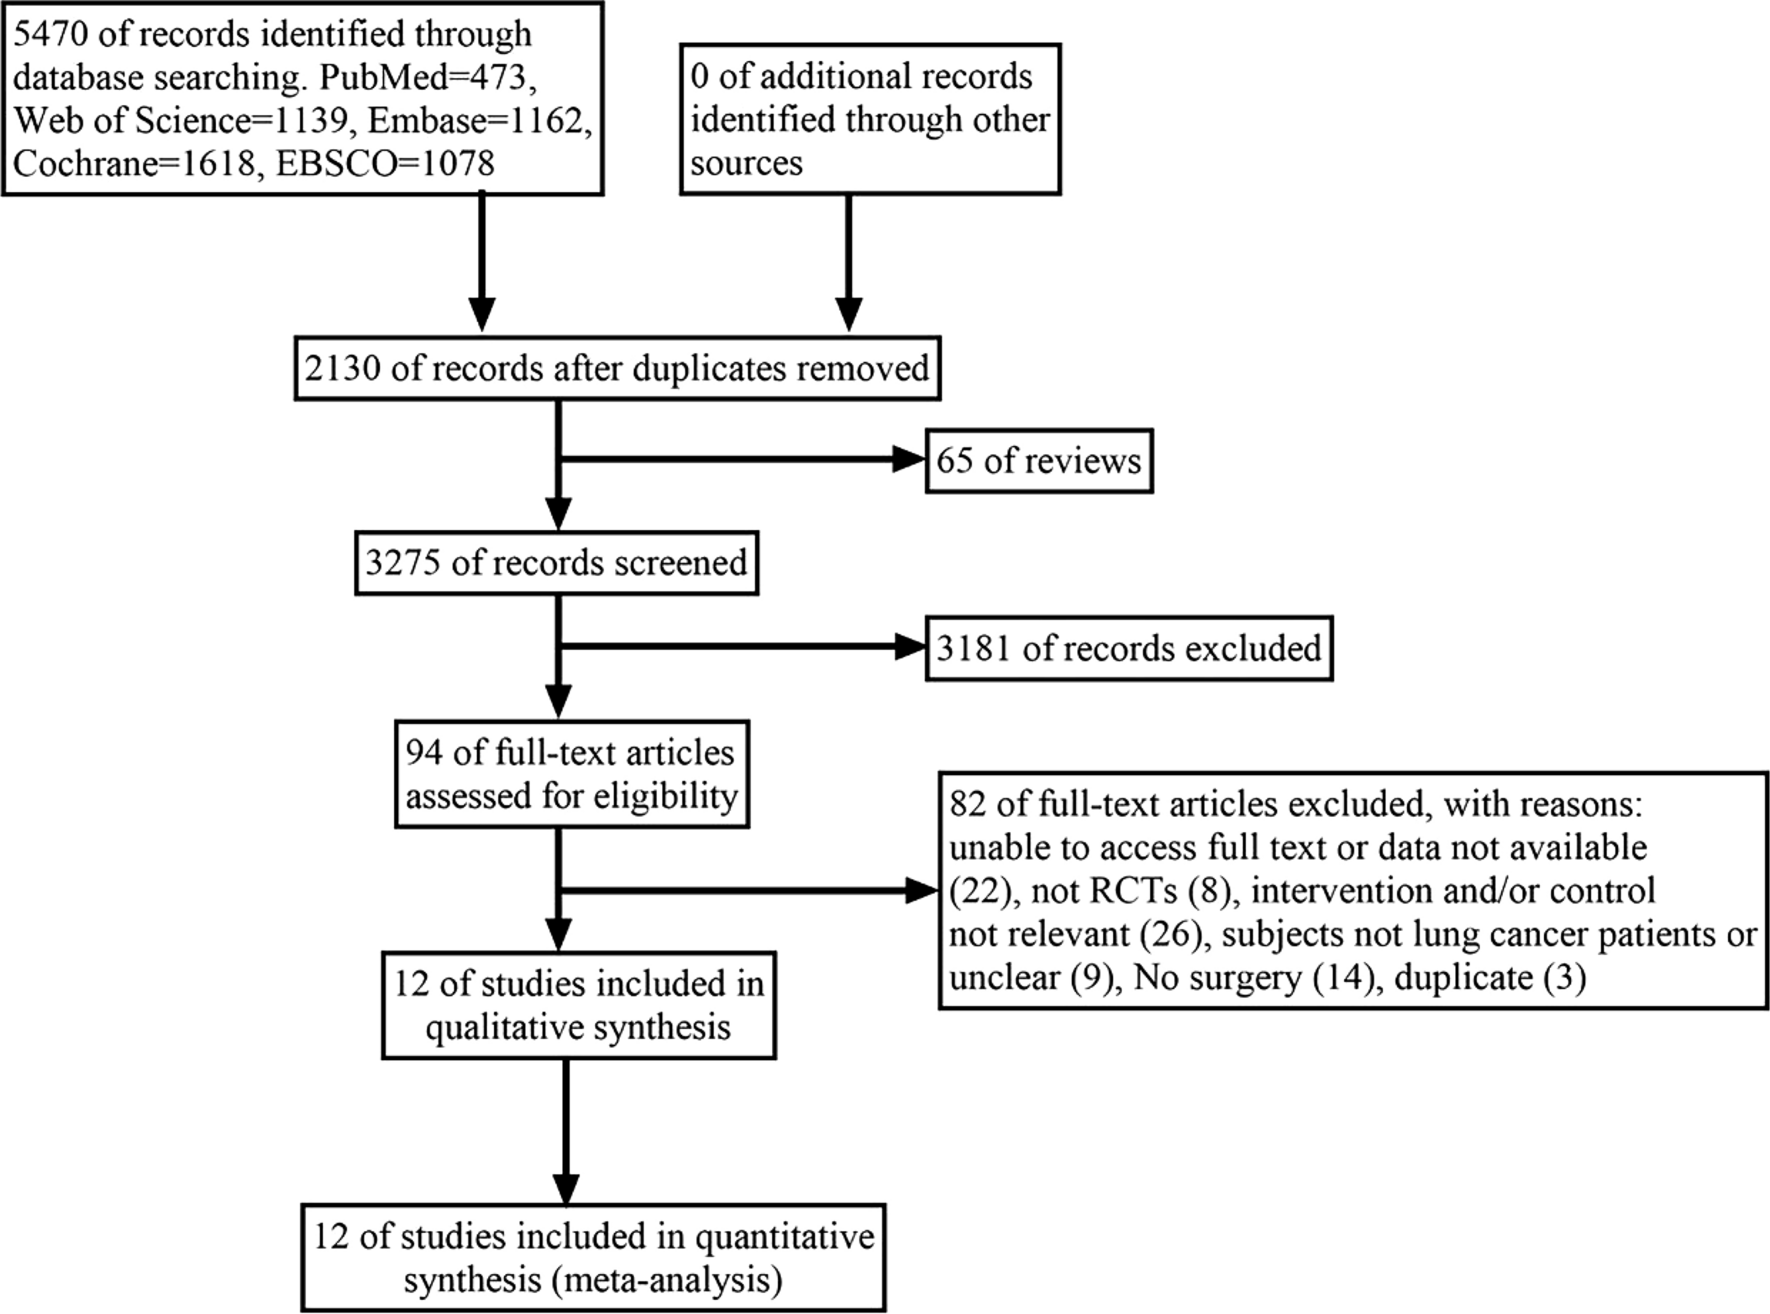


CECT imaging data from 246 patients diagnosed with neuroblastoma at our hospital from February 2012 to December 2022 were retrospectively collected. The patients were divided into three groups based on their MKI status (low = 83, intermediate = 80, high = 83) and randomly stratified into a training set and a testing set at a ratio of 8:2. To be eligible for inclusion in this retrospective study, patients had to meet the criteria of confirmed neuroblastoma with MKI status on their pathological report, first CECT without chemo-radiotherapy, and complete CECT imaging data with satisfied diagnostic imaging quality without artifacts. Patients with incomplete CECT imaging data or clinical information, as well as those who had undergone CECT with previous chemo-radiotherapy were excluded. The process of patient selection is detailed in Fig. 1.
Fig. 1
The process of patient selection
This study adhered to the CheckList for EvaluAtion of Radiomics research (CLEAR) endorsed by the European Society of Radiology [23]. The filled checklist is listed in the Supplementary Table 1. The radiomics quality score (QRS) was used to assess the report of this study [24]. This retrospective study was approved by the Institutional Review Board of Children's Hospital of Chongqing Medical University, and a waiver of patient consent to participate was obtained. All methods were performed in accordance with the relevant guidelines and regulations. Based on the count of cells displaying mitosis or nuclear fragmentation within a population of 5,000 tumor cells, MKI status was categorized into three groups: low-MKI (< 100/5000 cells or < 2%), intermediate-MKI (100 to 200/5000 cells or 2% to 4%), or high-MKI (> 200/5000 cells or > 4%) [22].
2.2 Image acquisitionChildren were examined in a calm state, and those who could not cooperate were sedated by professional anesthesiologists. The VCT 64 slice spiral CT (GE Healthcare, USA) scanner or the Brilliance iCT spiral CT (Philips, Netherlands) scanner was used to obtain arterial-phase CECT images. Tube voltage: 80–120 kV; tube current: 120–200 mAs; slice thickness: 5.0 mm; slice spacing: 5.0 mm. Nonionic iodinated contrast agent (Omnipaque 300 mg I/mL or Visipaque 320 mg I/ml, GE Healthcare) was used. The procedure involved injecting a contrast agent (1.5 ml–2 ml/kg of body weight) into the patient’s anterior brachial vein at a rate of 1–3 ml/s, followed by performing arterial-phase CECT scan at 15–30 s after the injection, respectively.
2.3 Image segmentationThe initial step of the radiomics analysis included uploading the CECT images of all patients to a research platform called uAI Research Portal (version 20240130, https://urp.united-imaging.com/) [25]. In this study, we performed both consensus-based segmentation and reliability analysis [26]. Regarding the consensus-based segmentation, a radiologist with 3 years of experience initially manually delineated the whole tumor region of interest (ROI) on arterial-phase CECT images, layer by layer. Subsequently, a three-dimensional ROI was generated. Another radiologist with 15 years of experience in tumor imaging validated all segmented ROIs (Fig. 2). Regarding the reliability analysis, 30 randomly selected cases included 10 cases from each of the low, intermediate, and high MKI groups from the training set to evaluate the inter-observer agreement of radiomics features, and the ROIs were re-segmented by the radiologists with 5 and 10 years of experience in pediatric imaging. The intra-class correlation coefficient (ICC) for the radiomics features extracted from the ROIs delineated in two separate segmentations was calculated. In this study, an ICC of type (2, 1) was used to assess reproducibility. This model, also known as the two-way random effects model for single measurement with absolute agreement, provides a comprehensive measure of both consistency and accuracy in the ratings [27].
Fig. 2
Examples of tumor region of interest delineation
2.4 Radiomics analysisThe radiomics analysis pipeline is detailed in Fig. 3. To standardize the voxel sizes, all CECT images were resampled using the B-spline interpolation algorithm to a voxel spacing of 1 mm * 1 mm * 1 mm, and a fixed bin number of 64 was also applied. Utilizing a fixed bin number in the discretization process before radiomics feature extraction aids in reducing the influence of noise while preserving the crucial textures of the regions of interest in the image [28]. Following image preprocessing, a total of 2264 radiomics features were automatically extracted from each ROI. In this study, PyRadiomics (version 3.0.1, https://pyradiomics.readthedocs.io/en/) was embedded in the uAI Research Portal software, so the extracted original radiomics features were all adhered to image biomarker standardization initiative (IBSI) [29].
Fig. 3
Workflow of radiomics pipeline used in this study
The first-order statistics group contained 18 features, such as energy, entropy, kurtosis, skewness, and percentiles (e.g., 10th and 90th). The shape-based features group contained 14 features, such as sphericity, surface area, voxel volume, and maximum 3D diameter. The texture features group included 72 features derived from different texture analysis methods, such as 21 gray level co-occurrence matrix (GLCM) features, 16 gray level run length matrix (GLRLM) features, 16 gray level size zone matrix (GLSZM) features, 5 neighboring gray tone difference matrix (NGTDM) features, and 14 gray level dependent matrix (GLDM) features, which can quantify regional heterogeneity differences. The study also applied 24 filters (Box Mean, Additive Gaussian Noise, Binomial Blur, Curvature Flow, Box-sigma, Normalize, Laplacian Sharpening, Discrete Gaussian, Mean, Speckle Noise, Recursive Gaussian, Shot noise, LoG (sigma: 0.5, 1, 1.5, 2), and Wavelet (LLL, LLH, LHL, LHH, HLL, HLH, HHL, HHH)) to obtain derived images, and then extracted first-order statistics and texture features based on the derived images (2160 derived features). The radiomics features were standardized using z-score normalization.
First, the radiomics features with an ICC of greater than 0.80 were considered to have agreeable reproducibility and were selected for further analysis. After assessing feature reproducibility, the study carried out three steps of feature selection in the training set. The features were statistically compared between groups using an ANOVA test, and a P-value cutoff of 0.05 was applied to obtain the top 50 significant radiomics features. Then, the radiomics features with a Pearson correlation coefficient greater than 0.90 were discarded to eliminate the highly correlated features. Furthermore, the most relevant radiomics features were selected using the least absolute shrinkage and selection operator (LASSO) method, with the optimal hyperparameter selected through a fivefold cross-validation. Lastly, a final random forest radiomics model was trained based on the retained features, and applied to the testing set. Additionally, a random forest radiomics model was trained to determine the predictive performance of individual radiomics features. The hyperparameters of the random forest model were determined using an automated method of hyperparameter optimization. Specifically, GridSearchCV from the ‘scikit-learn’ package was employed. The parameters of the random forest algorithm were configured as: criterion = entropy, max depth = 64, min samples leaf = 6, min samples split = 7, N estimators = 80, threshold = 0.5. In our study, we approached the three-class classification problem through a 'One versus Rest' strategy. This method essentially breaks down a multiclass problem into multiple binary problems. In this case, for our three-class problem, it led to three binary classification tasks. Each binary problem was tackled by considering one class versus the rest combined.
2.5 Statistical analysisThe statistical analysis was performed using SPSS software (version 26.0) and uAI Research Portal (version 20240130, https://urp.united-imaging.com/) software. Specifically, the Scikit-Learn library, an open-source machine learning library, was utilized to build the random forest model. The versions and dependencies were: Python: 3.7; Scikit-Learn: 0.23.2; Numpy: 1.19.2; Pandas: 1.1.3; Matplotlib: 3.3.2. ANOVA test was used for comparing quantitative data between the three groups, and chi-square test was used for comparing qualitative data between the three groups. A P-value less than 0.05 considered statistically significant. The diagnostic performance of the three-class classification radiomics model was evaluated using receiver operating characteristic (ROC) curve analysis. Area under the curve (AUC), 95% confidence interval (CI), accuracy, specificity, and sensitivity of the radiomics model were calculated. The clinical utility analysis of the radiomics model for predicting MKI status in the training and testing sets was made through decision curve analysis (DCA).
留言 (0)