
記住我

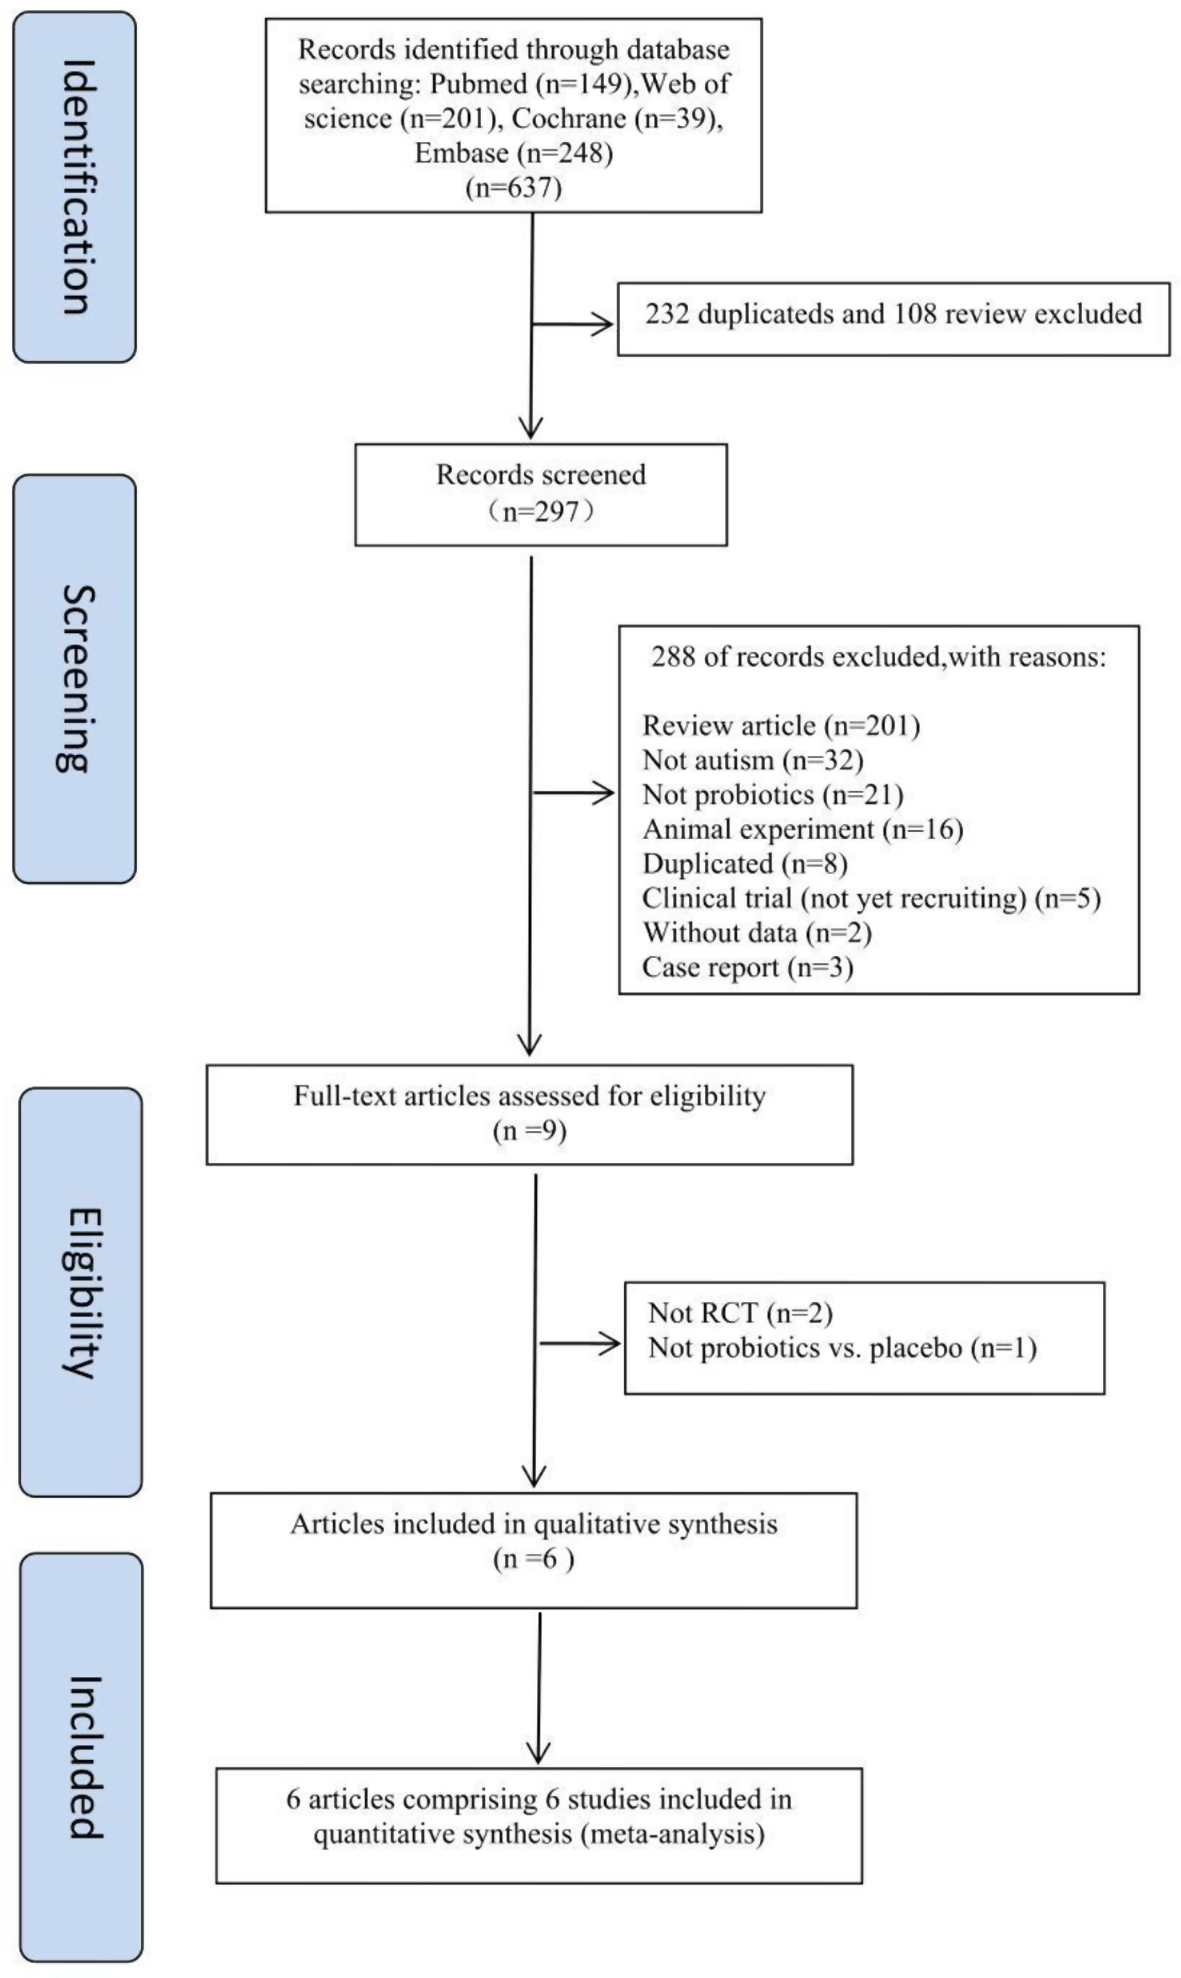
Due to the low number and heterogeneity of the included studies, a narrative synthesis was conducted to describe, organize, explore, and interpret their findings while examining their methodological adequacy. Table 2 describes the methodologies and results of the ten studies that we included.
Table 2 Methodologies and results of the investigated studiesSchool refusal behavior: analysis of risk factors and impacts on student well-beingThe role of self-conceptGonzalves et al. [23] identified various profiles of school refusal behavior and analyzed whether there were significant differences in the scores of eleven dimensions of self-concept construct (Physical appearance, Physical abilities, Parent relations, Same-sex relations, Opposite-sex relations, Honesty, Emotional stability, Self-esteem, Verbal, Math, and General school) among these different profiles. In this study, self- concept refers to the set of perceptions that form the image that a person has of themself and in its configuration, both cognitive and social aspects come into play. The study comprised 1315 Spanish students, ranging in age from 12 to 18 years. School refusal behavior was assessed using the School Refusal Assessment Scale-Revised (SRAS-R), a self-report measure consisting of 24 items. It is scored on a 7-point Likert scale (0 = never; 6 = always) and evaluates four conditions contributing to the maintenance of school refusal behavior: avoidance of school-related stimuli that provoke a sense of general negative affectivity (ANE), escape from aversive social and/or evaluative situations at school (ESE), pursuit of attention from significant others (PA), and pursuit of tangible reinforcement outside of the school setting (PTR). Of those four factors, the levels of reliability was ranged from 0.70 (Factor I) to 0.87 (Factor III). The coefficients of internal consistency (Cronbach’s alpha) obtained in the present study ranged from 0.71 (Factor IV) to 0.84 (Factor II). Self-concept was evaluated using the Self-Description Questionnaire (SDQ-II-Short Form), a self-report measure with 51 items scored on a 6-point Likert scale (1 = false; 6 = true) with a coefficient of internal consistency (Cronbach’s alpha) ranged from 0.60 (Opposite-sex relations) to 0.77 (Physical appearance). The study employed latent class analysis (LCA) to categorize participants based on school refusal behavior scores, specifically across the four functional dimensions of the SRAS-R. LCA, known for its precision, was chosen over K-means clustering to address limitations. Model fit was rigorously assessed using the Bayesian information criterion (BIC) and Entropy values to determine the optimal number of latent classes. After identifying school refusal behavior profiles, the study proceeded to analyze inter-class differences in scores on seven dimensions of self-concept using analysis of variance (ANOVA). Post hoc tests with the Bonferroni method were conducted to further explore specific group differences, and effect sizes (Cohen’s d index) were calculated to quantify the observed differences. The interpretation of Cohen’s d values followed established guidelines for effect magnitude. The results of the study revealed four distinct School Refusal Behavior profiles: Moderately High School Refusal Behavior, which included 489 students (37.2%) characterized by moderate scores in all SRAS-R dimensions; Moderately Low High School Refusal Behavior, which included 433 students (32.9%) characterized by a low level of school refusal behavior primarily driven by the pursuit of attention from significant others (the third factor of SRAS-R) and moderately low levels in the remaining SRAS-R dimensions; Mixed School Refusal Behavior, including 177 students (13.5%) with high levels of school refusal behavior driven by avoidance of school-related stimuli that provoke a sense of general negative affectivity, escape from aversive social and/or evaluative situations at school, and pursuit of attention from significant others (the first three dimensions of SRAS-R); Non-School Refusal Behavior, which included 216 students (16.4%) with low scores of school refusal behavior across all dimensions investigated by SRAS-R. Furthermore, the Mixed School Refusal Behavior group exhibited the lowest scores in self-concept, while the Non-School Refusal and Moderately Low School Refusal Behavior groups demonstrated the highest scores in all dimensions of self-concept. The study highlights that high levels of school refusal behavior in adolescents are associated with the avoidance of school-related stimuli that evoke a general sense of negative affectivity. This behavior includes escaping from aversive social and evaluative situations at school, as well as seeking attention from significant others. Additionally, these adolescents are at the greatest risk of having a negative self-perception.
Psychological factors: affective profile and school refusal behaviorIn a subsequent study, Gonzavez et al. [24] investigated different affective profiles and analyzed the differences between these profiles based on school refusal behavior. The study involved 1,816 Spanish adolescents (range age: 15–18 years). Affect was assessed using the Positive and Negative Affect Schedule Short Form (PANAS-C-SF), a 10-item self-report measure rated on a 5-point Likert scale (ranging from 1 = very slightly or never to 5 = very much). This scale consists of two subscales, measuring the positive affective dimensions (joyful, lively, happy, energetic, and proud) and the negative affective dimensions (depressed, angry, fearful/scared, afraid, and sad) of affectivity. The two subscales showed appropriate internal consistency values in the original study (positive affect.86; negative affect.82) and in this study (positive affect.82; negative affect.71). The study implemented a variety of statistical analyses, including both univariate and multivariate approaches, to explore the relationships between affectivity and school refusal behavior. Initially, Pearson’s product–moment correlation coefficient was employed to assess correlations between positive and negative affect and different conditions of school refusal behavior. Subsequently, Latent Profile Analysis (LPA) was conducted to identify cluster solutions for the two-factor conceptualization of affectivity. The study rigorously evaluated the fit of various LPA models using multiple fit statistics criteria, ensuring the selection of the most adequate class solution. To test group differences, a multivariate analysis of variance (MANOVA) was utilized, considering the dimensions of school refusal behavior between the identified affective profiles. The effect sizes were calculated using the d index to provide a measure of the observed differences. Latent profile analysis revealed five affective profiles: low affective profile (n = 40; 2.2% of the sample), self-fulfilling profile (n = 899; 49.5% of the sample), low positive affect profile (n = 698; 38.4% of the sample), self-destructive profile (n = 86; 4.7% of the sample), and high affective profile (n = 93; 5.1% of the sample). The researchers then examined the influence of four motivating factors for school refusal behavior: avoidance of stimuli that provoke negative affectivity (F1); escape from aversive social and/or evaluative situations (F2); pursuit of attention from significant others (F3); pursuit of tangible reinforcement outside of school (F4). These factors were assessed using the Spanish version of the School Refusal Assessment Scale-Revised for Children (SRAS-R-C), an 18-item self-report measure rated on a 7-point Likert scale (ranging from 0 = never to 6 = always). In this study, the coefficients of internal consistency were 0.64, 0.73, 0.78, and 0.56 for factors 1(ANE), 2(ESE), 3(PA), and 4(PTR), respectively. Statistically significant differences were observed among profiles in the four conditions of SRAS-R-C (p < 0.001; η2p = 0.03). Specifically, the “self-destructive profile” exhibited the highest average scores in the first three factors of the SRAS-R-C, while the “high affective profile” had the highest average scores in the fourth factor. These findings highlighted that the “self-destructive profile” represented the most maladaptive affective profile in terms of school refusal behavior. These findings underscore that the self-destructive profile is more related with school refusal behavior. Specifically, adolescents exhibiting traits such as fear, anger, nervousness, lack of interest, guilt, shame, and heightened temperamental sensitivity to negative stimuli are more prone to encountering difficulties in attending school, particularly in situations that elicit discomfort, anxiety, and/or depression.
Problematic internet use and school refusal behaviorFujita et al. [25]investigated the relationship between daily difficulties and Problematic Internet Use (PIU) in adolescents with School Refusal Behavior (SRB). Their specific objectives included examining differences in daily burdens between adolescents with PIU and those without PIU, as well as assessing the impact of depressive and anxiety symptoms on daily burdens among adolescents with PIU. They utilized the Internet Addiction Test (IAT), a self-report questionnaire that scores between 0 (minimum) and 100 (maximum), to analyze internet use and compare it between individuals with and without PIU. The sample comprised 227 students who were enrolled and exhibiting SRB. Daily difficulties were assessed using the Questionnaire-Children with Difficulties (QCD), administered by parents. Anxiety levels were quantified using the General Anxiety Disorder-7 (GAD-7), a 7-item self-report questionnaire scoring from 0 to 21, with scores of 11 or higher indicating significance and Cronbach’s alpha for the total score equal to 0.92. Depressive symptoms were assessed in students using the Patient Health Questionnaire-9 (PHQ-9), which includes 9 items with scores ranging from 0 to 27, and scores of 14 or more are considered significant; Cronbach’s alpha for the total score was 0.89. The study extensively utilized multivariate analyses, specifically linear regression models with adjustment for covariates, interaction terms, and multiple imputations to address missing data. These methods were employed to explore the associations between primary outcomes and Problematic Internet Use (PIU) while accounting for potential confounding variables such as age, sex, and various psychological diagnoses. Additionally, the authors conducted sensitivity analyses to assess the robustness of their findings, incorporating imputed responses and predictors under different assumptions about missing data patterns. Despite the absence of explicit mention in the abstracts, the study took careful measures to control for potential confounding factors and missing data issues. Among the 112 students with SRB who completed all the questionnaires, 46 (41.1%) exhibited PIU with an IAT score of 50 or higher. Compared to students without PIU, those with PIU exhibited significantly higher scores in the PHQ-9 and GAD-7 tests. No interactive effects were observed between PIU and depressive or anxious symptoms (p values < 0.5; 95%IC: -13,41 − 2,09). In summary, within the cohort of adolescents exhibiting school refusal behaviors, problematic internet use (PIU) appears to influence the daily difficulties assessed by parents. These difficulties induced by PIU were prevalent nearly all day and exhibited distinct characteristics when compared to symptoms of depression and anxiety.
School refusal behavior and cyberbullying: is there a link?Delgado et al. [26] analyzed the relationship between school refusal behavior and cyberbullying during the 2017–2018 academic year among 1,102 Spanish high school students aged 12–18 years (mean age 14.30; SD 1.71). The primary objective was to investigate differences in the School Refusal Assessment Scale-Revised (SRAS-R), a 24-item self-report questionnaire on a 7-point Likert scale, using Latent Class Analysis. In this study, the subscales of the questionnaire demonstrated an adequate reliability based on the Cronbach’s alpha values which were 0.77 for ANE, 0.75 for ESE, 0.80 for PA, and 0.78 for PTR. The study employs latent class analysis (LCA) to define profiles of School Refusal Behavior (SRB) based on the four functional conditions of the SARS-R. LCA is chosen as it is deemed most suitable for establishing profiles in large samples and addresses limitations found in other statistical techniques. The researchers use rigorous criteria, such as the Bayesian Information Criteria (BIC), Akaike Information Criterion (AIC), and Entropy, to determine the optimal number of classes that best represent the research data. This ensures a robust classification of subjects into distinct classes based on their SRB profiles. To assess the differences in cyberbullying (victimization, aggression, observation, and aggression-victimization) between the identified classes of SRB, the study employs ANOVAs, followed by post hoc Scheffé tests to identify specific groups with statistically significant differences. Additionally, the calculation of the d index (standardized mean difference) proposed by Cohen allows for the assessment of the magnitude or effect size of the observed differences. Three distinct profile groups were identified. The first group was labeled as “School Refusal Behavior (SRB) by negative reinforcements” (419 students or 38.02%), characterized by high levels of Avoidance of Negative Affectivity (ANE) and Escape from social and evaluative situations (ESE), and low levels of Pursuit of Attention (PA) and Pursuit of Tangible Reinforcement (PTR). The second group was labeled as “SRB by positive reinforcements” (389 students or 35.29%), marked by high levels of PA and PTR and low levels of ANA and ESE. The third profile consisted of “non-SRB students” (267 youths or 24.22%) with low scores across all four dimensions (ANA, ESE, PA, PTR). To assess differences in cyberbullying among the various SRB profiles, the Screening of Harassment Among Peers (SPH) questionnaire was administered. This self-report questionnaire consisted of 45 items with a Likert-like response scale (0 = never to 4 = always). Post hoc analysis revealed that students classified under the “SRB by negative reinforcements” profile exhibited higher rates of victimization, aggression, both victimization and aggression, and observation of cyberbullying compared to the other two groups. No differences were observed between the profiles of “SRB by positive reinforcements” and “non-SRB students. The study reveals that adolescents with a negative emotional component are more likely to exhibit school refusal behaviors to avoid negative emotions and social and academic evaluation situations. Moreover, these adolescents are more exposed to cyberbullying behaviors, both as victims and aggressor.
School refusal behavior in children and adolescents with neurodevelopmental disordersAutism spectrum disorder and school refusal behavior: the role of individual characteristic Ellen Kathrine Munkhaugen et al. [27] conducted a study to explore the individual characteristics associated with School refusal behavior (SRB) in students with autism spectrum disorder (ASD) comparing social executive functioning and emotional and behavioral problems between students with ASD and SRB and those with ASD without SRB. The study included a sample of 62 participants with ASD, without intellectual disability (range age: 9–16 years). Out of these participants, 33 exhibited ASD with SRB, while 29 had ASD without SRB. The school refusal behavior was evaluated with School Refusal Behavior questionnaire administered to parents. The executive functions were evaluated utilizing the Behavior Inventory of Executive Function (BRIEF), an 86-items parent-rated inventory employing a three-point Likert scale (1 = never a problem; 2 = sometimes a problem; 3 = often a problem). The BRIEF comprises eight subscales: Inhibit, Shift, Emotional, Control, Initiate, Working Memory, Plan/organize, Organization of materials and Monitor. Subsequently, the scores were transformed into a total score known as the Global Executive Composite (GEC). The severity of social impairment and ASD symptoms was evaluated using the Social Responsiveness Scale (SRS), a 64-item questionnaire rated on a four-point Likert scale (1 = not true; 2 = sometimes to; 3 = often true; 4 = almost always true). Additionally, emotional and behavioral problems were assessed through the Child Behavior Checklist (CBCL), a 112 items parent-self questionnaire rated on a three-point scale that consists of eight syndrome scales: Anxiety/Depressed; Withdrawn/Depressed, Somatic Complaints, Social Problems, Thought Problems, Attention Problems, Rule-Breaking Behaviors and Aggressive Behaviors. The study indeed employed a comprehensive set of statistical analyses to investigate the relationships and associations between different variables. The methods include univariate analyses, such as chi-square tests and t tests, as well as multivariate approaches like Multivariate Analysis of Variance (MANOVA), logistic regression, and stepwise logistic multiple regression. To control for multiple comparisons, the authors used Bonferroni correction within the subscales of SRS, BRIEF, and CBCL. Furthermore, effect sizes, specifically Cohen’s d, were calculated to assess the magnitude of the observed effects. The power calculations indicate that the sample size was adequate to detect medium to large effect sizes with sufficient statistical power. Overall, the study utilized a robust statistical approach to explore the relationships between variables while considering potential confounding factors. The study’s findings indicated significant difference between the two groups. There were differences in social functioning, as measured by the SRS, executive functions, as assessed by the BRIEF, and emotional and behavioral problems according to the CBCL. More specifically, differences were observed between students with and without SRB in the SRS Social Motivation subscale (p = 0.002; 95%IC: −17.1 to − 4.2; Cohen’s d = 0.8). Furthermore, the results demonstrated that the BRIEF GEC scores were higher in the student with ASD and SRB compared to those without SRB (p = 0.004; 95%IC: −12.8 to − 2.5; Cohen’s d = 0.7). Notably, two of eight subscales from the BRIEF showed differences between students with and without SRB: Initiate (p < 0.001; 95%IC: −17.3 to − 6.5; Cohen’s d = 1.1) and Plan/Organize (p < 0.001; 95%IC: −15.2 to − 4.5; Cohen’s d = 0.9). Finally, the CBCL results revealed higher problem scores in students with SRB compared to those without SRB (p = 0.001; 95%IC: −12.6 to − 2.5; 0.9 Cohen’s d). Differences were also identified between students with and without SRB across four of the eight CBCL subscales: Anxiety/Depression (p = 0.002; 95%IC: −12.7to − 2.1; Cohen’s d = 0.8), Withdrawn/Depressed (p < 0.001; 95%IC: −14.3to − 5.0; Cohen’s d = 1.2), Somatic Complaints (p = 0.005), and Thought Problems (p = 0.005; 95%IC: −11.0 to − 1.9; Cohen’s d = 0.7). These findings indicate that students with ASD and SRB, in contrast to those without SRB, exhibit lower social motivation, impaired abilities to initiate activities or tasks, difficulty generating ideas, responses, or problem-solving strategies, and display more symptoms of withdrawal and depression.
Bullying and correlates of school refusal in autistic youthVicki Bitsika et al. [28] examined the role of bullying in emerging school refusal behavior among autistic youth, as well as potential correlates of School Refusal (SR). These potential correlates included the frequency of bullying experiences, the age of the autistic youth, parental assessments of the challenges faced by their autistic children, and the levels of anxiety and depression in autistic youth. The study included 67 mothers and their autistic sons (range age: 7–18). Data collection involved the use of a questionnaire package consisting of three parts. The first part aimed to identify the child’s age and assess the difficulties they encountered; the second part focus on investigating experiences of bullying, while the third part included two standardized scales, namely the Generalized Anxiety Disorder (GAD) and Major Depressive Disorder (MDD) sections of the Child and Adolescent Symptom Inventory-revision 4 (CASI-4) that Child and Adolescent Symptom Inventory-revision 4 (CASI-4), that report satisfactory psychometric data, including a test–retest reliability of r = 0.67 (p < 0.001) over a six-week period and an internal consistency of 0.74. The study indeed employed a variety of statistical methods, including both univariate and multivariate approaches, to examine the associations and factors related to emerging school refusal (SR) in autistic boys. Univariate methods such as Pearson and Spearman correlational analyses, logistic regression, Chi-square statistics, MANOVA, ANOVA, and Spearman correlations were utilized. These methods allowed for the exploration of relationships between emerging school refusal and various variables, including age, ASD-related characteristics, anxiety and depression scores, and the frequency of being bullied. The results revealed that boys with SR exhibited significantly higher GAD (p = 0.023; η2 = 0.097) and MDD (p = 0.013; η2 = 0.116) than boys without SR. Importantly, it was found that only the frequency of being bullied made a significant contribution to the emergence of SR (p = 0.004; exp(b) = 4.367). In the present study, over four-fifths of boys with autism reported experiencing bullying at school. Among those boys who reported being bullied, more than half approached their parents, requesting to abstain from returning to school the following day due to the bullying incidents. A noteworthy association was observed between the request to avoid school and the prevalence and frequency of bullying. Being bullied was a statistically significant contributor to emerging SR and was identify as a potential major ‘predictor’ of emerging SR among autistic boys.
A. J. McClemont et al. [29] conducted an evaluation of various factors influencing school refusal behavior attributed to bullying. These factors included diagnoses of Autism Spectrum Disorder (ASD) and Attention-Deficit/Hyperactivity Disorder (ADHD), child characteristics (behavioral problems and communication abilities), demographic variables, and school-related factors. The study comprised 97 parents and 154 children (age range 4–16). Specifically, children were grouped according to parent-reported diagnosis: ASD (n = 36), ADHD (n = 16); ASD + ADHD (n = 31), other diagnosis (anxiety disorders, mood disorders, disruptive behavior disorder, learning disorder, language/communication disorders, sensory/auditory processing disorder; n = 15), and no diagnosis (n = 56). Parents reported the frequency and relevance of their child’s school refusal behavior due to bullying by answering a few questions using the four-point Likert scale. Firstly, an Analysis of Variance (ANOVA) with Bonferroni correction was utilized to investigate the effect of diagnosis on lifetime school refusal due to bullying. For examining predictors of school refusal frequency, a multilevel model was initially considered due to the inclusion of siblings in the dataset. However, a model accounting for variance within families did not improve over the linear model, and an ordinal logistic regression was ultimately selected for parsimony. The model-building approach involved entering sets of predictors to test hypotheses, and model fit was assessed by comparing the − 2 log likelihood with the Chi-square statistic. The pseudo R2 statistic was used to interpret the percent variance explained by each model. Continuous variables, specifically child grade, were modeled, and assumptions regarding skewness, kurtosis, and collinearity were carefully considered. The results report that 35% of parents reported that their child has never refused to attend school due to bullying. There was a significant difference among these groups in terms of lifetime instances of school refusal behavior due to bullying (p < 0.001). Furthermore, the frequency of school refusal due to bullying was significant for youth with diagnoses of ADHD (odds ratio (OR): 3.54, 95% CI: 1.00, 12.56) and ASD + ADHD (OR: 4.85, 95% CI: 1.50, 15.71). In addition, children with both ASD and ADHD were more likely to have experienced school refusal behavior due to bullying (68%) compared to children with ASD (28%) or those without any diagnosis (18%) (p < 0.001). In conclusion, the highest rate of school refusal over the lifespan due to bullying was found in children with concurrent ASD + ADHD. Children with ASD + ADHD may be particularly vulnerable or have difficulty managing bullying victimization. Moreover, the high rates of comorbidity between ADHD and disruptive behavior disorders (i.e., oppositional defiant disorder, conduct disorder) suggest that children with ADHD in this sample may also engage in disruptive behaviors. Such behaviors are associated with bullying and indicate that behavioral problems increase the likelihood of school refusal due to bullying.
School refusal behavior in children and adolescents with psychiatric disordersPersonality styles and functioning in adolescentsCarpentieri and colleagues [30] explored the differences in personality styles, adaptive functioning, and symptomatology between help-seeking adolescents with school refusal (SRa) and those who did not exhibit school refusal (non-SRa). The authors conducted a study involving 103 adolescent outpatients, with an average age of 16.2 (SD ± 1.14). Various scales and interviews were employed to characterize the study population, including the Hamilton Rating Scale for Anxiety (HAM-A) with a reliability index (Cronbach’s alpha) equal to 0.91, Hamilton Rating Scale for Depression (HAM-D) with a reliability index (Cronbach’s alpha) equal to 0.87, Young Mania Rating Scale (YMRS) with a reliability index (Cronbach’s alpha) equal to 0.79, Global Assessment of Functioning (GAF), Global Functioning Social Scale (GFSS), Global Functioning Role Scale (GFRS), and Shelder-Westen Assessment Procedure for Adolescents (SWAP-200-A) with a reliability index (Cronbach’s alpha) equal to > 0.80, with a median of 0.86. The study has undertaken several statistical analyses to explore associations and differences between groups related to School Refusal (SR), including socio-demographic variables and various measures of psychiatric symptoms. Although the term “multivariate analyses” is not explicitly mentioned, the study does employ a multivariable logistic regression to assess associations between several variables (GFSS, PD Schizotypal, PD Schizoid, HAM-A (tot), HAM-D (tot), and SR), thereby addressing potential confounding variables. The results revealed no significant differences between the two groups in terms of age, gender, school performance, parental education, annual financial income, or diagnosis. However, through independent Z-tests, it was observed that SRa individuals, in comparison to non-SRa individuals, exhibited higher levels of anxious and depressive symptoms (HAM-A p = 0.036; HAM-D p = 0.031), lower levels of global functioning (GAF, p < 0.001; GAF_past year, p = 0.025), as well as diminished levels of social and role functioning (GFSS, p = 0.003; GFRS, p = 0.002). SRa individuals also displayed higher rates of Schizoid (p = 0.046) and Schizotypal (p = 0.034) personality disorders. Furthermore, SRa individuals reported lower Health Functioning (p = 0.001) and a lower Q Health Index (p = 0.002). Finally, after the multivariable logistic regression model showed a significative effect only for GFSS (OR = 1.58, 95% CI: 1.00, 2.50, p = 0.05). SR has been shown to be closely linked to anxious and depressive symptomatology. Additionally, this study demonstrates that compromised adaptive functioning, particularly in the social domain, significantly increases the probability of SR. Regarding personality styles, it appears that emotional dysregulation, as well as self-criticism and a tendency toward self-inhibition, characterize individuals with SR to a greater extent.
Environmental factorsAl Keilani and Delvenne [8] investigated the role of environmental and family factors, as well as the influence of anxious and depressive symptoms on school refusal behavior. The study included a sample of 71 patients, ranging in age from 8 to 16 years, who were drawn from the Child and Adolescent Psychiatric Department of Queen Fabiola Children’s University Hospital. Clinical and demographic variables were assessed using a checklist developed by the authors, which included investigations about the patient’s gender, status, age of onset of school refusal behavior, age at assessment, duration of school refusal behavior, associated events, stressful life events, use of psychotropic medication, family psychiatric history, family composition, and individual psychiatric history. The study primarily relies on descriptive statistical analyses, providing means and standard deviations for the collected data. To compare samples, the study employs the T-student test and Mann-Whitney test. While these tests are useful for comparing means and distributions between two groups, the absence of explicit mention of multivariate analyses raises a concern about the potential control for confounding variables. The results revealed a significant gender difference: 70.42% of the participants with SR were male, compared to 29.57% who were female (p < 0.0003). School refusal behavior generally began in the first year (30.9%) or the second year (19.7%) of secondary school. Several risk factors were identified, including family separation (56.3%), conflicts at home (27%), contact rupture with the father (25.3%), maternal psychiatric illness (45.07%), paternal psychiatric illness (28.2%), academic difficulties (36.6%), and changing schools or moving homes (19.7%). Maltreatment was also prevalent in this population, with child abuse (30.9%), domestic violence (22.7%), child physical abuse (22.7%), neglect (27.2%), and child sexual abuse (27.2%) being reported. Regarding psychopathological diagnoses, anxiety (39.4%) and mood disorders (32.4%) were the most frequently observed conditions in the sample. A history of learning disabilities was noted in 30.56% of the inpatients. Finally, inpatients with SR exhibited a high frequency of relational difficulties with peers (48.57%). The results highlight that population exhibited more pronounced risk factors, including experiences of maltreatment, family separation or conflicts, and a parental history of psychiatric illness. Furthermore, school-related issues were prevalent in the cohort, with a quarter having experienced bullying and nearly half facing relational difficulties with peers. Additionally, one-third of patients had a history of learning disabilities.
Hikikomori syndrome in adolescentsXavier Benarous et al. [31] aimed to determine the prevalence of Hikikomori syndrome (HKM) in a group of French adolescents exhibiting a severe form of social withdrawal and/or school refusal (SW/SR). They also aimed to understand how these subjects differed from other types of SW/SR. The study involved: 38 adolescents with school refusal without withdrawal from family or peer relations; 7 adolescents with school refusal and withdrawal from peer relations but not from family relations; 4 adolescents with intermittent SW/SR over the past three months; 18 adolescents with severe neurodevelopmental disorders, such as autism or intellectual disability, who were staying at home while awaiting placement in a special education facility. The study comprised a retrospective chart review of 191 French adolescents aged 12–18 years (Mean = 15.0, 44% boys) consecutively admitted to two inpatient units from January 2017 to December 2019. To assess the level of functioning and symptom severity, various tools were utilized, including the Children-Global Assessment of Functioning scale (C-GAF), Clinical Global Impressions-Severity scale (CGI-S), DEP-ADO, and a questionnaire to document substance use in the previous 12 months. Results revealed that 7% of participants with SW/SR (n = 83) met the criteria for Hikikomori syndrome (HKM) (n = 14, Mean age = 14.3, 64% boys), accounting for one in six adolescents with SW/SR. The study primarily relies on bivariate analyses to compare various factors among different groups. The comparisons are conducted using non-parametric tests like the Mann-Whitney test for continuous variables and the Fisher exact test for categorical variables. Effect sizes are calculated using Cramer’s Phi correlation coefficient for categorical variables and Cliff’s Delta score for the Mann-Whitney tests. Youths with HKM did not significantly differ from other forms of SW/SR in terms of demographic factors, academic performance, or psychosocial factors. Anxiety disorders (14/14–100%) were the most frequently associated diagnosis in HKM+ (Hikikomori Syndrome with social withdrawal and/or school refusal), followed by depressive disorders (9/14–64%). Among those with SW/SR, HKM + vs. HKM- patients had higher rates of anxiety disorders (p < 0.001; Odds Ratio, OR = 35.2; ɸeffect size = 0.51) and lower rates of disruptive behavioral disorders (OR = 0.03). None of the HKM + reported using illicit drugs or alcohol, compared to 25% of youths with other SW/SR. Participants with anxiety and depressive disorders who met HKM criteria (15% and 9%, respectively) showed a longer duration of symptoms, longer hospitalization, and a greater need for daily care facilities at discharge than those with Hikikomori syndrome. The study found that individuals with HKM and SW/SR shown higher rates of anxiety disorder and lower incidence of disruptive behavioral disorder. Additionally, these participants exhibited a prolonged duration of symptoms, extended hospitalization, and a greater need for daily care facilities at discharge compared to those without HKM. This discovery aligns with the perspective of HKM as a concept, distinct from psychiatric disorder categories but still clinically relevant in identifying a constellation of individual, familial, and cultural factors that influence the healthcare trajectories of adolescents with SW/SR.
留言 (0)