Experimental design
All experiments were carried out in compliance with ARRIVE guidelines 2.0. Mice were randomly assigned to cages using a computer-generated randomization process. All measurements were standardized to ensure consistency and accuracy.
Animals
We used a total of 120 mice in our study. Each experimental and control group comprised 6 mice, based on our previous experience. Detailed information regarding the allocation of mice to specific experimental conditions is provided in the Materials and methods section. All female C57BL/6 mice (7–8 weeks old), purchased from GemPharmatech Co., Ltd. (China), were housed under specific pathogen-free (SPF) conditions. All mice were included in the experiment only after being confirmed to be free of any fundus or systemic diseases. Animal care and experimentation were conducted in accordance with the Association for Research in Vision and Ophthalmology (ARVO) Statement. In this study, tribromoethanol was used for anesthetizing mice, and cervical dislocation was employed for euthanizing the mice. All animal procedures were approved by the Animal Care and Use Committee of Tianjin Medical University Eye Hospital (TMUEC).
Culture and identification of mesenchymal stem cells
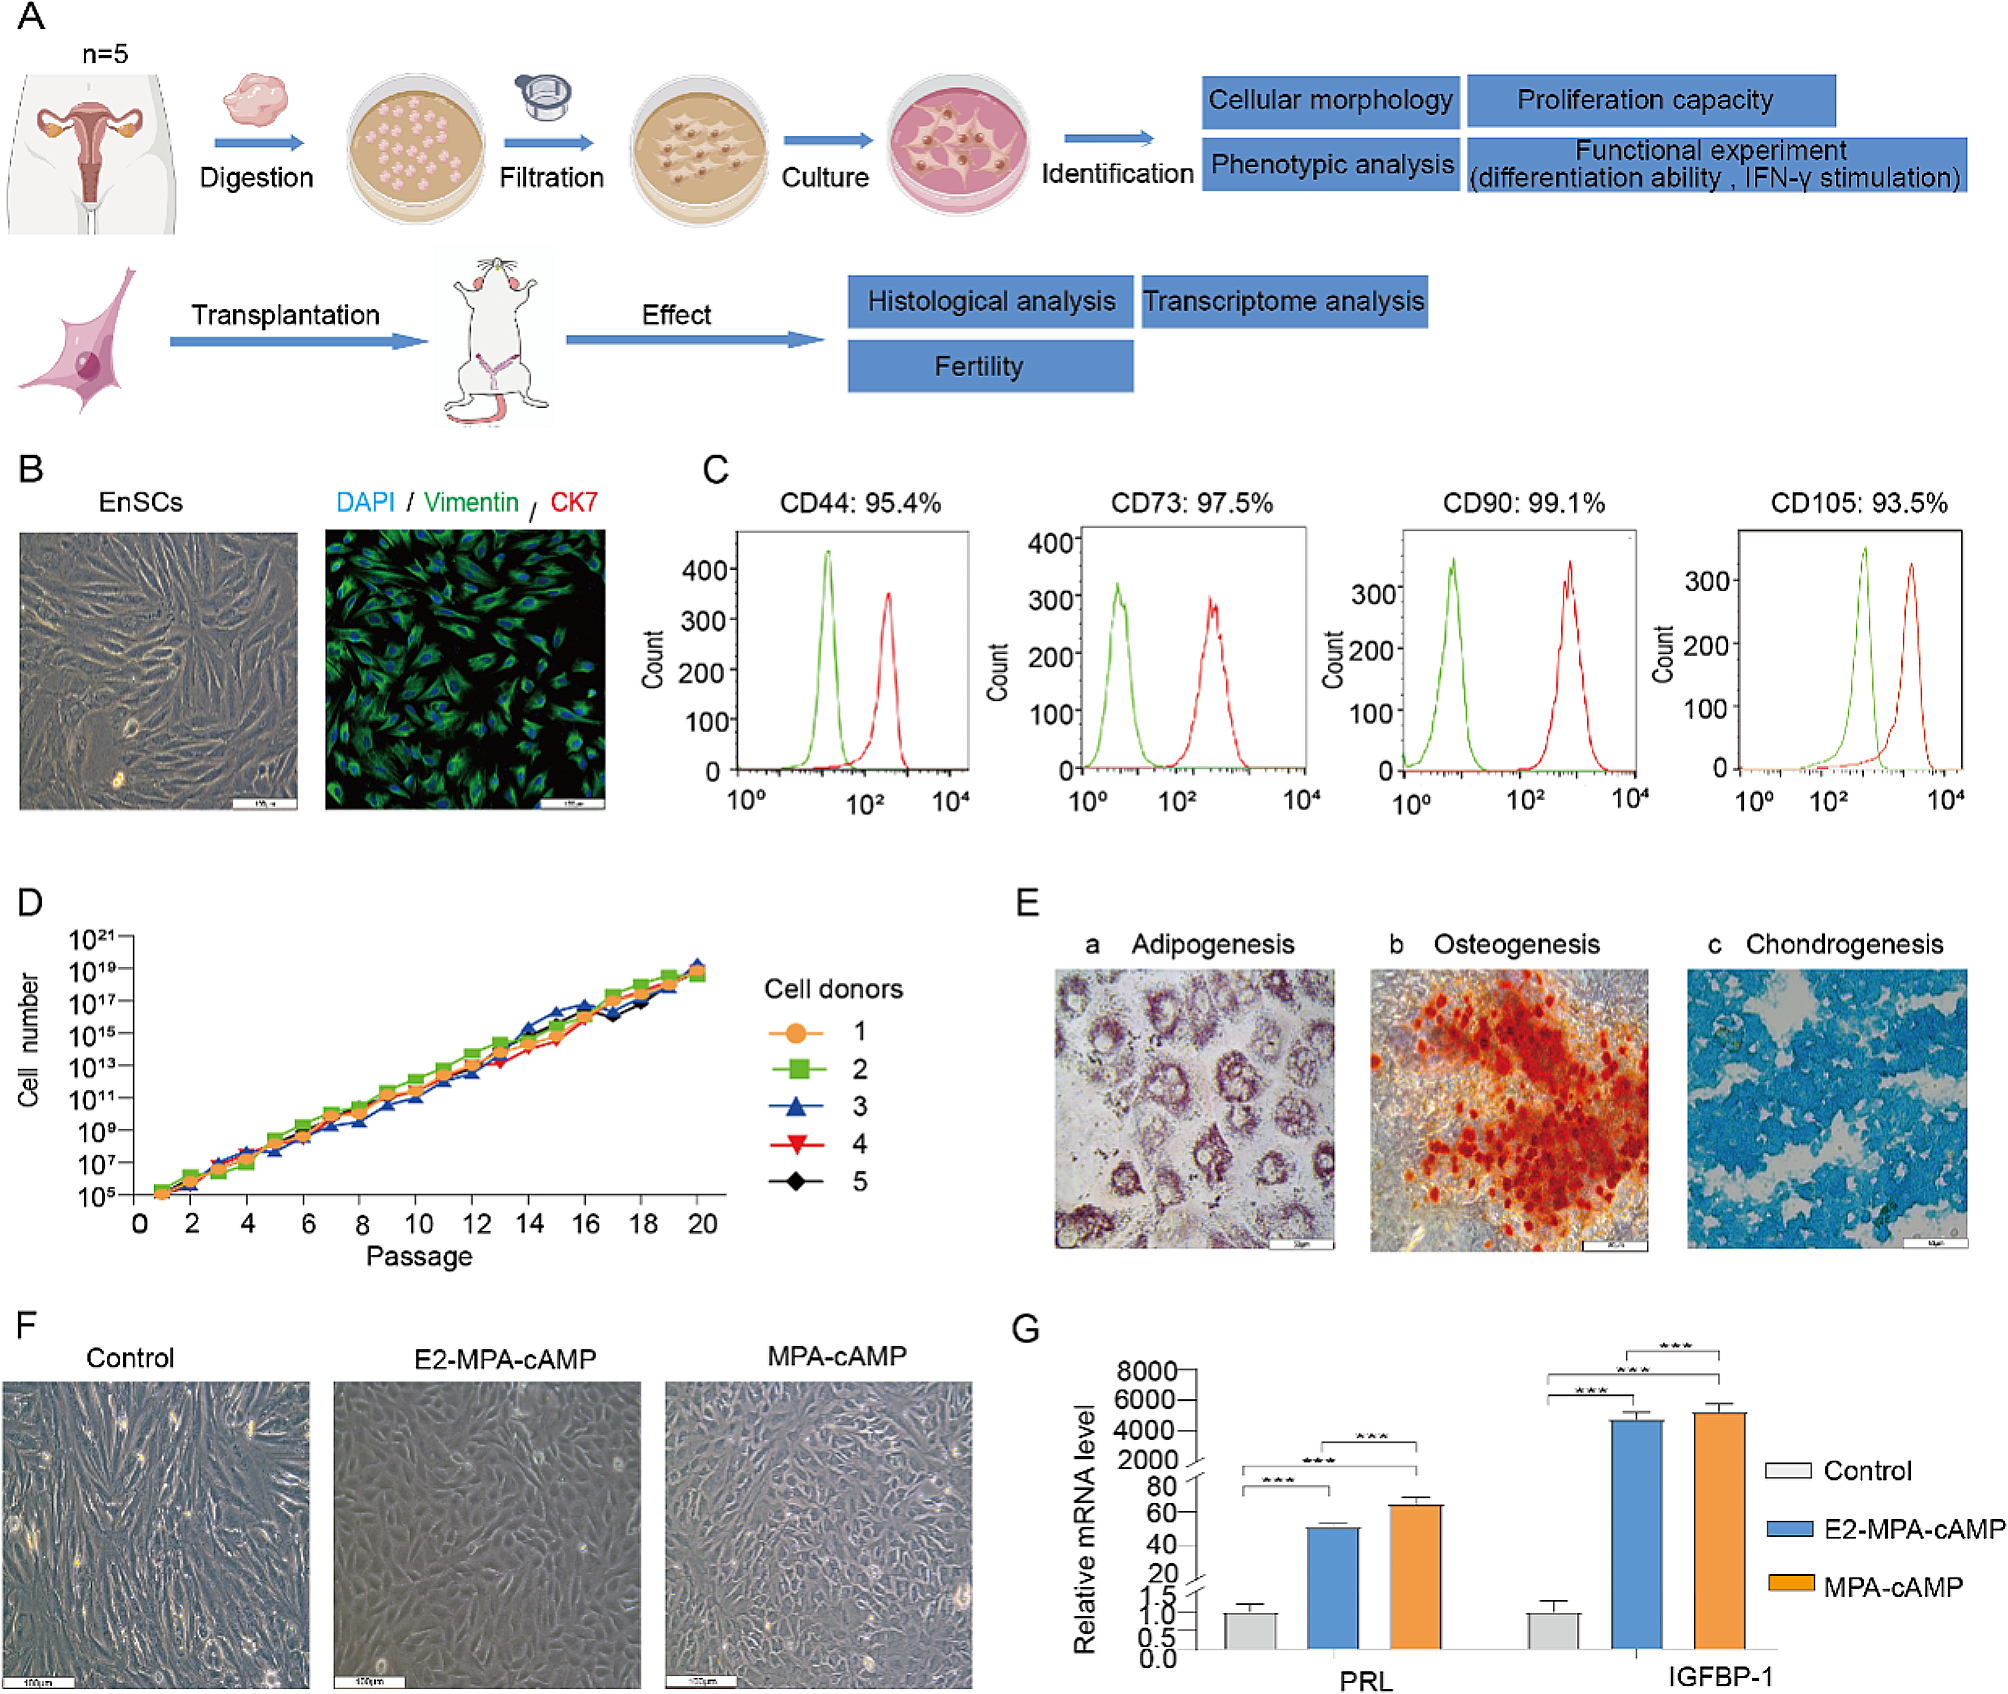
Human umbilical cord-derived MSCs were provided by Beijing Beilai Biological Co., Ltd. (China), and MSC isolation and culture were performed as previously described [34]. Various methods are available for the identification of MSCs, including flow cytometry and differentiation assays. According to International Society for Cell & Gene Therapy (ISCT), MSCs were identified by their capacity to express specific cell surface markers (CD73, CD90), and lack expression of hematopoietic lineage markers (CD34, CD45) [35]. Additionally, their ability to differentiate into adipocytes, chondrocytes, and osteocytes under defined conditions was demonstrated by staining in vitro.
Production and transduction of Lentiviruses
Lentiviral vectors overexpressing CD73 and empty plasmids (pCDH-CMV-MCS-EF1-copGFP) (Hanbio Biotechnology, China) were packaged into human embryonic kidney 293 T cells (HEK-293 T) following the manufacturer’s instructions. The packaging plasmids and envelope plasmids were also involved in the transfection process. Lentiviral particles were harvested from the culture at 48 and 72 h post-transfection and subsequently concentrated by ultracentrifugation at 72,000×g for 2 h. The viral titer was assessed using the serial dilution method, as outlined in previous studies [36].
Transfection and supernatant collection
When reaching approximately 60% confluency at passage 2, MSCs were exposed to a viral particle mixture with a multiplicity of infection (MOI) of 50 and 8 µg/ml polybrene (Sigma-Aldrich, USA) in the culture medium. Subsequently, we obtained normal MSCs (MSC-N), vector-infected MSCs (MSC-V), and CD73-overexpressed MSCs (MSC-CD73). The conditioned medium from the third to fifth passage was collected for the production of MSC-sEVs. MSCs were cultured with complete DMEM/F-12 (Gibco, USA) media containing 10% fetal bovine serum (FBS) (Gibco) and 100 U/mL penicillin and streptomycin (Gibco). Before use, FBS and DMEM/F-12 were diluted at a ratio of 1:4 and centrifuged at 11,000×g overnight at 4 °C. This procedure aimed to reduce potential experimental confounds associated with sEVs present in FBS.
Quantitative real-time PCR (qRT-PCR)
The quantitative real-time PCR (qRT-PCR) was conducted to assess mRNA expression levels of different MSCs (MSC-N, MSC-V, MSC-CD73). Total RNA extraction was performed using the TRIzol reagent (Invitrogen, USA) following the manufacturer’s instructions. Subsequently, cDNA was synthesized utilizing the RevertAid First Strand cDNA Synthesis Kit (Thermo Fisher, USA). Each PCR reaction was set up in 384-well plates, comprising FastStart SYBR Green Master (Roche, Switzerland), cDNA, and 0.25 μm forward and reverse primers. The relative mRNA expression levels of the target genes were determined using the 2−ΔΔCT method, with GAPDH serving as an internal standard [37]. The primer sequences used were as follows: CD73 forward: CCAGTACCAGGGCACTATCTG, reverse: TGGCTCGATCAGTCCTTCCA; GAPDH forward: AGGTCGGTGTGAACGGATTTG, reverse: GGGGTCGTTGATGGCAACA.
Collection of mesenchymal stem cell-derived small extracellular vesicles
The supernatant from both uninfected and infected MSCs was collected after 48 h of incubation and separated by ultracentrifugation to obtain each group of MSC-sEVs. The separation process involved centrifugation at 200×g for 10 min at 4 °C, followed by centrifugation at 2000×g for 20 min at 4 °C, and then at 10,000×g for 30 min at 4 °C. Subsequently, the resulting supernatant underwent two additional rounds of centrifugation at 110,000×g for 70 min at 4 °C to achieve a high concentration of MSC-sEVs [38]. All ultracentrifugation steps were performed using an Optima XLA/I centrifuge equipped with an An-45Ti rotor (Beckman-Coulter, USA). The final pellets were resuspended in sterile PBS (Gibco), and the concentration was measured using a BCA protein assay kit (Solarbio, China).
Identification of mesenchymal stem cell-derived small Extracellular vesicles
To accurately characterize and distinguish different types of MSC-sEVs, various techniques were employed in this study. Samples were quickly fixed with 50 µl 4% paraformaldehyde (Sigma-Aldrich) for 5 min and applied to carbon copper grids. Negative staining was then performed using 2% uranyl acetate solution (Sigma-Aldrich). After drying, MSC-sEVs were directly visualized using transmission electron microscopy (TEM). Additionally, nanoparticle tracking analysis (NTA) was used to measure the size and concentration of MSC-sEVs in a liquid medium. The particle size was analyzed using Nanosight (version 3.3). For identification of various protein markers associated with different MSC-sEVs, Western blot was used. The isolated MSC-sEVs were lysed to release their protein content, which was then separated by polyacrylamide gel electrophoresis (SDS-PAGE) based on size and charge. The separated proteins were transferred onto a polyvinylidene difluoride (PVDF) membrane (Sigma-Aldrich) and incubated with a 5% non-fat dried milk to prevent non-specific binding of the antibody. The membrane was then probed with antibodies specific to MSC-sEVs-associated proteins, including CD63 (Abcam), TSG-101 (Abcam), CD73 (Abcam) and β-actin (Abcam). Additionally, the expression of CD73 on the surface of MSC-sEVs was also identified using ELISA kits, following the manufacturer’s instructions (R&D Systems).
Induction and treatment of experimental autoimmune uveitis
EAU in C57BL/6 mice was induced by immunization with an emulsion comprising equal volumes of complete Freund’s adjuvant (CFA, Sigma Aldrich) and 5 mg/mL desiccated Mycobacterium tuberculosis (TB, Sigma-Aldrich), as well as 300 µg interphotoreceptor retinoid-binding protein651 − 670 (IRBP651 − 670, LAQGAYRTAVDLESLASQLT) (Shanghai Hanhong, China) in PBS. This emulsion was then applied to four spots on the tail base and flank. In addition, mice were intraperitoneally administered 500 ng pertussis toxin (PTX) (List Biological Laboratories, USA) on the day of immunization and 24 h post-immunization. Immunized mice were randomly assigned to different groups using a computer-generated random number sequence. The groups included PBS, MSC-sEVs (sEVs-N), vector-infected MSC-sEVs (sEVs-V), and sEVs-CD73. On day 11 post immunization, different groups of mice were injected via tail vein with 50 µg diverse MSC-sEVs respectively or equal volume of PBS.
Clinical and histological assessment of experimental autoimmune uveitis
EAU mice were examined every other day by head-mounted indirect fundoscopy from day 9 to day 21 post-immunization. On the 17th day post-immunization, mice were euthanized, and their eye tissues were fixed in 4% paraformaldehyde, paraffin-embedded, sectioned (4 μm), and stained with hematoxylin and eosin (H&E). The histopathological changes of retina were examined and scored. The incidence and severity of inflammation were assessed according to the criteria of Caspi [39].
Optical coherence tomography
On the 17th day post-immunization, a total of six mice per group were anesthetized, and the pupils were dilated with 0.1% tropicamide. The mice were then placed in a prone position, and a corneal contact lens was used to stabilize the eye. Spectralis optical coherence tomography (OCT) (Heidelberg, Germany) was used to scan the retina, and the images were scored based on the criteria previously established by Gadjanski and colleagues [40].
Flow Cytometry detection of inflammatory cells
Mice were sacrificed on day 17 after immunization and their eyeballs, spleens (SP) and lymph nodes (LNs) were separated and ground. To prepare single lymphocyte suspension, the spleen was lysed with red blood cell lysis buffer (Sigma), while the eyeball tissue was digested with 1 mg/ml of collagenase D (Sigma-Aldrich) for 1 h. The resulting cell suspension was filtered through a 70-µm filter and then centrifuged. Part of these cells were incubated in a 96-well plate with 50 ng/mL phorbol 12-myristate 13-acetate (Sigma), 1 µg/mL ionomycin (Sigma), and 1 µg/mL brefeldin A (Abcam, USA). After incubation of 4.5 h, these cells were utilized to assess the ratio of Th1 and Th17 cells, while the remaining cells were prepared into single cell suspensions to determine the proportion of Treg cells.
The cells were incubated with Brilliant Violet™ 711 anti-mouse CD4 antibody for 30 min at 4 °C, followed by fixation and permeabilization according to the manufacturer’s instructions. Subsequently, FITC anti-mouse IFN-γ and PE anti-mouse IL-17 A antibodies were used to stain Th1 and Th17 cells, respectively. For Treg cells, the cells were stained with FITC anti-CD25 and PE anti-FOXP3 antibodies. The proportion of IFN-γ, IL-17 A, CD25, and FOXP-3 was then assessed using a FACSCalibur flow cytometer (BD Biosciences, USA) and analyzed with FlowJo software (USA). The laser for Brilliant Violet™ 711 was set at 405 nm, while for PE and FITC, it was set at 488 nm. The fluorescence channels corresponded to 710/50 (BV711), 575/25 (PE), and 530/30 (FITC), respectively. All antibodies were purchased from BioLegend.
Assay of T-cell proliferation in vitro by Carboxyfluorescein Diacetate Succinimidyl Ester (CFSE)
The 96-well plates were precoated with 10 µg/mL anti-mouse CD3 mAb (BioLegend) and 5 µg/mL anti-mouse CD28 mAb (BioLegend) to stimulate CD4+T-cells. The total CD4+T-cells were isolated from spleens of naive mice by positive CD4+T-cell isolation kit (Miltenyi Biotec, USA). The cells were then labeled with 1 µM carboxyfluorescein diacetate succinimidyl ester (CFSE) (Invitrogen) for 10 min and co-cultured with MSC-sEVs at a concentration of 10 µg/ml. After 72 h of incubation, the CFSE fluorescence intensity was measured by FACS and analyzed by FlowJo.
T-cell differentiation assays in vitro
Naive CD4+T-cells from spleens of naive mice were isolated using a positive isolation kit (Miltenyi Biotec). These purified cells were seeded at a density of 2 × 10⁵ cells/well in 96-well plates pre-coated with anti-CD3/CD28 and then cultured under Th1, Th17, and Treg differentiation conditions, respectively. After cultivation, the corresponding antibody was stained. Th1, Th17 and Treg cell populations were analyzed by flow cytometry.
For Th1 polarization, cells were cultured in RPMI-1640 cell culture medium (Gibco) (supplemented with IL-12 at 20 ng/mL and anti-IL-4 at 10 µg/mL). For Th17 polarization, cells were cultured in RPMI-1640 cell culture medium (supplemented with IL-6 at 20 ng/mL, anti-IL-4 at 10 µg/mL, anti-IFN-γ at 10 µg/mL, and TGF-β1 at 2ng/mL). For Treg polarization, cells were cultured in RPMI-1640 cell culture medium (supplemented with TGF-β1 at 5 ng/mL and IL-2 at 20 ng/mL). After 5 days of culture, the cells were collected and analyzed using FACS. Recombinant cytokines were purchased from R&D Systems (Minneapolis, USA), while antibodies against these cytokines were purchased from BD Biosciences.
Quantification of adenosine levels using high performance liquid chromatography (HPLC)
Naive T-cells were cultured in RPMI-1640 cell culture medium supplemented with anti-CD3 and anti-CD28. After three days of culture, 50 µL cell supernatant was collected and transferred to a 1.5 ml EP tube. Subsequently, 50 µL of methanol was added, followed by thorough vortex mixing. Then, 100 µL of acetonitrile was added, vortexed for 30 s, and centrifuged at 12,000 rpm for 10 min at 4℃. The supernatant was collected for mass spectrometry detection. The subsequent performance liquid chromatography (HPLC) procedures were conducted using the ACQUITY UPLC I-Class/Xevo TQ-XS (Waters, USA). A series of adenosine standards ranging from 200 pg/ml to 20,000 pg/ml were prepared and stored at 4℃. A standard curve was constructed using the average peak area as the x-axis and adenosine concentration as the y-axis, with the regression equation calculated. The chromatographic column used was Waters BEH C18 (2.1*100 mm, 1.7 μm), maintained at 30℃.
Statistical analysis
The data obtained from all experiments were expressed as mean ± standard deviation (mean ± SD). In contrast, the one-way analysis of variance (one-way ANOVA) was utilized determine the statistical significance. These data were analyzed using the software GraphPad Prism 9.4 (GraphPad Software, USA). The criterion for statistical significance was set at P < 0.05.


留言 (0)