The work has been reported in line with the ARRIVE guidelines 2.0.
Animals
All rats experiment protocols were conformed with the Guide for the Care and Use of Laboratory Animals and were approved by the ethical committee of the Kunming University of Science and Technology (PZWH (dian) K2022-0009). All animals were purchased from experimental animal center of Kunming Medical University and housed at laboratory animal center of the Kunming University of Science and Technology. All rats were fed under standard living conditions (22 ± 1 °C, 12-hour light/12-hour dark, and free access to water and food pellets). Rats were monitored daily after surgery and then rats with excessive distress, including excessive weight loss, lethargy, and loss of thermoregulation, were euthanized.
Human tissue collection
This study was approved by the Ethics Committee of First People’s Hospital of Yunnan Province Affiliated to Kunming University of Science and Technology (ethics number: KHLL2021-KY049) and has been performed in accordance with the principles of the Declaration of Helsinki. All donors signed informed consents for voluntary donation of endometrium at the First People’s Hospital of Yunnan Province. A total of 5 Endometrial specimens in the proliferation stage of the menstrual cycle without any abnormalities or malignancies were obtained from women of reproductive age (mean age: 30), who underwent hysteroscopic surgery for benign gynecological diseases, such as hysteromyoma and infertility. Characteristics of each donor are provided in supplementary Table 1. Patients undergoing endometrial malignant or precancerous lesions, endometrial polyps, endometrial hyperplasia, uterine cavity adhesion and hormone therapy were excluded from the sample collection. Endometrial tissue was collected by curettage.
Endometrium tissue dissociation and EnSCs isolation
The endometrial tissue was dissociated through a two-stage dissociation protocol as previously described [22]. Upon receiving the endometrial samples, which were placed in a 15 ml Falcon tube with DMEM medium and transported in a chilled carrier, the tissues were initially rinsed with saline solution to remove excess mucus, ensuring the overall cleanliness of the tissue. The endometrial tissue was minced into 1 mm [3] pieces on a petri dish using surgical scissors and incubated dish in a tissue digestion solution containing Type IV collagenase, dispase, and DNAse I on a rocking platform (50–70 rpm depending on the model) for 15–20 min at 37 °C to assist with digestion. After brightfield microscopic examination, single cells were observed, while the glandular epithelial fragments still remained, the digestion was terminated. When presenting red blood cell contamination, using ACK Lysis Buffer to remove blood cell. Epithelial cells were separated using a 40 μm cell strainer. Stromal cells located beneath the strainer were then collected. EnSCs isolated from those collected endometrium was subsequently used to cell culture, transcriptome sequencing, and cellular therapy in animal experiments.
Culture and expansion of EnSCs
For the harvested stromal cells, they were seeded onto regular plastic culture dishes at a density of 1 × 10⁴ cells per square centimeter (cm²) and cultured in primary complete stromal medium (PCSM). PCSM contains DMEM/F-12 + GlutaMAX™ basic medium (GIBCO), supplemented with 10% FBS (GIBCO), 2mM l-glutamine (GIBCO), 100 IU/ml penicillin + 100 mg/ml streptomycin (GIBCO), 5 µg/ml insulin (Sigma-Aldrich), 25 ng/ml hydrocortisone (Sigma-Aldrich), 0.125 ng/ml EGF (GIBCO). The above dishes were placed in an incubator at 37 °C, 95% air, 5%CO2. When the cell confluence rate reaches 80-90%, cells were digested with Trypsin-EDTA (Gibco) to serially passaged. After passage to 3–5 passages, the cells were purified and frozen with cell freezing medium in -80℃.
Immunofluorescence staining of EnSCs and endometrium tissue
EnSCs were grown to a certain density in 96 well plates and fixed in 4% (w/v) paraformaldehyde for 15 min. After washing with PBS and permeabilization with 0.1% Triton X-100 (Sigma-Aldrich) for 10 min at 4 °C and blocking with 5% bovine serum albumin for 30 min at room temperature. Cells were stained with the primary antibody vimentin (1:300, Abcam, ab137321) and cytokeratin 7 (CK7) (1:200, Abcam, ab181598) at 4℃ overnight. After washed for three times, the secondary antibody and DAPI were incubated with cells for 1 h at 37℃ in the dark. For immunofluorescent(IF) staining of rats’ endometrial tissue, samples were firstly fixed in 4% paraformaldehyde for 24 h and then embedded in OCT and cut into 5 μm slices for IF staining. For intracellular target proteins staining, sections were fixed, permeabilized, blocked and then incubated with the primary antibodies E-cadherin (abcam,1:400), vimentin (abcam,1:300) or CD31(ab24590,1:100) overnight at 4 °C. Fluorescein-conjugated secondary antibody were incubated, followed by addition of DAPI to stain the nucleus. The IF results were observed and photographed under a confocal fluorescence microscope (Leica, Sp8) and analyzed with LAS X software.
Flow cytometric analysis
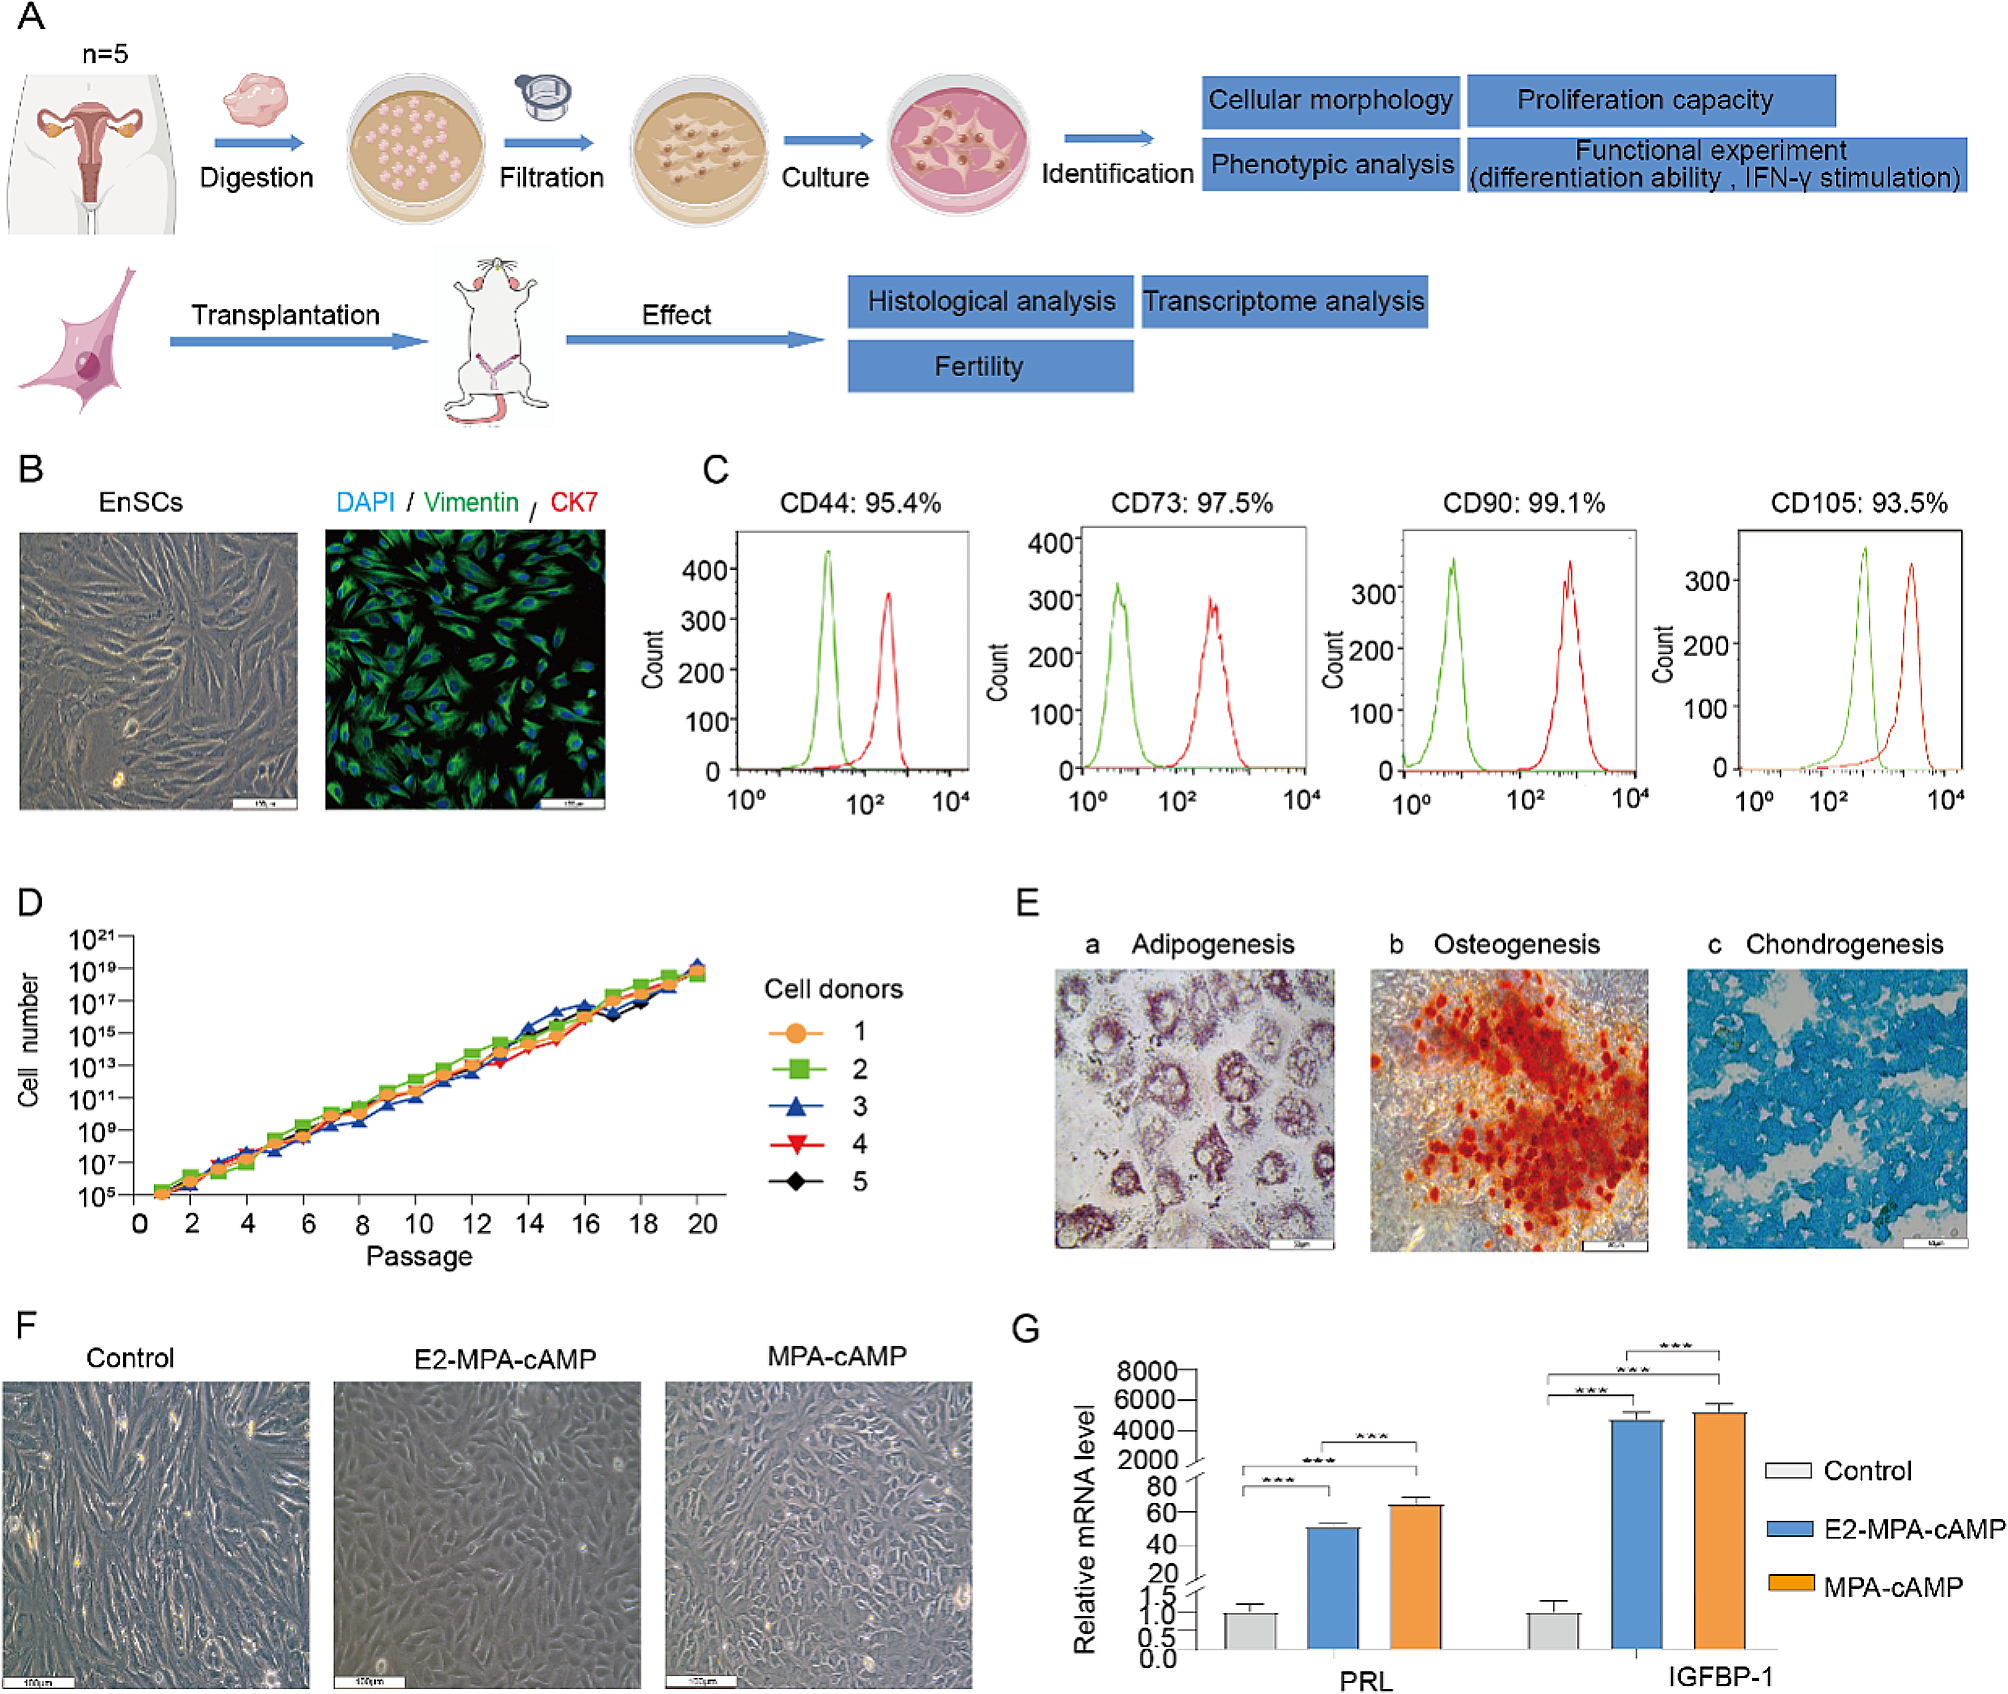
The adherent P3 generation of EnSCs cells, digested into single cells, were washed twice with pre-chilled PBS. Then, cells were incubated with related cell surface flow cytometry antibodies at 4 °C in dark for 30 min, subsequently washed twice with cold PBS, resuspended in 500µL PBS and analyzed by a flow cytometer (FACSAria II, BD, USA). These markers included human positive MSC maker CD90-FITC, CD105- PerCP-Cy™5.5, CD73-APC, CD44-PE, negative MSC cocktail marker (CD45-PE, CD34-PE, CD11b-PE, CD19-PE and HLA-DR-PE (BD, MSC analysis kit, 562245) and two pairs of classic markers for endometrial stromal stem cells. That is CD146-FITC (BioLegend, 361012), PDGFR-β-APC (BioLegend, 323608) and SUSD2-PE (BioLegend, 327406). Then EnSCs phenotype were characterized by flow cytometry for cell surface markers including CD90, CD105, CD44, CD73 and CD146, PDGFR-β, SUSD2. In all experiments, isotype antibodies were also used as negative controls.
Cell proliferation assay of EnSCs
Once the EnSCs isolated, the passage 0 cells (P0) were serially passaged to P20 (passage every 3 days). Cell numbers were quantified at each passage. The cell growth curve was drawn according to the absolute cell number of each passage by software Graph Prism 7.
Adipogenic, osteogenic and chondrogenic differentiation of EnSCs
For adipogenic differentiation, EnSCs were seeded into into a 6-well plate at a density of 200,000 cells/well. Adipogenic Differentiation was induced in an adipogenic culture medium prepared according to the product instructions. After that, lipid droplets in cells were stained with Oil Red-O and visualized in an inverted light microscope. For osteogenic differentiation, seeded cells in a 6-well plate was incubated with Osteogenic differentiation medium. Differentiation was assessed using Alizarin Red staining (osteogenic). For chondrogenic differentiation, cells were cultured in the chondrogenic induction medium and then stained by Alcian blue solution and observe chondrogenic differentiation under a light microscope.
Decidualization of EnSCs
EnSCs were seeded into 12-well plates at the appropriate density, and hormone induction was initiated when the cells reached 50% confluence. EnSCs were induced for decidualization for 5 days via two distinct pathways: E2 + P4 + cAMP and P4 + cAMP, using 10 nM estradiol (E2, Sigma, E1024), 1 µM MPA (P4,Sigma, PHR1589), and 1 µM cAMP (2’-O-dibutyryladenosine 3’,5’-cyclic monophosphate sodium salt; Sigma, D0627). Each treatment was repeated in three wells. Samples from the decidualization experiments were harvested using Trizol (Gibco,15596026) to extract RNA for downstream Q-PCR analysis.
EnSCs responsiveness to inflammatory cytokine IFN-γ
P3 EnSCs from three patients, cultured in 6-well plate, with confluence reached to 70%, were exposed to 50 ng/ml human interferon gamma (IFN-γ) (peprotech) for 2 days in complete primary stromal cell media (PSCM). Complete media without IFN-γ served as a control. Cells from the two groups were harvested by 0.05% Trypsin-EDTA digestion (ThermoFisher Scientific) and subsequently used for bulk RNA-seq.
Establishment of the EnSCs-GFP cell line
The GFP lentivirus was packaged using the conventional three plasmid system method as previous described [23]. 293T cells with 80% confluence were transfected using packaging plasmids (psPAX-2), envelope plasmids (pMD2.G), and GFP lentivirus plasmids (pWPXLd) with the cationic polymer HighGene transfection reagent (ABclonal, RM09014) for lentivirus packaging. Virus supernatants were collected at 48 h and 72 h post-transfection. The GFP lentivirus, filtered through a 0.22 μm membrane, was used to infect EnSCs, establishing the EnSCs-GFP cell line.
IUA rat model establishment
The IUA rat models were established by comparing three different mechanical curettage methods and one chemical injury method to assess the optimal modeling approach for uterine endometrial injury. 10-week-old rats weighing 250–300 g in the estrus phase were randomly divided into four groups, each corresponding to one of four different modeling methods: knife scraping, needle scraping, knife excision, and ethanol treatment. Briefly, after anesthesia with Isoflflurane(0–5%) using Small Animal Anesthesia Machine(RWD Life Science Co.,Ltd), the abdominal wall and cavity were surgically opened and the bilateral uteri were exposed under sterile conditions. For knife scraping methods, the uteri were cut longitudinally in the middle of the uterus to expose the endometrium, creating a 3.5 cm incision. The endometrium was then scraped with a blade until the surface of the uterine cavity became rough. For needle scraping, a 0.3 cm longitudinal incision was created 1.0 cm above the cervix of the uterus. A No. 18 needle (inner diameter: 1.50 mm; outer diameter: 1.80 mm; needle tube length: 35.5 mm) was inserted into the uterine cavity through the incision and scraped back and forth along the entire layer of the uterine cavity for no fewer than 50 times until the uterine exhibited obvious congestion reaction and roughness. For the alcohol group, the upper and lower ends of the uterus were clamped with vascular clamps. One milliliter of 95% ethanol was slowly injected into the upper end of the uterine cavity, leaving the uterine cavity filled for 15 min.
Transplantation of EnSCs to treat IUAs in rats
Rats were randomly assigned to 3 groups: the sham-operated group, the IUA group, the EnSCs group (n = 4–5 in each group for each experiment). Different treatment measures were performed in each group after the establishment of the IUA model. In the sham-operated group, the abdominal cavity was surgically exposed without any manipulation of the uterus. In the IUA group, no treatment was administered. In the EnSCs group, 300 µL of DMEM basic medium containing 2 × 10⁶ cells were transplanted directly via intrauterine injection into two sites: the uterine muscle layer or uterine cavity.
H&E and Masson staining
At the appointed time, rats were sacrificed and bilateral uterine were resected. Uterine tissue was fixed in 4% paraformaldehyde with standard paraffin embedding. Paraffin-embedded tissue samples were sectioned into 5-µm slices. The tissue sections were deparaffinized in xylene at room temperature and subsequently rehydrated through a descending ethanol series (100% for 5 min, 95% for 1 min, 80% for 5 min and 75% for 5 min). The HE and Masson staining were performed according to routine procedures. Tissue sections were mounted with neutral resin and observed under optical microscopy (Nikon, NIKON ECLIPSE E100). The number of endometrial glands and the degree of fibrosis were determined based on the results of HE and Masson staining, respectively. Image J (Image in Java, USA) software was used for statistical analysis of the average proportion of each group.
Immunohistochemical analysis
All slides underwent the same standard procedures as in HE staining before performing antigen retrieval. Then sections were fixed in 3% hydrogen peroxide solution for 15 min to block endogenous peroxidase reactivity and blocked in goat serum for 30 min at 37 °C. Then slides were incubated with the primary antibodies to estrogen receptor (ESR, 1:300, Servicebio, GB13025), anti-progesterone receptor (PGR, 1:300, Servicebio, GB11262), anti-platelet-derived growth factor B (PDGFB, 1:200, Servicebio, GB11261) and anti-insulin-like growth factor-1 (IGF1, 1: 1000, Servicebio, GB11248) overnight at 4℃. Then washed using PBS and incubated with secondary antibody labeled by HRP for 2 h at room temperature followed by PBS wash. Finally, the 3,3-diaminobenzidine tetrahydrochloride (Servicebio, G1211) staining was used to visualize target antigen location. Slides were counterstained with hematoxylin for 2 min. The results were imaged using a microscope (CIC. XSP-C204). Staining intensities were quantified using Image-Pro Plus software (Media Cybernetics).
Quantitative RT-PCR
Total RNA was extracted from 50 ∼ 100 mg of excised tissue using TRIzol™ reagent (Gibco, 15596026). One microgram of harvested total RNA was then reverse transcribed to generate cDNA following the manufacturer’s protocol (Takara, RR047A). The gene expression levels of TGF-β1, α-SMA, and IGF1 were determined by qPCR using the 2−ΔΔCq method with Power SYBR-Green Mastermix in a 20 µL volume (Applied Biosystems, USA), with the GAPDH gene used as a reference. The primer sequences are listed in supplementary Table 2.
Fertility test
Since the 28th day of treatment, female rats in each group were housed with healthy, fertile male rats at a ratio of 2:1 to assess the function of the scarred uterine horns. The rats were euthanized 18 days after the presence of vaginal plugs, and each uterine horn was collected to examine the number of implanted embryos. The embryo development of each group was photographed.
RNA sequencing and bioinformatics analysis
Once the RNA quality extracted from both EnSCs and rat uteri samples meets the required standards, the standard RNA-seq procedure is followed. This includes reverse transcription into cDNA, adapter ligation, amplification, and sequencing to obtain the raw data.
Gene expression analysis
The processing and analysis of this collected data were conducted using R software. To map reads and quantify transcript expression levels, the HISAT2 and StringTie-Ballgown workflows were employed. The paired-end clean reads were aligned to the Rattus norvegicus (UCSC rn6) reference genome using StringTie software (v2.1.1). After the alignments, the FPKM values were calculated using Ballgown (v2.22.0).
Principal component analysis (PCA)
Genes with FPKM values less than 1 were filtered across all samples. The remaining genes were selected for dimensional reduction by principal component analysis (PCA) and displayed using the R package ggplot2 (v3.4.4).
Differential gene analysis
Firstly, before conducting differential analysis, genes with FPKM values less than 1 were filtered across all samples. The remaining genes were subjected to differential expression analysis using the R package Deseq2 (v1.30.1). The DEGs were defined as genes with a p-value < 0.05 and |log2FC| > 1.
Weighted correlation network analysis (WGCNA)
Gene co-expression network analysis was specifically performed on rat endometrium tissues using the R package WGCNA (1.72.5). The expression matrix was restricted to differentially expression genes including EnSCs group VS Injury group, as well as injury group vs sham group at different time points. Hierarchical Clustering was used to filter the outlier samples. Then, the optimal soft threshold for adjacency computation was graphically determined, and we plotted module detection via dynamic tree cutting. Genes with highly similar expression profiles were grouped into one module based on the “blockwise Modules” function. The minimum module size is set to 30, and the ‘mergeCutHeight’ is set to 0.30. The soft threshold set to 10. To identify key modules associated with EnSCs transplantation, module eigengene and group were calculated by Pearson correlation and visualized using heat maps of module and groups. Modules with a higher correlation were chosen for further analysis. The top 30 genes with the highest KME value in the module was displayed in fitting curves over the time points to show changes.
Enrichment analysis
Genes with kME > 0.65 within each module underwent enrichment analysis using online websites (KOBAS: http://kobas.cbi.pku.edu.cn/).
Gene Set Enrichment Analysis (GSEA)
The differential expression gene generated in Injury VS Control and Injury VS EnSCs was subjected to GSEA functional enrichment using R package “clusterProfiler”. The Normalized Enrichment Scores (NES) of the selected pathways was showed by heatmaps using R package " pheatmap (v1.0.12)” to compare difference between the two groups.
Statistical analysis
One-way analysis of variance (ANOVA) was used to analyze study variables among groups, and significance of difference between two groups was compared by Independent-Samples T Test. Data are shown mean ± SD, and *P < 0.05, **P < 0.01, and ***P < 0.001 were considered to indicate a statistically significant difference. All statistical analyses were performed using GraphPad Prism 9 software (San Diego, CA, USA).


留言 (0)