
記住我
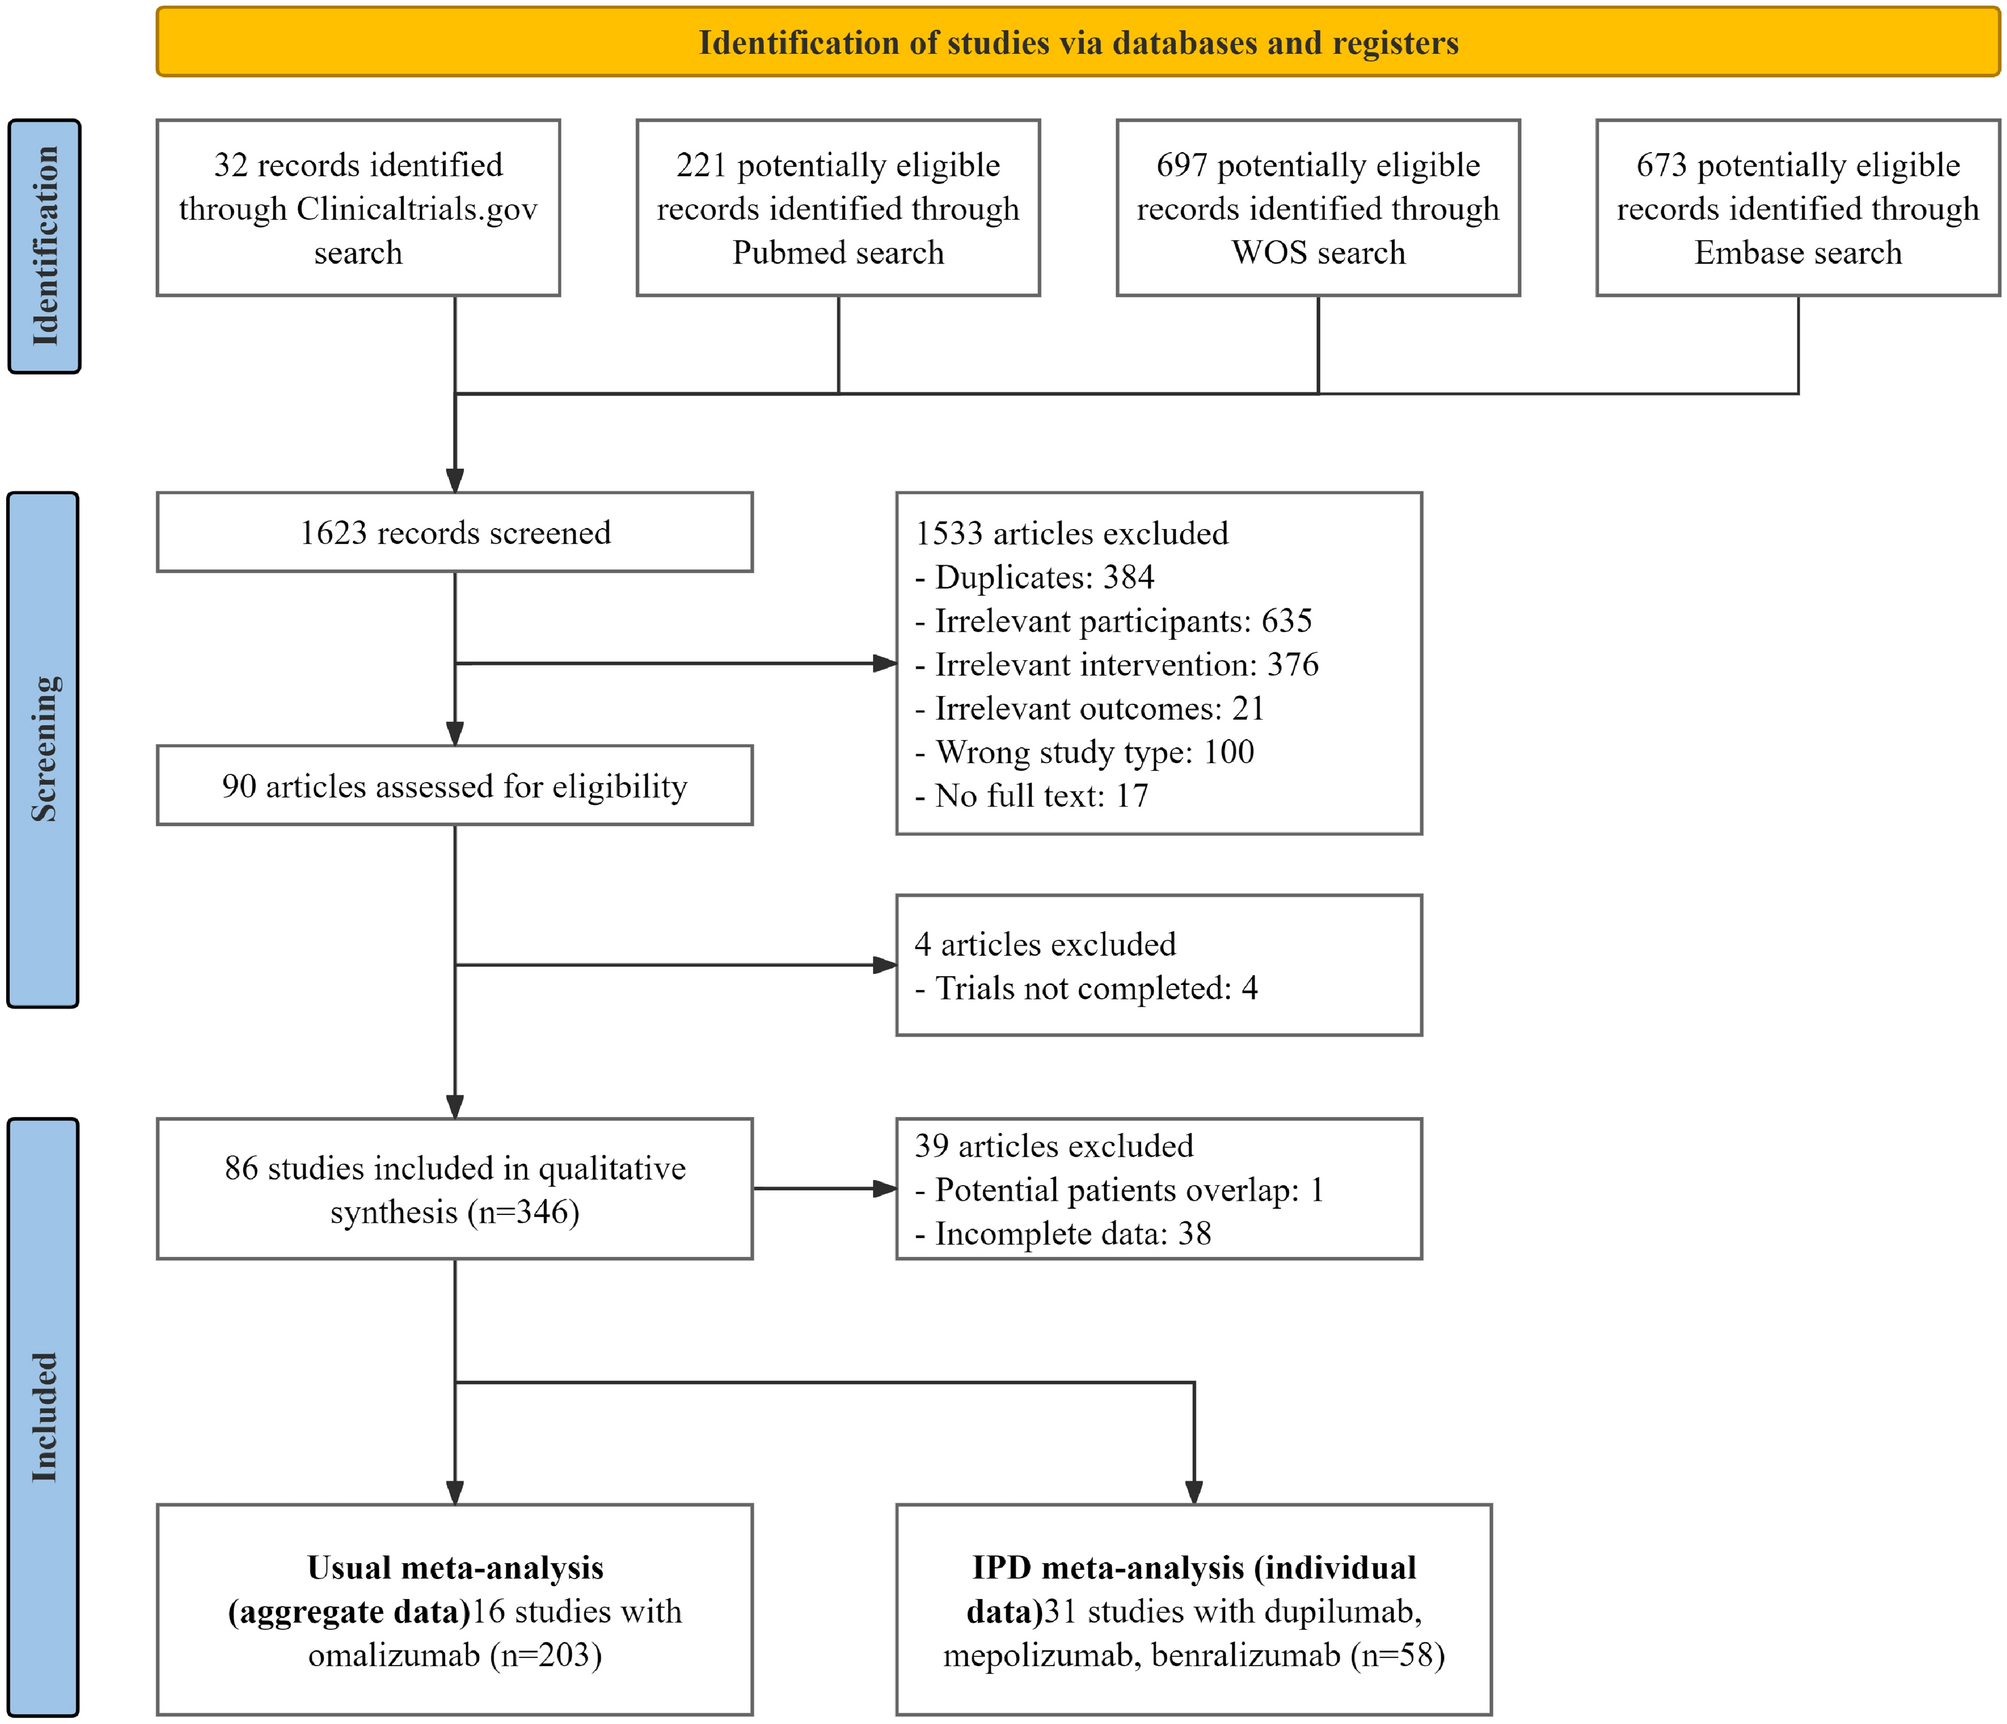


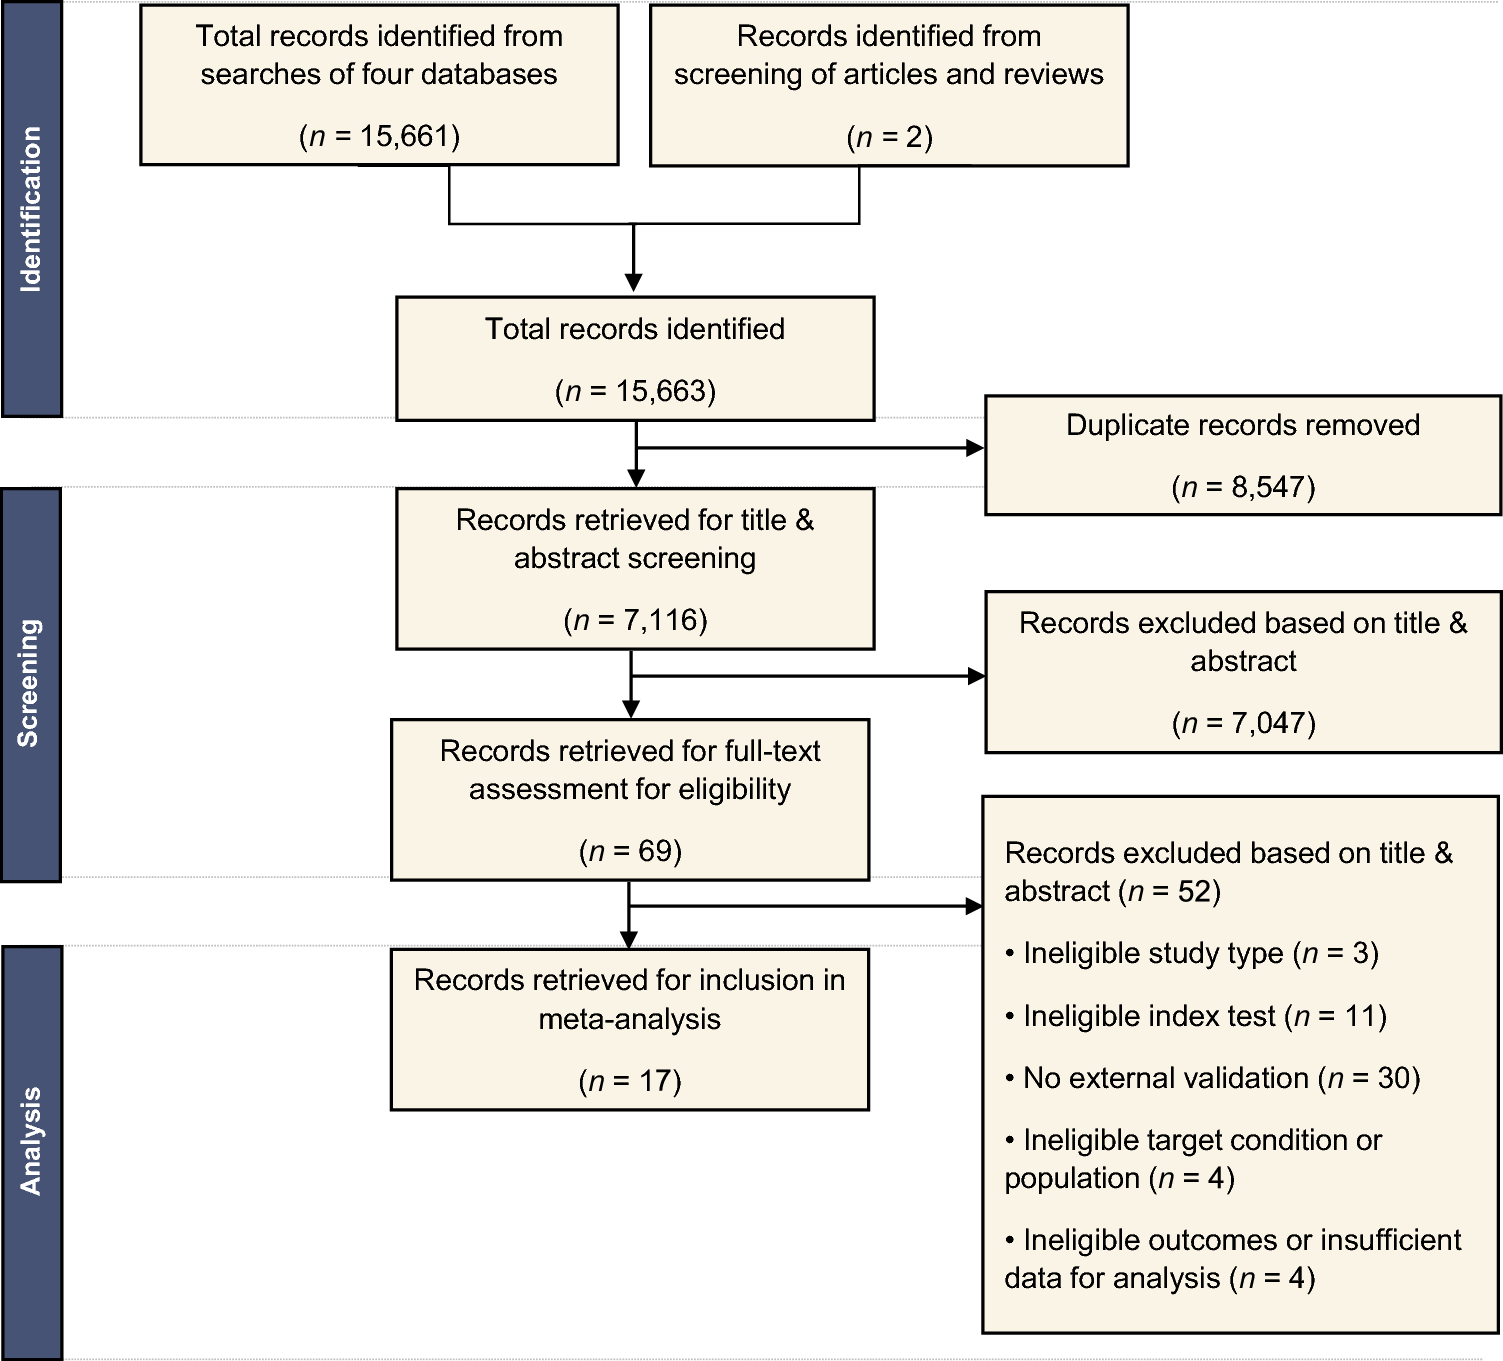
The literature search identified 17 studies for inclusion (Fig. 1), comprising 35 validation datasets, 8553 participants, and 9884 pulmonary nodules. Of these nodules, 1991 were confirmed to be malignant within the follow-up period (on average, 24 months) (Table 1).
Table 1 Characteristics of included studiesAll the studies’ datasets save one, were retrospective cohorts, with one study containing a prospective-cohort dataset [15]. Datasets included populations from North America (11 studies), Europe (six studies), and Asia (four studies) (Table 1).
Studies primarily assessed diagnostic performance. Some studies reported clinical utility outcomes, such as diagnostic re-classification [16, 17]. However, due to inconsistency, it was not possible to conduct a meta-analysis on clinical utility. The main outcomes sought were the confusion matrices, sensitivity and specificity, and AUCs (Table 1). Many studies did not report confusion matrix values directly. As such, these were calculated using reported sensitivity, specificity, and prevalence values.
Sixteen DL-based CADx models were identified from the included studies. The commonest learning algorithm used were convolutional neural networks (CNNs). Ten of the 16 models and 11 of the 17 included studies used a CNN algorithm as the basis for their malignancy prediction score.
For the external validation index tests, the commonest comparator was physician readers (13 of 35 datasets, from 11 studies). The majority were radiologists with ≥ 3 years’ experience.
The Brock model was the commonest clinical risk model (12 datasets from eight studies), followed by the Mayo model with eight datasets from three studies. The Mayo model is considered the most externally validated model [18], but the Brock model performs better in screening populations [19, 20].
Most studies considered participants in the 50–75 age bracket. All studies included both female and male participants. The studies spanned the range of nodule sizes [21].
The average prevalence of malignancy across studies was 23%. Most incidentally detected nodules had prevalence ≥ 20%, whereas most screening populations had prevalence < 20%.
Diagnostic PerformanceDL-Based ModelsFor the DL-based models, meta-analysis of 34 datasets that reported AUC values or for which AUC values were able to be derived gave a pooled AUC of 0.86 (95% CI 0.83–0.90). (Fig. 2A). Sensitivity ranged from 0.37 (95% CI 0.25–0.50) for a 0.98 (95% CI 0.95–0.99) specificity [16], to 1.00 (95% CI 0.98–1.00) for a 0.28 (95% CI 0.26–0.31) specificity (Figs. 3A and 4A, respectively) [22]. Meta-analysis of 24 datasets gave a pooled sensitivity of 0.88 (95% CI 0.81–0.93) and specificity of 0.77 (95% CI 0.68–0.84) (Figs. 3A and 4A, respectively).
Fig. 2
Pooled areas under the curve (AUC) analyses of the included studies and their datasets
Fig. 3
Pooled sensitivity analyses of the included studies and their datasets
Fig. 4
Pooled specificity analyses of the included studies and their datasets
They had an I2 index of 90% (p < 0.01) for sensitivity and 99% (p = 0) for specificity, corresponding to very high statistical heterogeneity (an I2 value ≥ 75% was indicative of heterogeneity). The Deeks’ funnel plot showed no significant asymmetry, with p = 0.08 (a p < 0.05 result was assumed to be statistically significant), indicating no evidence of publication bias (eFigure 1A).
Physician Readers AloneSeparate pooled analysis for physician readers gave a pooled AUC slightly lower than DL-based models at 0.83 (95% CI 0.79–0.88) (Fig. 2B). They had sensitivity of 0.79 (95% CI 0.69–0.86) and specificity of 0.81 (95% CI 0.71–0.88) (Figs. 3B and 4B, respectively). Their I2 index was 89% (p < 0.01) for sensitivity and 95% (p < 0.01) for specificity, demonstrating high statistical heterogeneity. The Deeks’ funnel plot showed no significant asymmetry, with p = 0.31, indicating no evidence of publication bias (eFigure 1B).
Clinical Risk Models AlonePooled analysis for clinical risk models gave pooled AUC of 0.79 (95% CI 0.75–0.83) (Fig. 2C). They had sensitivity of 0.77 (95% CI 0.45–0.93) and specificity of 0.72 (95% CI 0.38–0.91) (Figs. 3C and 4C, respectively). Their I2 index was 94% (p < 0.01) for sensitivity and 99% (p < 0.01) for specificity, demonstrating very high statistical heterogeneity. The Deeks’ funnel plot showed no significant asymmetry, with p = 0.28, indicating no evidence of publication bias (eFigure 1C).
Lung-RADS-Based ModelsLastly, pooled analysis for Lung-RADS-based models gave a pooled sensitivity of 0.52 (95% CI 0.31–0.72) (Fig. 3D), and specificity of 0.61 (95% CI 0.49–0.71) (Fig. 4D). They had an I2 index of 94% (p < 0.01) for sensitivity and 97% (p < 0.01), demonstrating very high statistical heterogeneity. There were insufficient studies for a Deeks’ test.
Sub-group AnalysesSub-group analyses revealed that DL-based CADx models displayed higher sensitivity on incidentally detected nodules than screening-detected nodules, 0.90 (95% CI 0.77–0.96) versus 0.84 (95% CI 0.76–0.90), respectively. This increased reliability in detecting lung cancer came at the cost of specificity with screening-detected nodules having 0.84 (95% CI 0.78–0.89) compared to incidentally detected nodules at 0.70 (95% CI 0.55–0.81). Accounting for threshold effects, screening populations performed better than incidental populations for all risk prediction methods (eFigure 2A–C), particularly clinical risk models: pooled AUC of 0.75 (95% CI 0.69–0.80) in screening-detected nodules versus 0.60 (95% CI 0.56–0.64) in incidentally detected nodules (eFigure 2C). The difference between ROC curves for DL-based and physician reader methods versus clinical risk models for incidentally detected nodules was particularly pronounced, translating into pooled AUCs of 0.74 (95% CI 0.71–0.77) and 0.77 (95% CI 0.71–0.82) for DL-based models and physician readers, respectively, versus 0.60 (95% CI 0.56–0.64) for clinical risk models (eFigure 2).
Further sub-group analyses were carried out on prevalence and geography. For prevalence, the baseline malignancy in CT-detected nodules (4–30 mm) in the US, ~ 5%, [23] was multiplied by a factor of 4, and used as the threshold for classifying a study’s prevalence as high or normal. Thus, datasets with > 20% prevalence were considered high, and < 20%, normal. Further thresholds at 10% and 30% were explored with similar results. For geography, datasets were classified according to continent: Europe, Asia, and North America. Neither prevalence nor geography were found to be a source of heterogeneity.
The analysis was also re-run excluding nodules assessed in follow-up CT scans [24]. The majority of studies assessed nodules from initial CT scans (Table 1). This reduced the pooled sensitivity and specificity of the Lung-RADS-based models, but did not significantly affect any other results.
Quality AssessmentOverall, a low risk of bias was found in most studies using QUADAS-2 (eTable 4). Selection of participants varied between studies. This may have contributed to biased estimates of sensitivity and specificity as well as inter-study heterogeneity. Therefore, most studies (nine of 17) scored an unclear risk of bias owing to patient selection, but low risk in other categories.
留言 (0)