
記住我
Despite tremendous improvements in morbidity/mortality for persons with HIV (PWHs), noncommunicable diseases and HIV-related chronic comorbidities remain a public health priority worldwide. In particular, obesity is on the rise in PWHs, especially among women of reproductive potential in high HIV burden settings.1 An important contributor to obesity and related metabolic diseases in women of child-bearing age is postpartum weight (PPW) gain and/or retention.2 A multisite prospective study of women followed from pregnancy to 1 year postpartum (PP) found that African American women were at high risk of PPW gain, gaining up to 10 kg within 1 year of delivery.2 In South Africa, PWHs were reported to gain rather than to lose weight at 12 months PP.3 PPW gain is known to be associated with long-term adverse cardiometabolic health including metabolic syndrome.4 Therefore, understanding of pathways involved in PPW gain would be important to inform public health interventions.
Outside of pregnancy, abundant data shows that excessive weight induces chronic low-grade inflammation in the adipose tissue.5,6 For example, leptin, tumor necrosis factor receptor 1 (TNFR-1), resistin, and interleukin-6 (IL-6) are proinflammatory cytokines that have been shown to be elevated in people with obesity and in pregnancy.7,8 By contrast, adiponectin has anti-inflammatory properties and an inverse relationship with obesity and pregnancy progression.8 On the other hand, PWH have persistent immune activation associated with chronic low-grade inflammation, regardless of viral suppression.9 In particular, soluble (s) CD14, sCD163 are immune activation markers that have been shown to be elevated in PWHs compared with sero-negative individuals.9 Interestingly, some data suggest that there is a reverse relationship linking inflammation and future weight gain in adults.10 Little data exist on inflammatory pathways of weight gain in the context of HIV and the pregnancy–postpartum continuum. Therefore, we tested the hypothesis that low-grade inflammation, a chronic slow production of inflammatory cytokines in response to HIV and pregnancy, is associated with weight gain/retention in the PP period.
METHODS Study ParticipantsThe Prematurity Immunology in Mothers and their Infants Study recruited consecutive pregnant PWH ≥18 years at an urban primary health care facility in Cape Town between April 2015 and October 2016. Full cohort details have been previously described.11 Participants were prospectively followed and underwent anthropometric measurements and blood collection throughout pregnancy to 48 weeks PP. For this analysis, we included pregnant PWHs who were enrolled at ≤14 weeks gestational age (GA) as assessed by ultrasonography, had HIV viral load (VL) <200 copies/mL (61% were assessed within 2 weeks and the rest within 3 months of enrollment), had stored plasma specimens collected at ≤14 weeks GA (T1) and 29–36 weeks GA (T3) in pregnancy, and had T1, T2 (15–28 weeks GA), T3, and at least 3 PPW measurements. We restricted the analysis to those with VL <200 copies/mL since viremia is known to be associated with inflammation.12 All women included in this analysis were either already on tenofovir + (emtricitabine or lamivudine) + efavirenz (TEE) preconception or initiated TEE at enrollment; no switches in regimen occurred throughout pregnancy and PP. This study was approved by the University of Cape Town Faculty of Health Sciences Human Research Ethics Committee (HREC323/2021). All women provided written informed consent for testing of their stored specimens.
Outcome AssessmentAn outcome was PPW analyzed as an average, trajectory and a change between T1 in pregnancy and 48 weeks PP. Measured T1 weight has been shown to be a valid proxy for pre-pregnancy weight.13 Weight measurements were taken by a trained study nurse from participants dressed in light clothing with no shoes using a calibrated scale (Charder, Taichung City, Taiwan). A total of 4 weight assessments (at <2, 10, 24, and 48 weeks PP) were used to examine PPW. PPW change was calculated as (48 weeks PPW)—(≤14 weeks GA, T1 weight) in kg.
Exposure AssessmentWe considered each inflammatory marker at T1 (≤14 weeks, n = 57) and T3 (29–36 weeks GA, n = 31) as a separate exposure of interest. Plasma concentrations of soluble (s) CD14, sCD163, leptin, TNFR-1, resistin, adiponectin, and interleukin-6 (IL-6) were assayed in duplicate using Luminex technology on the Bio-Plex platform (Bio-Rad Laboratories, Hercules, CA). Weekly gestational weight gain (GWG) was calculated as (T3 weight)—(T2 weight)/(weeks between T2 and T3) as this is the period where most of the weight gain occurs and was categorized as low, normal, and high weekly GWG per Institute of Medicine cutoff guidelines which are based on women's baseline BMI.14
CovariatesAge, high school completion, substance use, and socioeconomic status (SES)23 were obtained from trained interviewer-administered sociodemographic questionnaires. Breastfeeding status and duration were obtained through self-report. Gravidity, timing of antiretroviral therapy (ART) initiation, CD4 count, (88% assessed within 2 weeks and the rest within 3 months of enrollment), and VL were obtained from medical record review. BMI at T1 was calculated and categorized based on World Health Organisation criteria: underweight (<18.5), normal (18.5–24.9), overweight (25–29.9), and obese (≥30) kg/m2.
Statistical AnalysisLevels of inflammatory markers were compared between T1 and T3 in pregnancy using the paired sample Wilcoxon signed-rank test. Linear mixed-effects models were fit to examine whether each inflammatory marker at T1 and T3, as well as weekly GWG, were associated with average PPW and PPW trajectories, and linear regression was used for associations with PPW change between T1 and 48 weeks. An interaction term between time and each exposure was introduced to assess PPW trajectory. To determine whether the estimates for continuous PPW change between T1 and 48 weeks were different among women who lost versus (vs) those who gained weight PP, a separate interaction term was introduced between each inflammatory marker or weekly GWG and the indicator variable for PPW loss vs gain in the models. Only these 2 groups were created because none of the women in our sample neither gained nor lost weight. In all analyses, separate models were fit for each inflammatory marker. We considered age (years), weight (kg) at T1 and 2 weeks pp, CD4 count (cell/µL), and SES as a priori confounders based on current literature.15 Missing data on covariates were limited and were excluded from adjusted models. A P-value of <0.05 was considered statistically significant. Model diagnostics were conducted to rule out overfitting. All data were analyzed using R Studio (R Foundation, Vienna, Austria).
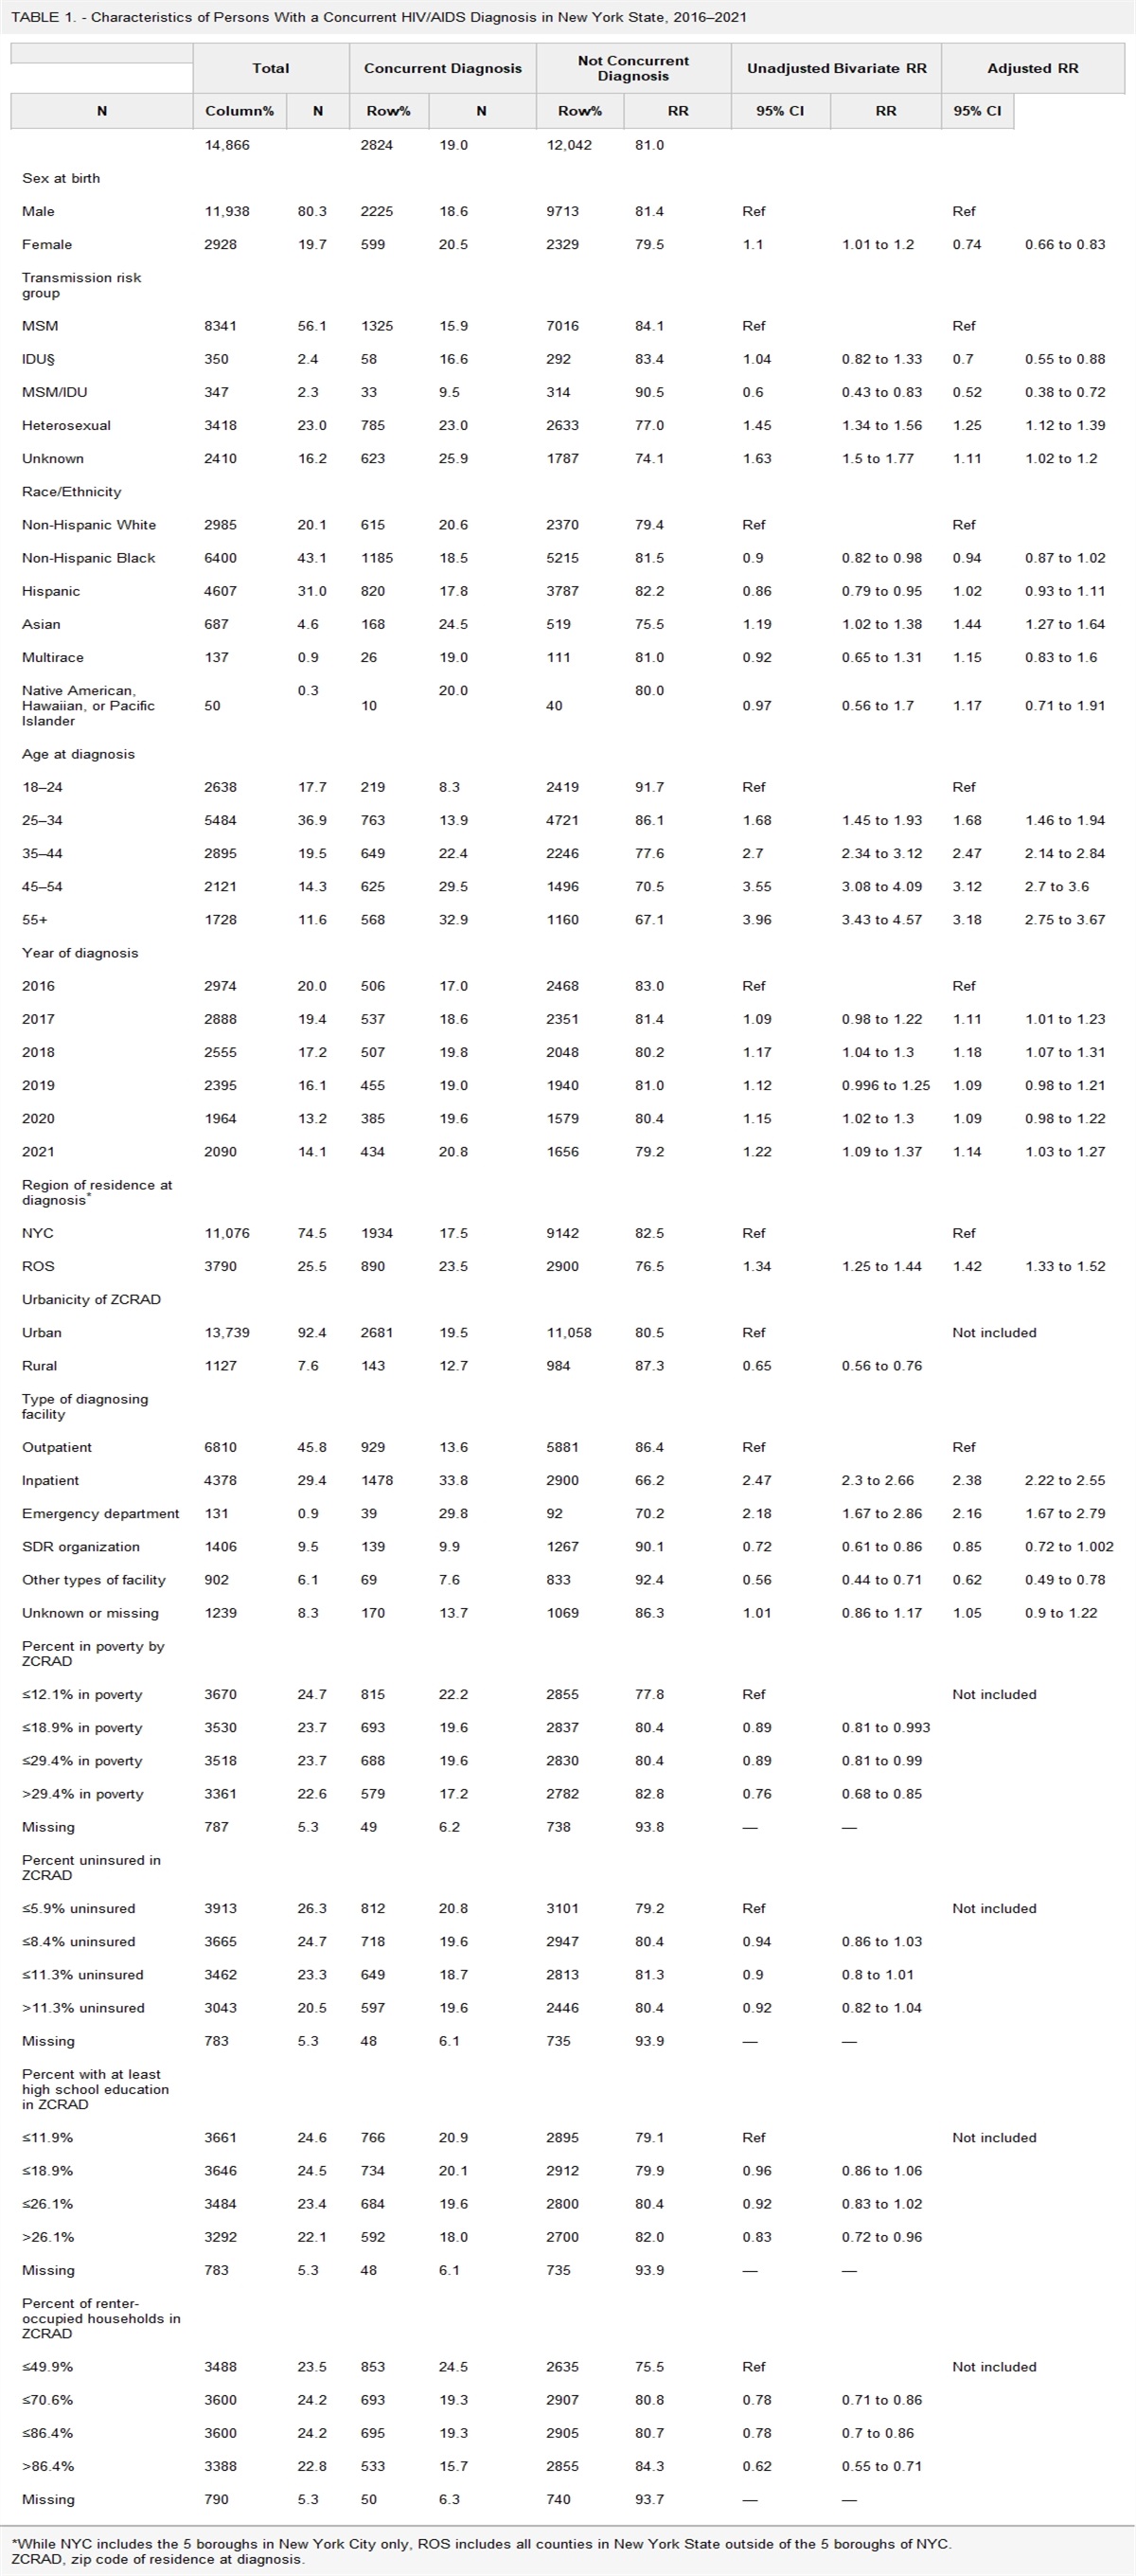
RESULTS Participant CharacteristicsA total of 57 participants were included in this analysis (see Figure 1, Supplemental Digital Content, https://links.lww.com/QAI/C259). At enrollment, the median age was 32 years (IQR, 29–35); 98% were multigravida, and 61% initiated ART preconception (see Table 1, Supplemental Digital Content, https://links.lww.com/QAI/C259). All but 3 participants had HIV VL <100 copies/mL while 86% had a CD4 count >200 cells/µL at T1. The median BMI at T1 was 30 kg/m2 (IQR, 26–34); 10 (18%) women were classified as having normal weight, 19 (33%) overweight, and 28 (49%) obesity. The median weekly GWG was 0.32 kg/wk (IQR, 0.12–0.43); 18 (43%) had low weekly GWG, 6 (14%) normal, and 18 (43%) high. The median weight change between T1 and 48 weeks PP was 0.10 kg (IQR, −3.50 to 4.50). Weight over time showed a steady increase between T1 and T3, followed by a decline between 2 and 24 weeks after delivery and thereafter a slight increase between 24 and 48 weeks (see Figure 2, Supplemental Digital Content, https://links.lww.com/QAI/C259).
Changes in Inflammatory Marker Levels in PregnancyMedian plasma levels of inflammatory markers at T1 and T3 showed a significant increase in TNFR-1 (0.603 vs 0.733 ng/mL, P = 0.02) and IL-6 (1.088 vs 1.526 pg/mL, P = 0.05; see Figure 3, Supplemental Digital Content, https://links.lww.com/QAI/C259). Although levels of sCD14 and resistin trended higher and adiponectin lower at T3, statistical significance was not reached. No apparent changes in sCD163 and leptin were observed.
Weekly GWG and PPWIn models adjusted for age, SES, CD4 count, weight at T1, and time PP, higher weekly GWG was associated with higher weight on average throughout 48 weeks PP (ß = 8.171, P = 0.01; Table 1). Association of GWG with PPW change between T1 and 48 weeks (ß = 8.315, P = 0.06) and PPW trajectories (ß = 0.006, P = 0.44) did not reach statistical significance.
TABLE 1. - Linear Regression for the Association of Inflammatory Markers at T1 and T3 and GWG Rate With PP Weight-Related Outcomes Average PPW, β (95% CI)* P PPW Trajectory, β (95% CI)* P PPW Change (48 weeks pp—T1), β (95% CI)† P T1 inflammatory marker‡ sCD14 (ng/mL) 0.002 (0.001 to 0.004) 0.04 0.001 (−0.001 to 0.001) 0.76 0.002 (−0.001 to 0.005) 0.12 sCD163 (ng/mL) 0.006 (−0.004 to 0.017) 0.22 0.001 (−0.001 to 0.001) 0.42 0.008 (−0.004 to 0.020) 0.20 Leptin (ng/mL) 0.035 (−0.099 to 0.168) 0.60 0.001 (−0.001 to 0.001) 0.80 0.015 (−0.139 to 0.168) 0.84 TNFR-1 (ng/mL) 2.628 (−2.842 to 8.098) 0.33 −0.001 (−0.015 to 0.013) 0.86 1.381 (−4.800 to 7.562) 0.65 Resistin (ng/mL) 0.235 (−0.288 to 0.757) 0.37 0.001 (−0.001 to 0.002) 0.18 0.491 (−0.095 to 1.076) 0.09 Adiponectin (μg/mL) 0.742 (−0.169 to 1.653) 0.10 −0.001 (−0.003 to 0.002) 0.63 0.650 (−0.414 to 1.714) 0.22 IL-6 (pg/mL) 0.477 (−0.387 to 1.341) 0.27 0.001 (−0.002 to 0.004) 0.50 0.389 (−0.590 to 1.363) 0.42 T3 inflammatory marker§ sCD14 (ng/mL) 0.003 (−0.001 to 0.007) 0.16 0.001 (−0.001 to 0.001) 0.11 0.007 (0.001 to 0.013) 0.04 sCD163 (ng/mL) 0.004 (−0.004 to 0.012) 0.27 0.001 (−0.001 to 0.001) 0.10 0.010 (−0.001 to 0.020) 0.08 Leptin (ng/mL) 0.414 (0.118 to 0.710) <0.01 0.001 (−0.001 to 0.001) 0.48 0.296 (−0.141 to 0.734) 0.17 TNFR-1 (ng/mL) 11.048 (3.210 to 18.887) <0.01 −0.002 (−0.021 to 0.017) 0.86 13.656 (−0.043 to 27.355) 0.05 Resistin (ng/mL) 0.714 (0.184 to 1.245) 0.01 0.001 (0.001 to 0.002) 0.02 0.936 (0.169 to 1.703) 0.01 Adiponectin (μg/mL) −0.527 (−1.481 to 0.427) 0.26 −0.001 (−0.002 to 0.002) 0.70 −0.759 (−2.226 to 0.707) 0.29 IL-6 (pg/mL) 0.812 (−0.548 to 2.172) 0.22 0.005 (0.002 to 0.009) <0.01 2.266 (0.342 to 4.190) 0.02 GWG (kg/wk) T3-T2‖ Continuous 5.998 (−2.173 to 14.169) 0.14 0.003 (−0.013 to 0.018) 0.51 5.960 (−4.545 to 16.467) 0.25 Normal 1.00 (ref) 1.00 (ref) 1.00 (ref) Low 5.646 (−0.881 to 12.172) 0.08 −0.001 (−0.014 to 0.014) 0.99 5.971 (−2.628 to 14.570) 0.16 High 8.171 (1.586 to 14.755) 0.01 0.006 (−0.009 to 0.020) 0.44 8.315 (−0.559 to 17.189) 0.06*Adjusted for age (yr), SES, CD4 count (cell/µL), weight at T1 (kg), 2 weeks PP weight (kg) and time (d), beta for PPW trajectory is the interaction covariate for time and inflammatory marker/GWG.
†Adjusted for age, SES, CD4 count, and weight at T1. SES was a composite score based on level of education, employment status, type of housing, and presence of a toilet, running water, electricity, fridge, telephone, and television in the house23; participants were categorized into tertiles corresponding to lower, middle, and higher SES group.‡Sample size is n = 57.
§Sample size is n = 31.
‖Sample size is n = 34.
In models adjusted for age, SES, weight at T1 and 2 weeks PP, and CD4 count, sCD14 (ß = 0.002, P = 0.04) at T1 was the only marker positively associated with weight on average throughout 48 weeks PP (Table 1).
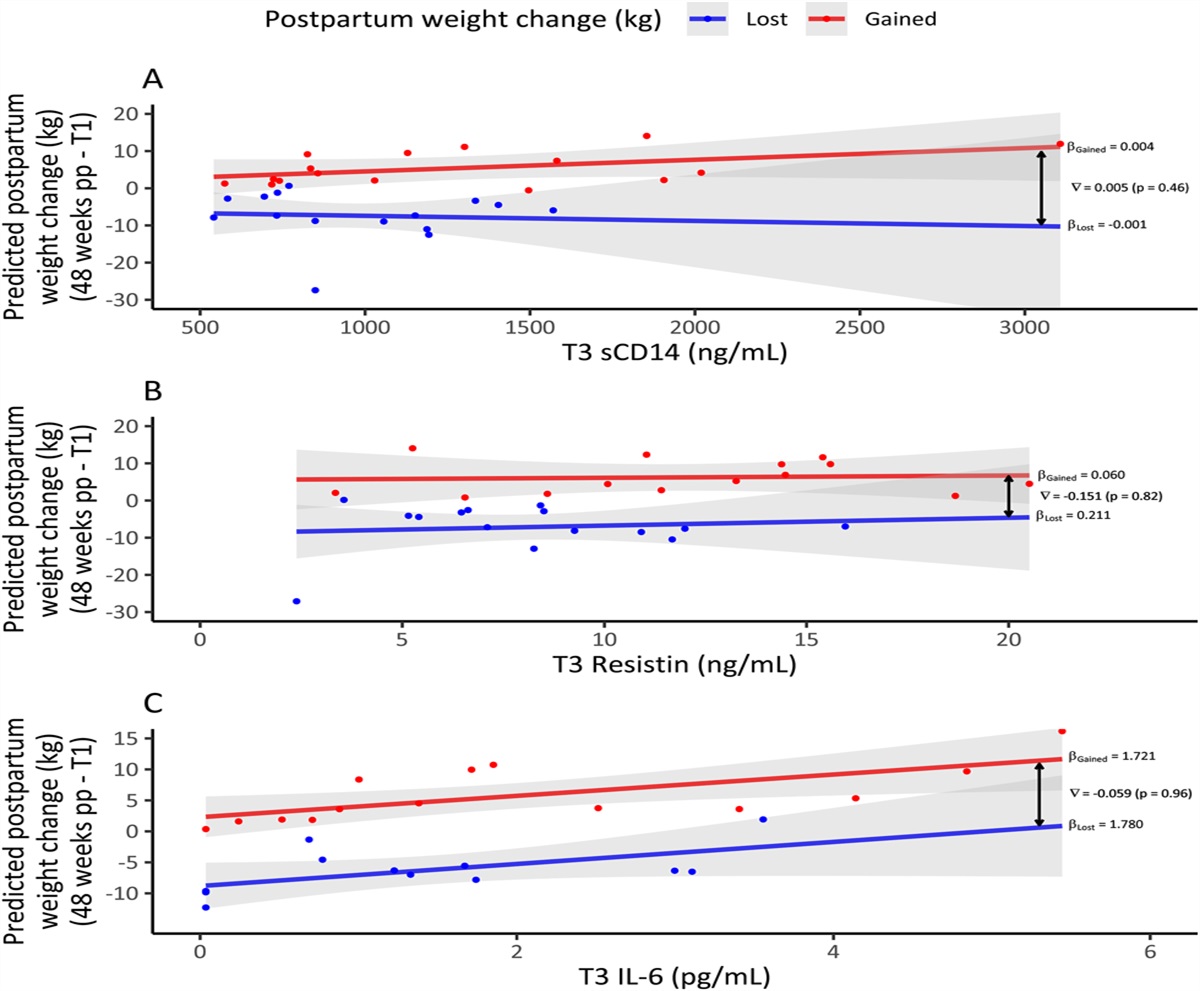
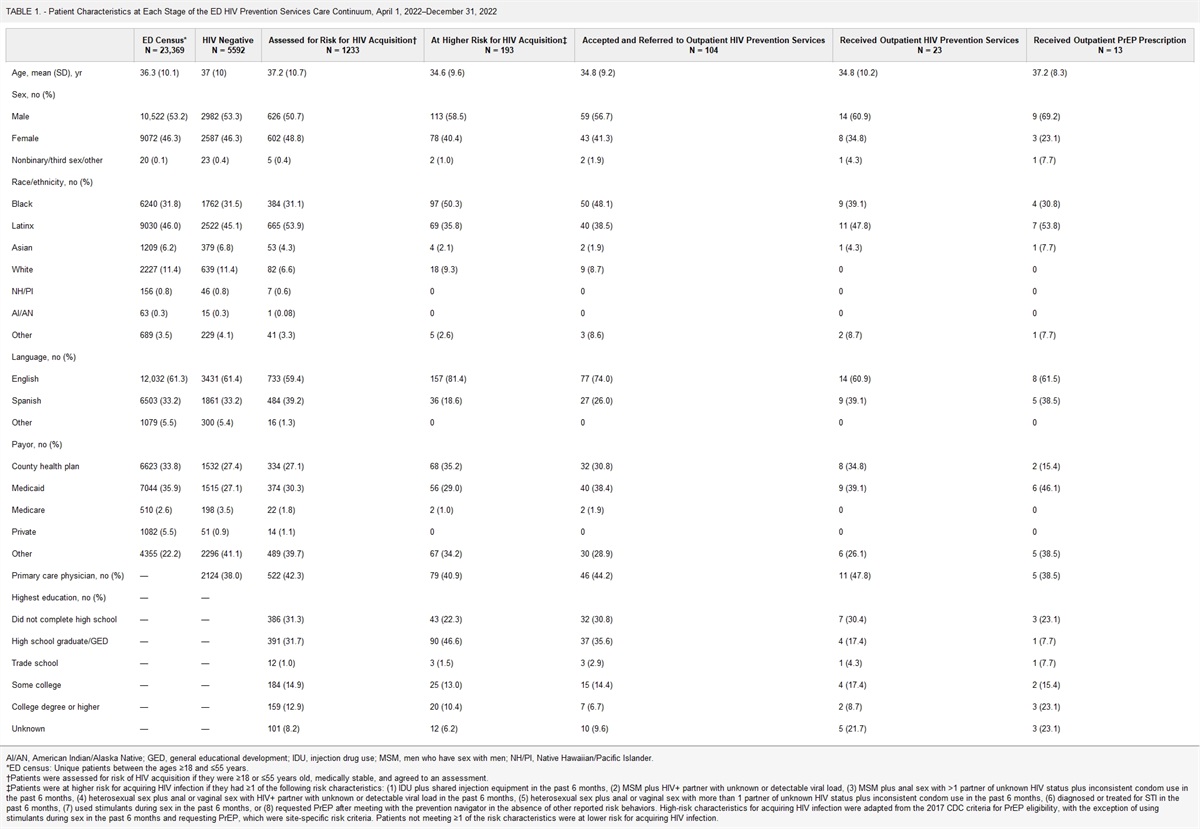
T3 Inflammatory Biomarkers and PPWIn models adjusted for age, SES, weight at T1 and 2 weeks PP, and CD4 count, T3 leptin (ß = 0.414, P < 0.01), TNFR-1 (ß = 11.048, P < 0.01), and resistin (ß = 0.714, P = 0.01) were positively associated with weight on average throughout 48 weeks PP (Table 1). In addition, higher T3 resistin (ß = 0.001, P = 0.02) and IL-6 (ß = 0.005, P < 0.01) were associated with a steeper PPW gain trajectory. After adjusting for age, SES, CD4 count, and weight at T1, sCD14 (ß = 0.007, P = 0.04), resistin (ß = 0.936, P = 0.01), and IL-6 (ß = 2.266, P = 0.02) at T3 were positively associated with PPW change between T1 and 48 weeks. Notably, this change was not different between those who lost or gained weight (Figs. 1A–C).
 FIGURE 1.:
 Linear regression estimates for the association of inflammatory markers at T3 (A–C) with PP weight change between pregnancy 48 weeks PP and T1 in strata of women that gained (red line) vs those that lost weight (blue line); nabla (∇) represent an interaction between the inflammatory marker and the indicator term (weight loss vs weight gain).
DISCUSSIONTo our knowledge, this is the first study to examine the association between inflammatory markers in pregnancy and PP obesity in PWHs in Sub-Saharan Africa. We found that systemic levels of sCD14 at both first and third trimesters of pregnancy, as well as leptin, TNFR-1, resistin, and IL-6 in third trimester, were positively associated with PPW among a population of largely well-controlled PWH.
CD14 receptor is mainly expressed in immune cells like monocytes, macrophages, neutrophils, dendritic cells, and B cells. During infection, the CD14 receptor forms a complex with lipopolysaccharide and LPS-binding protein and becomes sCD14 which activates Toll-like receptor 4-specific proinflammatory signaling cascades.16 PWHs have elevated levels of sCD14 compared with the general population9; we found that sCD14 in early and late pregnancy was associated with future adverse weight PP. Although no studies have reported the involvement of sCD14 in weight gain, knockout of CD14 receptor in mice, which prevented sCD14 activity, was shown to attenuate obesity-induced metabolic complications.17
TNFR-1 is expressed by most human tissues and is a key signaling receptor for TNF-α, which is a proinflammatory cytokine. In various metabolic conditions, particularly obesity, TNF-α is primarily secreted by macrophages that have infiltrated the adipose tissue. In the adipose tissue, TNF-α stimulates cytokine production, macrophage recruitment, and adipocyte expansion, resulting in chronic low-grade inflammation and insulin resistance.18 Many studies have demonstrated obesity-induced increase in TNF-α levels, including increases with pregnancy progression as we observed in this study. However, the reverse association between TNF-α and future weight gain has only been reported in an animal study that showed that blockade of TNFR-1 reduces obesity.19 In our study, we found that for every 1 unit increase in T3 TNFR-1, PPW increased by 11 kg on average, indicating a potential role for TNF-α and TNFR-1–associated inflammatory pathways in weight gain.
Strong evidence has shown that elevated levels of leptin and IL-6 are linked to obesity, including leptin's potential involvement in weight gain in pregnancy.20 Conversely, there are scarce data on the relationship between resistin and weight. One study on surgically treated individuals with morbid obesity found that resistin levels before surgery were associated with postsurgery body weight.21 In this study, we found that late pregnancy leptin, resistin, and IL-6 proinflammatory markers secreted by the adipose tissue were positively associated with PPW. Considering that T3 inflammatory markers were more associated with PPW compared with T1, we speculate that these markers may contribute to the observed relationship between GWG and PPW.
Our study was limited by its small sample size. In addition, we had a specific population of largely virally suppressed pregnant PWH from a single site in South Africa which may limit the generalizability of our results. The PWHs studied were taking older ART regimens, and it is unknown whether the observed associations could be different with newer (especially integrase strand transfer inhibitor-based) regimens, which might be associated with different patterns of inflammation or weight gain. However, the longitudinal follow-up of PWH enrolled in the first trimester of pregnancy through 48 weeks PP accompanied by intensive specimen collection and serial weight measurements is a unique strength. Finally, we did not adjust for multiple comparisons, which is not always necessary when one chooses a priori a small number of planned comparisons and end points which are complementary,22 as in our study. Had we adjusted for multiple comparisons, the associations just under the 0.05 significance level would no longer reach this threshold whereas those with much stronger P-values would still do.
In conclusion, our results suggest that plasma sCD14 in early and late pregnancy and leptin, TNFR-1, resistin, and IL-6 in late pregnancy are associated with adverse PPW outcomes. Future studies are warranted to validate these findings in other cohorts/settings, including among people who are not overweight or obese before pregnancy.
REFERENCES 1. McCormick CL, Francis AM, Iliffe K, et al. Increasing obesity in treated female HIV patients from Sub-Saharan Africa: potential causes and possible targets for intervention. Front Immunol. 2014;5:507. 2. Endres LK, Straub H, McKinney C, et al. Postpartum weight retention risk factors and relationship to obesity at 1 year. Obstet Gynecol. 2015;125:144–152. 3. Bengtson AM, Phillips TK, le Roux SM, et al. Postpartum obesity and weight gain among human immunodeficiency virus-infected and human immunodeficiency virus-uninfected women in South Africa. Matern Child Nutr. 2020;16:e12949. 4. Soria-Contreras DC, Rifas-Shiman SL, Aris IM, et al. Weight trajectories after delivery are associated with adiposity and cardiometabolic markers at 3 years postpartum among women in Project Viva. J Nutr. 2020;150:1889–1898. 5. Khanna D, Khanna S, Khanna P, et al. Obesity: a chronic low-grade inflammation and its markers. Cureus. 2022;14:e22711. 6. Panagiotakos DB, Pitsavos C, Yannakoulia M, et al. The implication of obesity and central fat on markers of chronic inflammation: the ATTICA study. Atherosclerosis. 2005;183:308–315. 7. Leal VdO, Mafra D. Adipokines in obesity. Clinica Chim Acta. 2013;419:87–94. 8. Mallardo M, Ferraro S, Daniele A, et al. GDM-complicated pregnancies: focus on adipokines. Mol Biol Rep. 2021;48:8171–8180. 9. Williams JC, Zhang X, Karki M, et al. Soluble CD14, CD163, and CD27 biomarkers distinguish ART-suppressed youth living with HIV from healthy controls. J Leukoc Biol. 2018;103:671–680. 10. Holz T, Thorand B, Döring A, et al. Markers of inflammation and weight change in middle-aged adults: results from the prospective MONICA/KORA S3/F3 study. Obesity (Silver Spring, Md.). 2010;18:2347–2353. 11. Malaba TR, Myer L, Gray C, et al. Cohort profile: prematurity Immunology in Mothers living with HIV and their infants study (PIMS). BMJ Open. 2021;11:e047133. 12. Lv T, Cao W, Li T. HIV-related immune activation and inflammation: current understanding and strategies. J Immunol Res. 2021;2021:7316456. 13. Inskip H, Crozier S, Baird J, et al. Measured weight in early pregnancy is a valid method for estimating pre-pregnancy weight. J Dev Orig Health Dis. 2021;12:561–569. 14. Institute of Medicine. Weight Gain during Pregnancy: Reexamining the Guidelines. Washington, DC: Institute of Medicine; 2009. 15. Olson JS, Hayward MD. Breastfeeding, overweight status, and inflammation. Soc Sci Res. 2017;64:226–236. 16. Ichise Y, Saegusa J, Tanaka-Natsui S, et al. Soluble CD14 induces pro-inflammatory cytokines in rheumatoid arthritis fibroblast-like synovial cells via toll-like receptor 4. Cells. 2020;9:1689. 17. Roncon-Albuquerque R Jr, Moreira-Rodrigues M, Faria B, et al. Attenuation of the cardiovascular and metabolic complications of obesity in CD14 knockout mice. Life Sci. 2008;83:502–510. 18. Bradley JR. TNF-mediated inflammatory disease. J Pathol. 2008;214:149–160. 19. Liang H, Yin B, Zhang H, et al. Blockade of tumor necrosis factor (TNF) receptor type 1-mediated TNF-alpha signaling protected Wistar rats from diet-induced obesity and insulin resistance. Endocrinology. 2008;149:2943–2951. 20. Wang D, Darling AM, McDonald CR, et al. Plasma concentrations of leptin at mid-pregnancy are associated with gestational weight gain among pregnant women in Tanzania: a prospective cohort study. BMC Pregnancy Childb. 2021;21:675. 21. Vendrell J, Broch M, Vilarrasa N, et al. Resistin, adiponectin, ghrelin, leptin, and proinflammatory cytokines: relationships in obesity. Obes Res. 2004;12:962–971. 22. Rothman KJ. No adjustments are needed for multiple comparisons. Epidemiology. 1990;1:43–46. 23. Myer L, Stein DJ, Grimsrud A, et al. Social determinants of psychological distress in a nationally-representative sample of South African adults. Soc Sci Med. 2008;66:1828–1840.
留言 (0)