
記住我
In Kenya, female sex workers (FSWs) and adolescent girls and young women (AGYW) experience disproportionate rates of HIV infection and are a priority for HIV prevention programs.1–3 The most recent estimate of HIV prevalence among FSWs over the age of 18 years in Kenya was 29.3% in 2018.4,5 AGYW aged 15–25 years comprised 18% of the population in Kenya in 2017, yet acquired 24% of new HIV infections.6,7
There is a large body of research on how individual-level factors confer HIV risk. Early age at first sex8–10 is linked to higher HIV risk, as is intergenerational sex11,12 and gender-based violence.13–15 Young women who sell sex often experience higher rates of unprotected sex, and higher prevalences of sexually transmitted infections, gender-based violence, and substance use.14,16,17 Transactional sex (TS) (exchange of sex for money or gifts where the price is not pre-negotiated18) has been associated with increased HIV risk among AGYW19,20 with a recent systematic review indicating that AGYW who engaged in TS were 1.5–2.0 times as likely to be infected with HIV.21 However, it is important to recognize that not all AGYW experience these vulnerabilities, and those that do, do not necessarily experience them to the same extent. Thus, the distribution of risk is not homogeneous across all AGYW,22–24 and understanding which subgroups of AGYW are at highest risk of experiencing these drivers of HIV is important from a program perspective. We previously reported that many AGYW who engage in formal SW, TS, and nontransactional sex (NTS) in Kenya experience a range of shared vulnerabilities including early age at first sex, intergenerational sex, and gender-based violence.25 In many instances, the boundaries between TS and formal commercial sex are not distinct18,26–31; for example, individuals who self-identify as sex workers may also engage in TS and can have nontransactional sexual partnerships.
Beyond individual-level risk, HIV risk also depends on sexual networks. The composition of the sexual network may be influenced by factors including the locations where individuals seek sexual partners. A well-defined set of locations are SW locations (hotspots), characterized as physical places or “spaces” where individuals solicit and/or seek paid sex. HIV prevention programmes in Kenya, as elsewhere, have an established history of using hotspot-based programming for sex workers as outreach and place-based service provision.1,32–34 In Kenya, hotspots may include venues (eg, bars) or nonvenue-based locations such as parks or beaches.35 Data on HIV prevalence and individual-level risk factors among sex workers and other key populations demonstrate differential risks by type of hotpots,13,35–37 suggesting that hotspots may act as a proxy for network-level risks.38–41 Our previous research has demonstrated that, in Kenya, approximately 84% of hotspots were places where other AGYW, engaged in transactional and/or NTS, also met sex partners.35 It is therefore posited that individuals who meet sex partners at a shared hotspot may be part of the same sexual network, whether they are selling sex.
To effectively address the HIV epidemic and prevent infections among these groups, HIV prevention programs seek to understand which subgroups of AGYW are at highest risk, and importantly, where to best reach and engage with these subgroups.42,43 We therefore sought to examine, among AGYW who frequent SW hotspots in Mombasa, Kenya: (1) the pattern of HIV prevalence among AGYW by hotspot type (venue versus nonvenue, defined in the methods below) and engagement in formal SW, TS but not formal SW, versus those who do not engage in formal SW or TS (herein referred to as engagement in NTS only, NTS); and (2) the extent to which associations between HIV prevalence and hotspot/group remain after adjustment for individual-level risk factors.
METHODSWe conducted a cross-sectional biological and behavioral survey among sexually active AGYW aged 14–24 years in Mombasa, Kenya in 2015.
Study Setting and PopulationDetails of the protocol have been published elsewhere.44 In brief, eligible participants included sexually active AGYW aged 14–24 years who were recruited from “hotspots,” defined as locations such as bars, nightclubs, hotels, and public spaces where FSWs solicit clients. Before survey implementation, we conducted programmatic mapping45 to identify the universe of hotspots and estimate numbers of AGYW within these locations.35
Sample Size CalculationsA sampling frame constituting the universe of hotspots was developed based on the mapping, and for the survey we used a multi-stage cluster sampling approach with probability proportional to the size of the estimated AGYW population in the hotspots.44 Based on expected HIV prevalence of the 3 study groups, with 80% statistical power and 95% confidence level, the sample sizes of the NTS group, TS group, and SW group were 900, 450, and 450, respectively.
Study ProceduresPotential participants were identified at the hotspots by community mobilizers (former or current FSWs). A random selection of participants was done among those identified in the hotspot, who were then screened for eligibility. Those AGYW interested in the study attended a nearby study site for screening and enrolment. After informed consent and enrolment, trained interviewers administered a structured questionnaire in English or Kiswahili (local language). If a participant was not eligible or declined to participate, a replacement was made by selecting another potential participant from the hotspot.
After completion of the questionnaire, participants who also provided consent to biological testing underwent HIV testing by a trained HIV testing counsellor using fingerprick whole-blood sampling for rapid testing as per national HIV testing guidelines.46 Results were provided immediately to the participant, and those individuals who tested positive for HIV were referred for HIV treatment and care. Participants were given the option of providing either a venous blood sample as part of a nested biological substudy, from which a dried blood spot specimen (DBS) was made in the International Centre for Reproductive Health Kenya laboratory at the Coast Provincial General Hospital in Mombasa, or a DBS specimen at the study site from a fingerprick sample. DBS samples were transferred to the National HIV and Retrovirology Laboratories in Winnipeg, Canada and underwent serological testing by the Avioq HIV-1 Microelisa System (Avioq Inc, Research Triangle Park, NC). HIV prevalence was measured using DBS serology data, which were linked to questionnaire data in a CSPro Database.
DefinitionsHotspots were divided into 2 types: venues (bars, night clubs, hotels, guest houses, lodges, restaurants, local brew dens, sex dens, and brothels) and nonvenues (streets and other public places). We classified hotspots into these 2 types based on existing evidence, which suggests that HIV risks and prevalence differ between FSWs who solicit clients in venues versus nonvenues.47–52 For the purpose of this analysis, participants were classified in 1 of 3 groups: (1) SW if they self-identified as a sex worker; (2) TS if they did not self-identify as a sex worker, but reported at least 1 sex partner in their lifetime where there was an expectation and where there was receipt of money/goods in return for sex but the price was not pre-negotiated18; and (3) NTS if they did not self-identify as a sex worker and reported never receiving money/goods in exchange for sex. Literacy was defined as being able to read and write.
Statistical AnalysisWe reported descriptive statistics of sociodemographic characteristics and behavioral factors, including median and interquartile range (IQR), and prevalence and 95% confidence intervals of categorical variables. Descriptive statistics were presented stratified by subgroup (SW, TS, NTS) and hotspot type (venue versus nonvenue). We examined differences in sociodemographic and behavioral characteristics between different subgroups in a given hotspot type and between members of the same subgroup who frequent venue and nonvenue settings, using the Kruskal–Wallis test and Pearson χ2 test to assess equality of medians and proportions, respectively.
To address objective 1, we first reported HIV prevalence stratified by subgroup and hotspot type, with binomial 95% confidence intervals (CIs), followed by age-adjusted HIV prevalence ratios (agePR) by subgroup, both unstratified and stratified by hotspot type, using NTS as the reference in each case and adjusting for current age as a continuous variable.
For objective 2, to select individual-level risk factors, we first examined which individual-level factors were associated with HIV status using prevalence ratios, adjusting for age. We considered the following individual-level factors (excluding subgroup and hotspot type) known to be associated with prevalent HIV infection based on prior literature and available variables: literacy,53 marital status,48 education level,36,54 prior pregnancy,55,56 duration of sexual activity,57 age at first sex,10,25 age of first sexual partner,11,12 condom use at first sex,25,58 drug use (ever),36,37,59 alcohol consumption (past month),60,61 prior experience of physical/sexual violence,49,62,63 and HIV testing history.36,64 Factors associated with HIV status with P < 0.1 were used to build a multivariable model of individual-level risk factors and HIV status, using Akaike information criterion to determine which factors were retained. The factors in the final multivariable model of individual-level risk were used in the next analysis and considered significant with a P < 0.05.
We then estimated HIV prevalence ratios by group and hotspot type. Few participants in nonvenues necessitated combining 2 subgroups in this analysis; under the assumption that those not engaged in SW (ie, TS and NTS) would be the most similar pairing, for this analysis we combined TS and NTS; this assumption was subsequently found to be consistent with HIV prevalence (Fig. 1). We thus estimated the HIV prevalence ratio, relative to venue-based AGYW not engaged in SW, in 3 groups: venue-based SW; non-venue-based SW; AGYW in nonvenues not engaged in SW. We estimated the HIV PRs with only age adjustment and then adjusting for both age and all the significant factors from the individual-level analysis above.
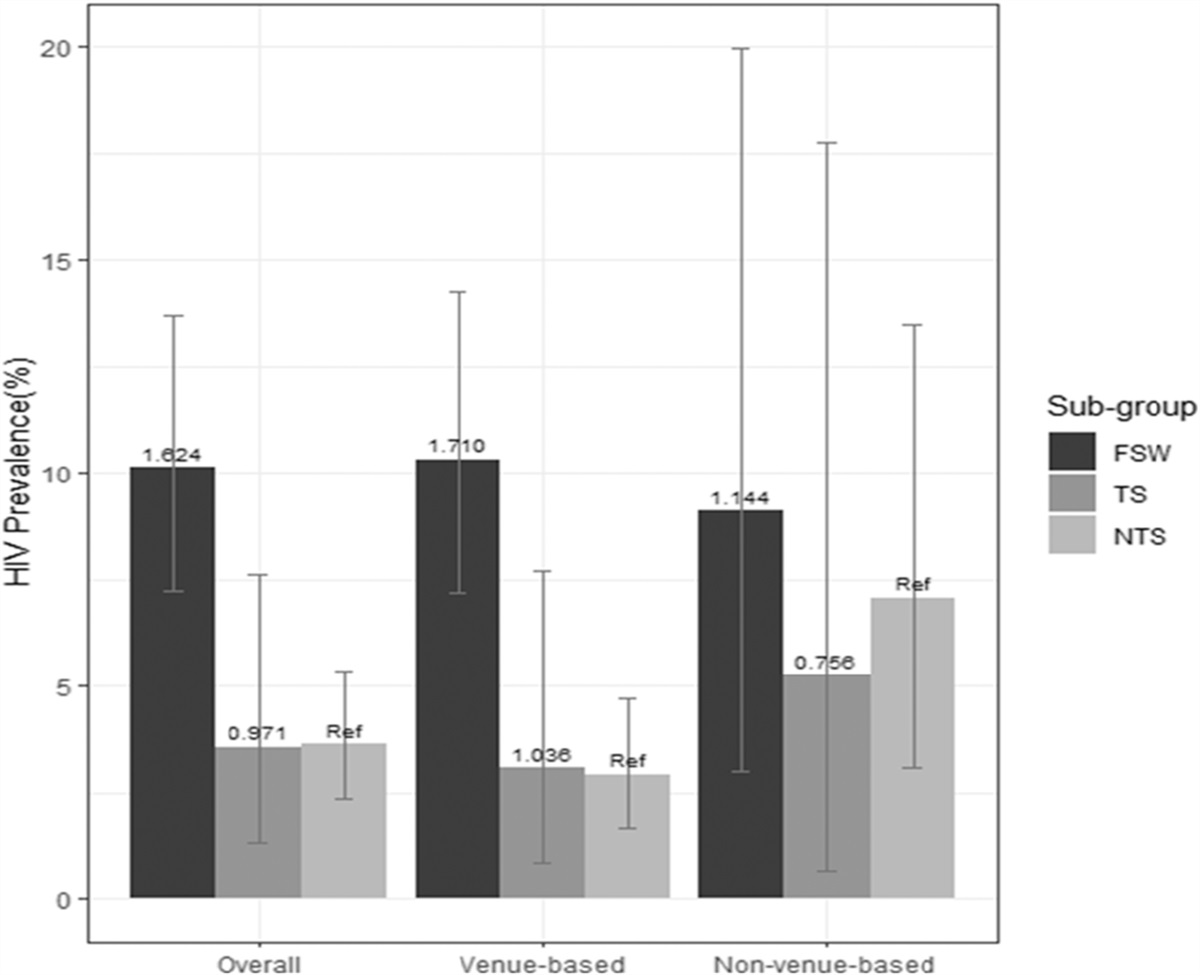
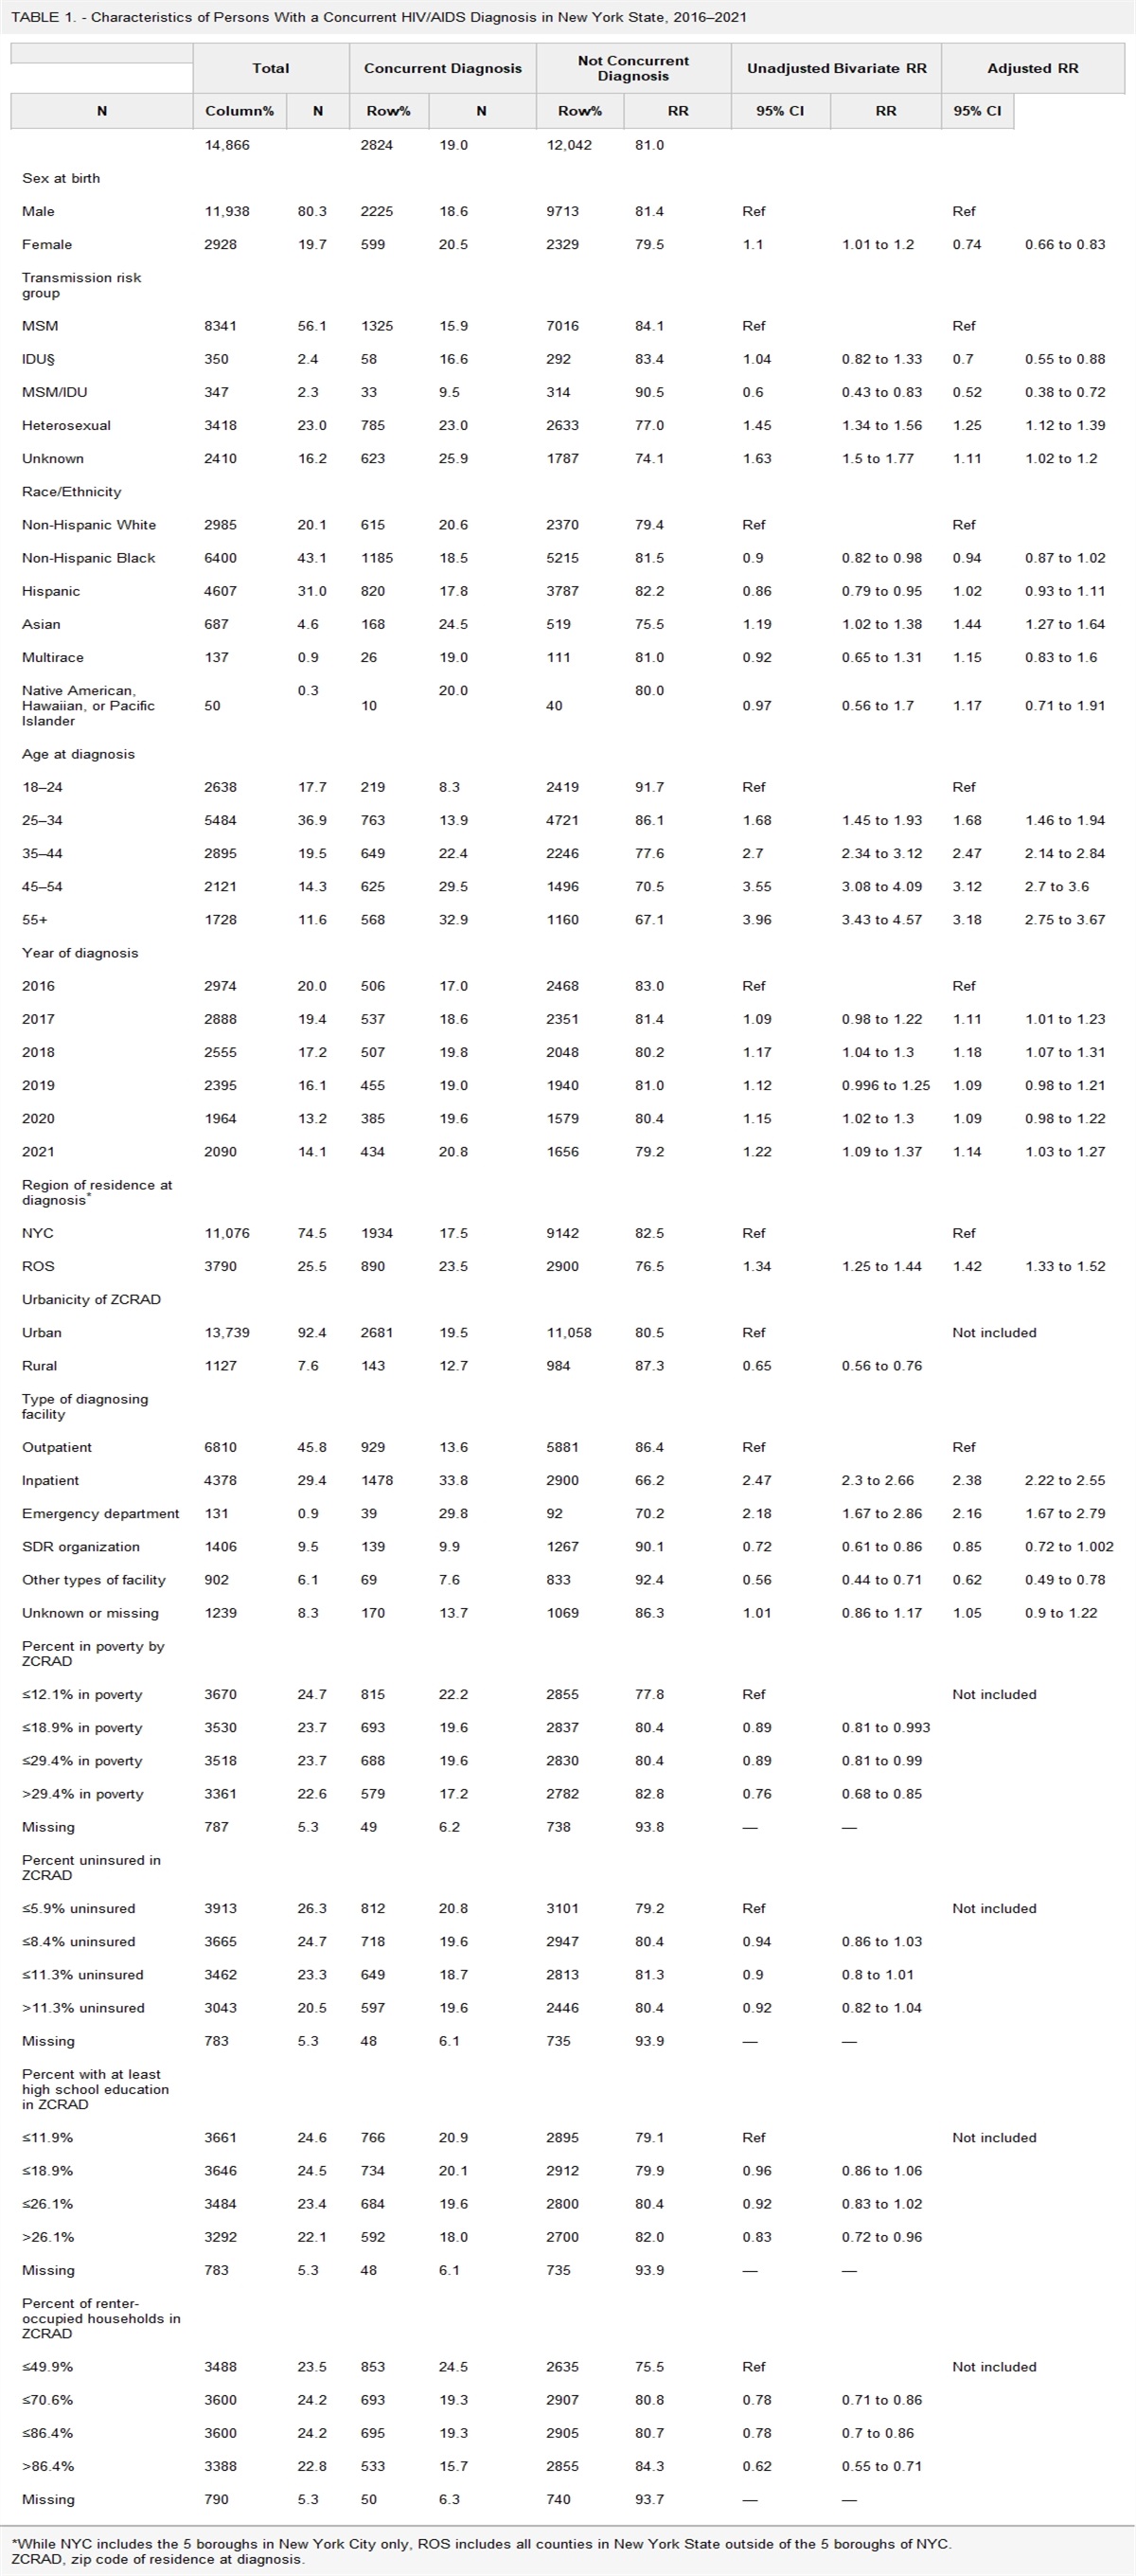
 FIGURE 1.:
 HIV prevalence with 95% confidence intervals by engagement in SW group and hotspot type. Numbers above the bars show the agePR unstratified and stratified by hotspot type.
All analyses were carried out using R 4.1.2. Prevalence ratios were calculated using the epi.2by2 command using the “exact” method in the epiR package (version 2.0.4.1) for unadjusted PRs, and the glm command with a log link for adjusted PRs.
EthicsThe study was approved by the institutional ethics review boards of the University of Manitoba, Canada, the University of Nairobi, Kenya, and the National Commission for Science, Technology and Innovation, Kenya.
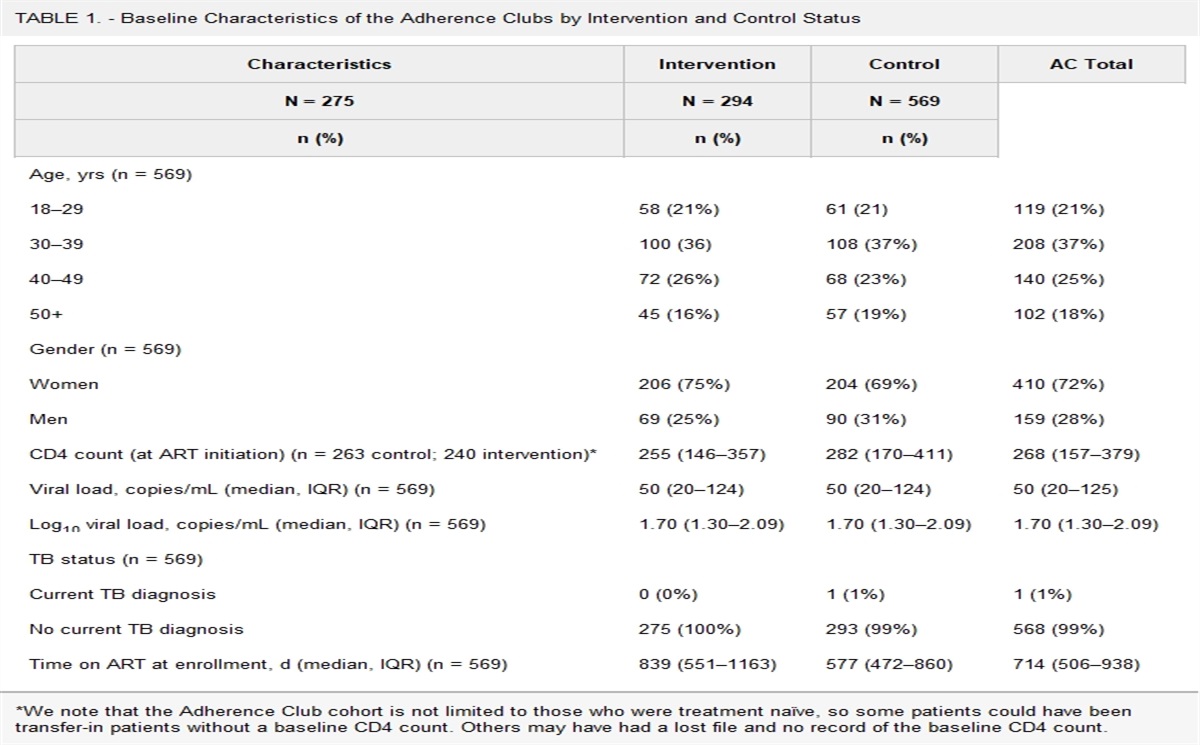
RESULTS Participant CharacteristicsOne thousand four hundred nineteen AGYW were screened and 1304 were eligible to participate in the study (Table 1). One thousand two hundred ninety-nine (99.6%) of eligible participants consented to complete the questionnaire, of whom 1193 (91.8%) agreed to HIV testing by DBS. The final study sample comprised 365 AGYW engaged in SW (30.6%), 168 AGYW engaged in TS (14.1%), and 660 AGYW engaged in NTS (55.3%). Among FSWs, 310 (84.9%) were recruited from venues, whereas among participants in the TS and NTS groups, 130 AGYW and 547 AGYW (77.4% and 82.9%), respectively, were recruited from venues. Overall, participants had a median age of 19 (IQR 17–21) years at the time of study participation. Median age at first sex was 16 (IQR 14–17) years, with FSWs reporting a younger age at first sex (15 years) compared with AGYW in the other groups. Table 1, Supplemental Digital Content, https://links.lww.com/QAI/C265, compares sociodemographic and sexual characteristics between the 3 subgroups within each hotspot type, and between venue and nonvenue for each subgroup. There were significant differences between subgroups in both venues and nonvenues for many characteristics including age at first sex, ever pregnant, ever used drugs, alcohol consumption, and experiences of sexual and physical violence. However, comparing the same subgroup across venue and nonvenue settings, only ever pregnant among TS, and ever HIV test among NTS were significantly different.
TABLE 1. - Sociodemographic and Sexual Characteristics Among Adolescent Girls and Young Women Who Frequent SW Hotspots in Mombasa, Kenya by Hotspot Type and Subgroup (FSW, TS, and NTS) Characteristics Venue-Based Nonvenue-Based Overall FSW TS NTS Overall FSW TS NTS N = 987 N = 310 N = 130 N = 547 N = 206 N = 55 N = 38 N = 113 Age, median (IQR) 19 (17, 21) 20 (18, 22) 19 (18, 21) 19 (17, 21) 19 (17, 21) 20 (17, 22) 19 (18, 21) 19 (17, 21) Age at first sex, median (IQR) 16 (14, 18) 15 (14, 17) 16 (15, 18) 16 (15, 18) 16 (14, 17) 15 (13, 17) 16 (14, 17) 16 (15, 18) Literate, n (%) 956 (97.0) 301 (97.1) 124 (96.1) 531 (97.1) 201 (97.6) 53 (96.4) 38 (100) 110 (97.4) Ever married, n (%) 73 (7.4) 26 (8.4) 10 (7.8) 37 (6.8) 9 (4.4) 2 (3.6) 0 (0) 7 (6.2) Education level, n (%) Never received formal education 17 (1.7) 5 (1.6) 2 (1.6) 10 (1.9) 5 (2.4) 2 (3.6) 1 (2.6) 2 (1.8) Education level below secondary education 716 (73.4) 248 (80.3) 79 (61.7) 389 (72.2) 154 (74.8) 44 (80.0) 24 (63.2) 86 (76.1) Secondary education 243 (24.9) 56 (18.1) 47 (36.7) 140 (26.0) 47 (22.8) 9 (16.4) 13 (34.2) 25 (22.1) Ever pregnant, n (%) 379 (38.4) 177 (57.1) 57 (43.9) 145 (26.6) 75 (36.4) 33 (60.0) 9 (23.7) 33 (29.2) Sexually active >4 yrs, n (%) 244 (26.4) 121 (42.6) 28 (23.0) 95 (18.3) 50 (26.2) 24 (45.3) 10 (30.3) 16 (15.2) First partner 10+ yrs older, n (%) 68 (6.9) 39 (12.6) 7 (5.4) 22 (4.0) 14 (6.8) 7 (12.7) 2 (5.3) 5 (4.4) Ever used drugs, n (%) 200 (20.3) 97 (31.4) 23 (17.7) 80 (14.7) 38 (18.5) 17 (30.9) 5 (13.2) 16 (14.2) Alcohol consumption in past month, n (%) Daily/almost daily 103 (10.5) 92 (29.8) 9 (6.9) 2 (0.4) 16 (7.8) 15 (27.3) 1 (2.6) 0 (0) Sometimes 325 (33.0) 153 (49.5) 60 (46.2) 112 (20.5) 61 (29.6) 29 (52.7) 14 (36.8) 18 (15.9) None 557 (56.6) 64 (20.7) 61 (46.9) 432 (79.1) 129 (62.6) 11 (20) 23 (60.5) 95 (84.1) Ever experienced physical violence, n (%) 179 (18.3) 91 (29.6) 32 (25) 56 (10.3) 36 (17.6) 19 (34.6) 4 (10.8) 13 (11.5) Ever experienced sexual violence, n (%) 206 (21.1) 89 (29.1) 40 (31.5) 77 (14.1) 40 (19.5) 17 (30.9) 8 (21.6) 15 (13.3) Ever HIV test, n (%) 845 (86.0) 294 (95.2) 113 (88.3) 438 (80.2) 183 (89.3) 50 (90.9) 33 (86.8) 100 (89.3) HIV test last year, n (%) 596 (62.8) 246 (81.2) 79 (64.2) 271 (51.8) 127 (65.5) 41 (77.4) 23 (65.7) 63 (59.4)The overall HIV prevalence was 5.6% (95% CI: 4.3% to 6.9%): 5.3% (95% CI: 3.9% to 6.7%) among participants recruited from venues and 7.3% (95% CI: 3.7% to 10.8%) among participants recruited from nonvenues. Compared with NTS (Fig. 1), participants engaged in TS had a similar HIV prevalence (HIV prevalence 3.6%, age-adjusted prevalence ratio, agePR 0.97, 95% CI: 0.41 to 1.80) overall; but participants engaged in SW were more likely to be living with HIV (HIV prevalence 10.1%, agePR 1.62, 95% CI: 1.28 to 1.97).
HIV Prevalence Across Subgroups, Stratified by Hotspot TypeThe differential pattern of overall HIV prevalence by subgroups persisted when restricting to venues, which was expected as 84% of the sample was venue-based. However, among participants recruited from nonvenues, there was no difference detected between participants engaged in SW and those not engaged in SW.
Association Between Individual-Level Risk Factors and Prevalent HIV InfectionTable 2 shows the agePRs for individual-level variables with HIV infection. Individual-level factors associated with HIV prevalence were nonliteracy [agePR 3.10 (1.37–5.81)], ever having been pregnant [agePR 1.75 (1.06–2.92)], first sex at age 15 years or younger [agePR 1.57 (0.94–2.58)], regular alcohol use [agePR 2.79 (1.49–5.01)], history of experiencing sexual violence [agePR 2.41 (1.48–3.83)] or physical violence [agePR 1.82 (1.08–2.94)], and ever HIV tested [agePR 3.61 (1.12–22.1)]. Secondary education was associated with lower HIV prevalence [agePR 0.27 (0.10–0.57).
TABLE 2. - Factors Associated With HIV Status, After Adjusting for Age, Among Adolescent Girls and Young Women in Mombasa, Kenya N Age-Adjusted Prevalence Ratio* (95% CI) P Marital status 1192 Ever married 0.968 (0.380 to 2.017) 0.937 Literate 1192 No 3.098 (1.374 to 5.807) 0.002 Education level 1182 Never received formal education 1.640 (0.429 to 3.886) 0.370 Education level below secondary education REF Secondary education 0.269 (0.104 to 0.566) 0.001 Ever pregnant 1192 Yes 1.746 (1.059 to 2.923) 0.029 Duration of sexual activity 1116 >4 yrs 1.599 (0.902 to 2.826) 0.104 Age at first sex 1116 ≤15 yrs old 1.569 (0.942 to 2.581) 0.079 Age of first sexual partner 1191 ≥10 yrs older 1.845 (0.882 to 3.379) 0.069 Duration of sex work (FSWs only) 394 ≥2 years 0.871 (0.470 to 1.630) 0.662 Condom use at first sex 1182 No 1.387 (0.844 to 2.370) 0.210 Alcohol use 1191 None REF Daily/almost daily 2.788 (1.491 to 5.013) <0.001 Sometimes 1.472 (0.862 to 2.507) 0.152 Drug use (ever) 1191 Yes 0.840 (0.436 to 1.480) 0.573 Ever experienced sexual violence 1183 Yes 2.405 (1.479 to 3.826) <0.001 Ever experienced physical violence 1186 Yes 1.817 (1.078 to 2.943) 0.018 HIV test (ever) 1188 Yes 3.608 (1.121 to 22.076) 0.076 HIV test in the past 12 mo 1143 Yes 0.996 (0.584 to 1.777) 0.989P-values: P < 0.1 are shown in bold.
*Adjusted for age at the time of study.
In multivariable regression, based on the above variables and excluding subgroup/hotspot type, nonliteracy, history of experiencing sexual violence, and ever HIV tested were significantly associated as well as age (results not shown). These variables were used as the individual-level factors in the subsequent analysis.
Remaining pattern of prevalent HIV infection by subgroup and hotspot type, after adjustment for individual-level factors.
Table 3 shows the association between prevalent infection and subgroup/hotspot type. Compared with venue-based AGYW not engaged in SW, the point estimates for the age-adjusted PRs for venue and nonvenue SWs, and for nonvenue AGYW not engaged in SW were all of a similar magnitude. Adjusting for individual-level factors (nonliteracy, history of experiencing sexual violence, and ever HIV tested) gave similar results, with adjusted PRs higher among venue-based SW (2.72, 95% CI: 1.56 to 4.85) and nonsignificantly higher among nonvenue SW (2.50; 95% CI: 0.86 to 5.93) and nonvenue AGYW not engaged in SW (2.11, 95% CI: 0.97 to 4.30).
TABLE 3. - Association Between Engagement in SW and Location and Prevalent HIV Infection N Prevalence Ratio (95% CI): Adjusted for Age as a Continuous Variable Only Adjusted Prevalence Ratio* (95% CI) Engagement in sex work group/hotspot 1178 Venue-based not engaged in SW 669 1.00 1.00 Venue-based SW 305 3.16 (1.82, 5.62) 2.72 (1.56, 4.85) Nonvenue-based SW 55 2.85 (0.98, 6.77) 2.50 (0.86, 5.93) Nonvenue-based not engaged in SW 149 2.35 (1.07, 4.82) 2.11 (0.97, 4.30)*Adjusted for literacy (reference: no), ever experienced of sexual violence (ref: no), ever HIV tested (ref: no), and age as a continuous variable.
We identified a high HIV prevalence among this young population (5.6%), with HIV prevalence highest among venue-based FSWs (10.1%). When we examined HIV prevalence by hotspot type (venue versus nonvenue), FSWs in venues, and AGYW in nonvenues who were not engaged in SW, were at higher risk of HIV than AGYW in venues who were not engaged in SW. After controlling for individual-level variables, the differences with AGYW in venues not engaged in SW still showed a trend towards significant, with point estimates for prevalence ratios ranging from 2.1 to 2.7 for the different groups. There were only 55 FSWs in nonvenues and 149 AGYW not engaged in SW in nonvenues. Although these results are not conclusive because of the few nonvenue participants, they do provide an indication that for AGYW frequenting nonvenue locations, whereas they largely do not differ in sociodemographic or sexual characteristics compared with their venue-based equivalents, the risk of HIV acquisition is high regardless of whether they sell sex or not.
This lack of distinction in HIV prevalence between subgroups in nonvenue-based locations is important as it suggests that, in these locations, HIV prevention programs need to ensure that services reach all AGYW regardless of their sex worker status. Furthermore, the overall HIV prevalence of 5.6% (95% CI: 4.3% to 6.9%) compared with AGYW in the general population in Kenya [2.61% (1.34%–3.98%)]6 suggests that these are important locations to reach a subset of higher risk AGYW. Beyond this, it also suggests that there are important attributes within, and around or related to, these locations that convey risk, not only to FSWs but to other AGYW who congregate in these same locations. We have termed this theory as “Ecologies of Risk.” Our study, and the analysis presented here, begin to provide further understanding of how environments shape risk. The hotspot typology, which we examined here, represents a micro-environment, but there are other broader factors that influence risk and require consideration.52,65 For example, structural determinants of HIV risk in SW have been identified including social and physical features of the work environment, community empowerment and organization, and legal policies and frameworks.49,66,67 The connectedness of the sexual network(s) within and between hotspots may also play an important role in increasing risk. Although our study did not explore all these other important drivers of infection, our findings inform us that the high risk of HIV seems to be shared across AGYW who are congregating in these hotspots and these AGYW are at higher risk of HIV than their counterparts in the general population in Kenya.6 We are planning to conduct additional research to further understand contributors to HIV risk within these environments.
In addition to understanding which AGYW are at higher risk, knowing where to reach these higher risk AGYW is critical for program implementers.68 Our previous work in Mombasa, Kenya has shown that in 85% of hotspots where AGYW who sold sex were congregating, other AGYW were also present.35 Together, these data suggest that these hotspots are important locations for HIV prevention programs to access and deliver services.
Previous research by our team also demonstrates the high unmet need in HIV testing by AGYW and that hotspot-based testing offers an important opportunity to increase the proportion of AGYW living with HIV that are aware of their status.69 In this study, we found that HIV testing was highest among FSWs in venue-based locations. This likely reflects the fact that HIV prevention programs most commonly provide outreach services to venue-based locations, in which it is often “easier” to identify and reach FSWs. Our data signal a large gap in reaching those AGYW who sell sex in nonvenue-based locations. We found that only 77.4% of AGYW selling sex in nonvenue-based locations had tested for HIV in the previous year, despite recommendations for regular testing for HIV among this population.2 Low levels of access to HIV prevention services for nonvenue-based sex workers has been demonstrated in other contexts globally as well.50,70,71
Finally, our study has also highlighted the need to identify and reach AGYW at higher risk early on in their sexual life course. We have previously published on the HIV vulnerabilities among AGYW in Kenya at their first sexual event.25 Combined, these data strongly suggest that HIV prevention programs need to reach AGYW earlier in their sexual life course and reinforces the calls that others have made for urgent action.72,73 In addition to the HIV risks faced by these AGYW, our study identified a number of other very important issues, including high rates of pregnancy (38%) and experiences of both physical (18%) and sexual (21%) violence. These findings are consistent with other research from the region. In the general population in Kenya, an estimated 18% of adolescent girls between the ages of 15–19 have been pregnant,74 whereas a recent review on gender-based violence identified that approximately 28% of AGYW experienced lifetime physical or sexual violence.13 Our findings support the inclusion of structural interventions to address violence and for the integration of sexual and reproductive health services into HIV prevention programs, particularly for AGYW early on in their lifecourse.73,75–80
Study limitations include that data were collected through face-to-face interviews and by self-report, which may be prone to measurement and social desirability bias. In addition, some participants (8.2%) declined DBS HIV testing, and we restricted our analysis to those individuals who provided consent for both the questionnaire and the HIV testing. It may be that those individuals that declined testing were living with HIV, in which case we may have underestimated the true HIV prevalence.
AGYW are a focus for HIV prevention in Kenya, and many other countries, and understanding the HIV risks and vulnerabilities faced by AGYW, including AGYW who sell sex, is essential. Having actionable data on who to reach, where to reach those at highest risk, and the types of services required is critical for those implementing programs and for informing policy decisions. Our data support the
留言 (0)